GGOT: Detecting Disease Critical Transitions Using Gaussian Graphical Optimal Transport Embedded With Protein Interaction Networks.
This repository contains our proposed methods Gaussian Graphical Optimal Transport (GGOT) for detecting critical transitions and identifying trigger molecules of diseases, the corresponding pre-processed diseases datasets from TCGA and GEO databases, and pre-processed Protein-Protein Interaction (PPI) Networks of the Human and Mouse Genomes.
Code for the paper:
Wenbo Hua, Ruixia Cui, Heran Yang, Jingyao Zhang, Chang Liu, Jian Sun. "Detecting Disease Critical Transitions Using Gaussian Graphical Optimal Transport Embedded With Protein Interaction Networks"
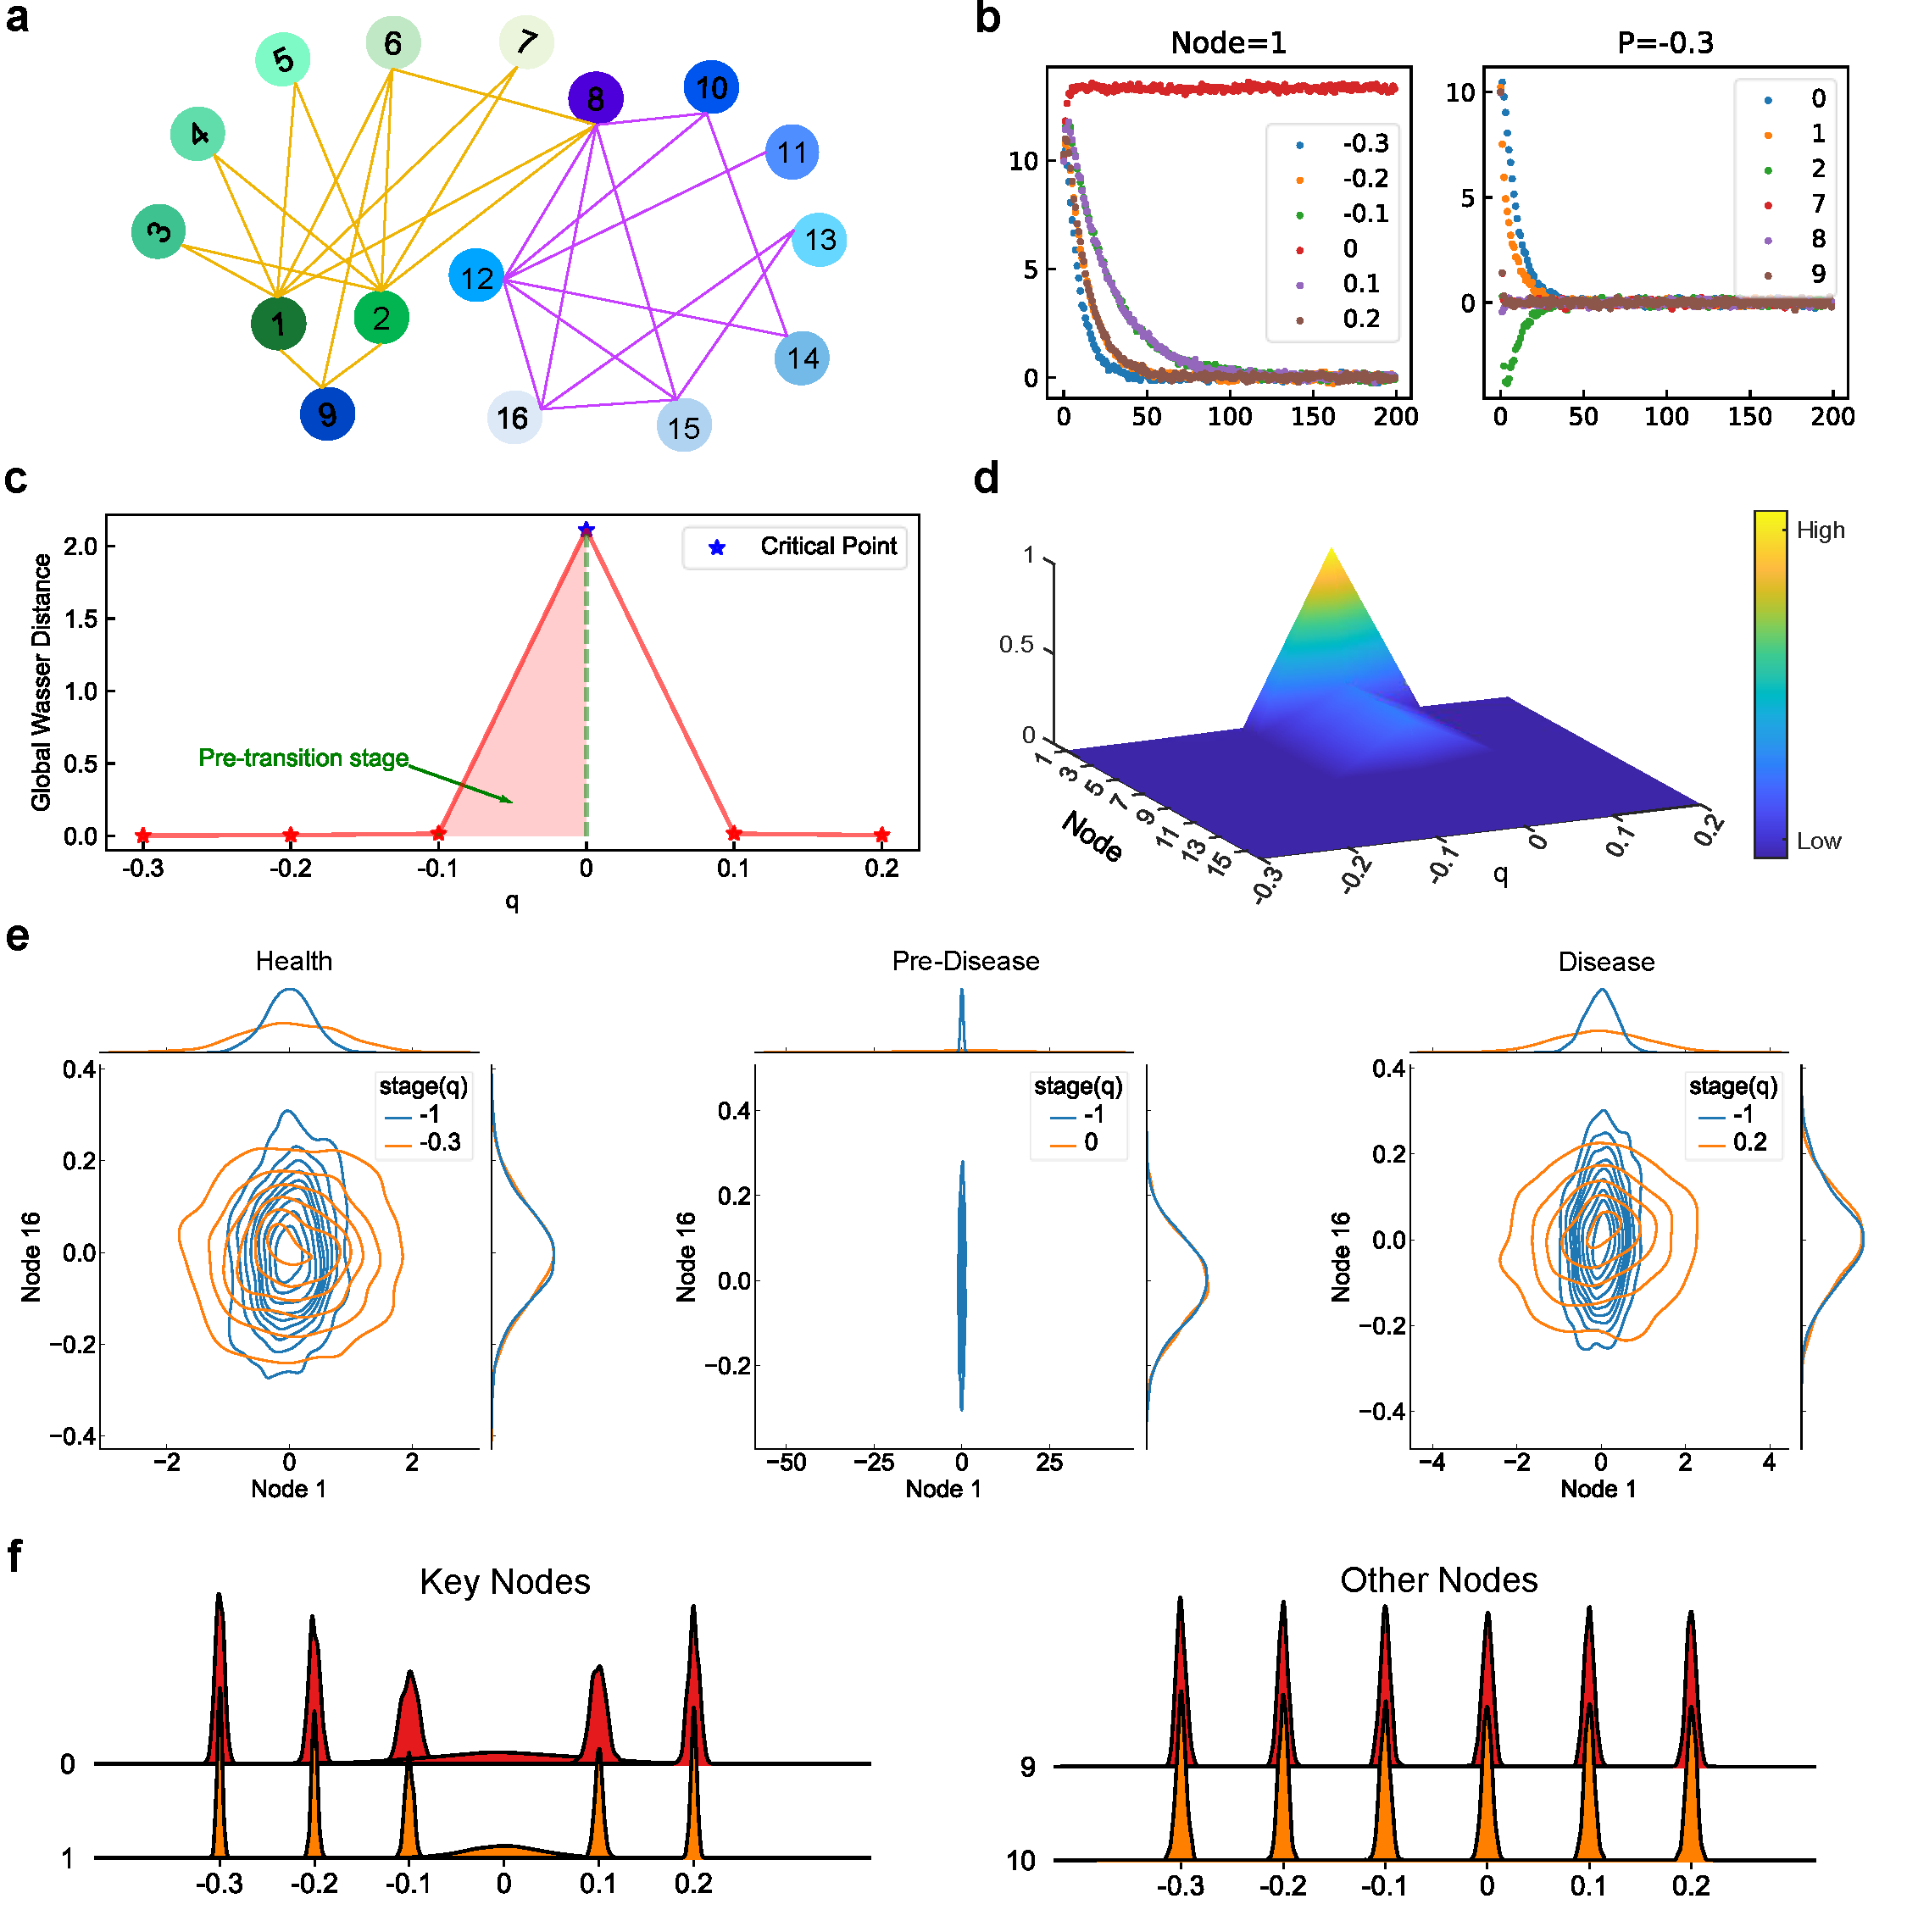
GGOT uses Gaussian graphical model, incorporating the gene interaction network, to model the data distributions at different disease stages. Then we use population-level optimal transport to calculate the Wasserstein distance and transport maps between stages, enabling us to detect critical transitions. By analyzing the per-molecule transport map, we quantify the importance of each molecule and identify the trigger molecules. Moreover, GGOT predicts the occurrence of critical transitions in unseen samples and visualizes the disease progression process.
Clicking on the name of the corresponding dataset will redirect you to the website to download the corresponding dataset. The dataset of XJTUSepsis needs to contact hwb0856@stu.xjtu.edu.cn to get access.
| Dataset | Description | Species | stages | Type of disease |
|---|---|---|---|---|
| GSE48452 | non-alcoholic fatty liver | Home sapiens | 4 | Chronic progressive benign disease |
| GSE2565 | lung injury | Mus musculus | 10 | Acute progressive noncritical disease |
| LUAD | lung adenocarcinoma | Home sapiens | 8 | Chronic progressive malignant disease |
| COAD | colon adenocarcinoma | Home sapiens | 8 | Chronic progressive malignant disease |
| XJTUSepsis | sepsis | Home sapiens | 8 | Acute progressive critical disease |
| GSE154918 | sepsis | Home sapiens | 4 | Acute progressive critical disease |
1 Create your environment and install required packages
conda env create -f environment.yaml -n yourenv2 Download the pre-processed Protein-Protein Interaction (PPI) Networks of the Human and Mouse Genomes into "PPI/". We construct the PPI networks using STRING database.
PPI Networks of two species:[GGOT_PPI]
3 Download the RNA-seq dataset of different diseases into "data/source/".
Raw datasets: [GGOT_datasets]
Make sure your data file tree is similar to the following.
GGOT
├──run_model.py
├──data/
│  ├──source
│  │  ├──GSE48452
│  │  │  ├──GSE48452.csv (RNA-seq expression)
│  │  │  ├──group.csv (stage information)
│  │  ├──GSE2565
│  │  │  ├──GSE48452.csv
│  │  │  ├──group.csv
│  │  ├──LUAD
│  │  │  ├──LUAD.csv
│  │  │  ├──group.csv
│  │  ├──......
│  ├──......
├──PPI
│  ├──Human
│  │  ├──ppi_database.npy
│  │  ├──map_gene_protein.csv
│  │  ├──map_gene_protein_full.csv
│  │  ├──symbol2id.csv
│  ├──Mus
│  │  ├──ppi_database.npy
│  │  ├──map_gene_protein.csv
│  │  ├──map_gene_protein_full.csv
│  │  ├──symbol2id.csv
├──......
- running model for the chronic progressive non-critical disease, GSE48452
python run_model.py -d GSE48452 -s Human- running model for the acute progressive non-critical disease, GSE2565
python run_model.py -d GSE2565 -s Mus- running model for the chronic progressive critical disease, LUAD, COAD
python run_model.py -d LUAD -s Human
python run_model.py -d COAD -s Human- running model for the acute progressive critical disease, XJTUSepsis, GSE154918
python run_model.py -d XJTUSepsis -s Human
python run_model.py -d GSE154918 -s Humanpython visualization.py -d GSE2565If you have any problems with this repository, please send emails to hwb0856@stu.xjtu.edu.cn for discussions.

