These examples are using the Graph Visualization Tool Gephi. Gephi comes with a Python scripting engine, that can be used to create nodes and edges from arbitrary inputs. The work you find here was originaly created as a Peer Grading Assignment for the Coursera MOOC Social Network Analysis and has been slightly adapted since then. If you're interested in social network analysis then the book project of my Coursera Class might interest you as well. It contains a lot of astonishing work created by my fellow students.
The second Use case was build later, when I wanted to visualize the complexity of a database parent/child structure.
This script uses the XML output as produced by JDepend eclipse pluging. As my report showed, you can do some nice things on package dependency graphs and be it only to make them colorful ;-)
- Prerequisites: You have chosen your favorite Java(tm) IDE and installed the JDepend plugin. I use eclipse as my favorite IDE
- Run JDepend on your project.
- Export JDepend output as XML file, let's name it <jdepend.xml>. I have included an example for such an XML created from JUnit(tm). check out folder /examples
- Git Clone this repository to your local machine, let's say to folder <yourpath>
- Open the file jdepend-xml-to-nodes_and_edges.py
- Edit the line which starts with
cfg_yourJDependInputFile =. Point the value to your file <jdepend.xml> including the full path.cfg_stripCommonBasePackage. Create a list of Package prefixes which will be stripped of in order to make the lables shorter. Note: The full qualified package name is still available in column package. In my JUnit example I've used["org.junit.","junit."]- Please don't forget to save your changes.
- Open Gephi and create a new Project
- In Gephi - Change to Datalaboratory View and open the Scripting Console (somewhere on the left side)
- Now type into the Scripting Console Window:
execfile("<yourpath>\\jdepend-xml-to-nodes_and_edges.py")and press <Enter>. Note: Please use double backslash on Windows, e.g.execfile("D:\\temp\\jdepend-xml-to-nodes_and_edges.py") - Hopefully the script runs without errors. Checkout both the Nodes and the Edges Tab of the Datalaboratory View. It should be populated with entries now.
- Now you're ready to switch to Gephis' Overview View and checkout the dependency graph.
- Finally it's time to figure out what Gephi can do:
- Try out several Layout Algorithms.
- Go and compute Graph Metrics like for instance Eccentrisity or Betweeness
- Colour your nodes by applying the Partition Function. You might find partitioning by Modularity interesting.
I created the first Version of this script back in 2013 for the Peer Project of the Coursera MOOC Social Network Analysis. I have included my report in this repository which contains some analysis for JUnit showing that JUnit has, well, a Architecture that is close to a very random Erd?s–Rényi Graph...;-)
Here's some files for you:
- As a shortcut I have included a .gephi graph file for Junit, ready for you to do some experiments. Check out <yourpath>/examples/junit/junit_as_graph.gephi
- Here's my report for the Social Network Analysis MOOC: Report
- And this is a visualisation of JUnit
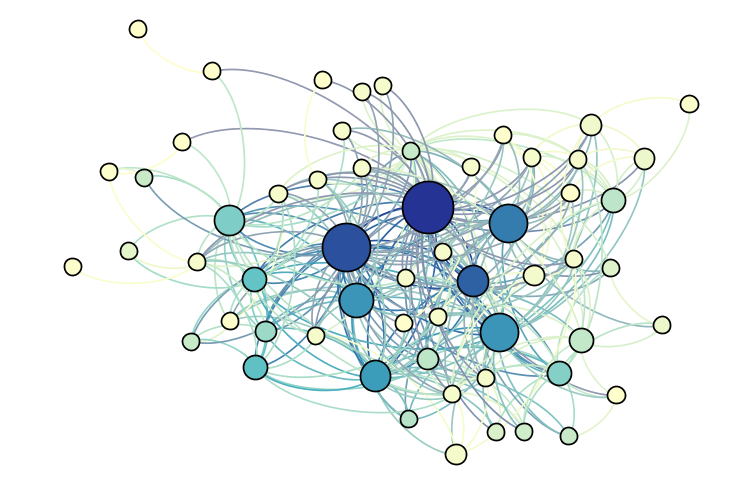
- What does the script read in from a JDepend XML File? It reads the package dependency information and the stats as computed by JDepends
- Are Package-Cycles read in as well? Yes, Cycles are read in and edges participating or just leading into a cycle are colored red.
- How is the size of the nodes computed? It's basically computed by in-degree, i.e. meaning that a package is used by another package. Packages which are more often used get bigger nodes.
- What is your favourite layout algorithm? I tend to stick with "Force Atlas 2" and "Fruchterman Reingold". Actually the script contains a very basic/primitive Layout which uses the Instability/Abstractness metrics as computed by JDepend
- Why is this just a Python script and not a full blown Gephi Plugin? This is just due to time constraints and me being a lazy guy ;-) But probably I try to fix this in the future...someday
- Will there be future work? Yes, probably. I think about using Gephi to...
- Edit a macker file which might be used for dependencie evaluation in maven scripts
- Build a script that reads in macker files and validates it against a given package dependency graph.
Todo