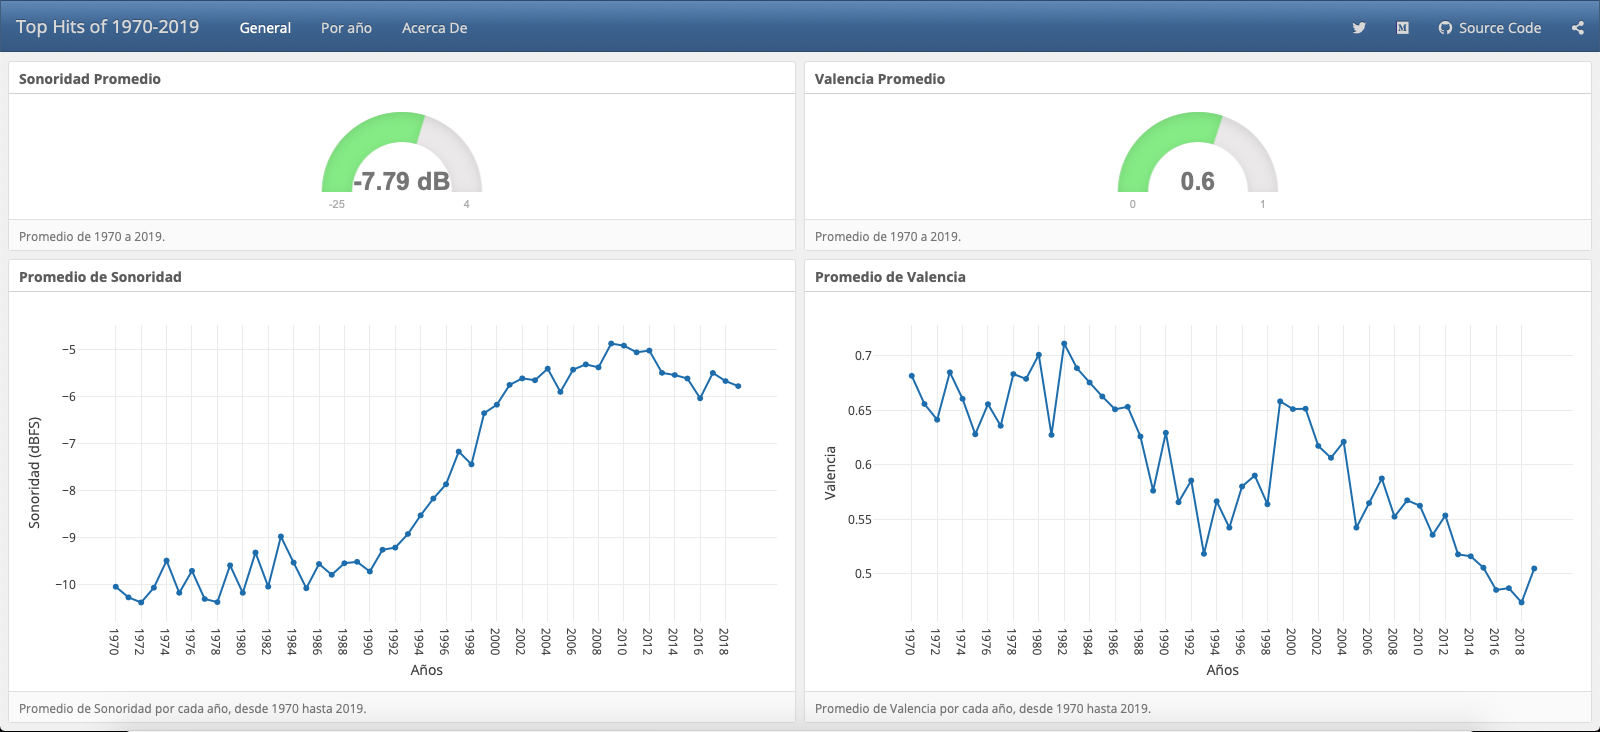
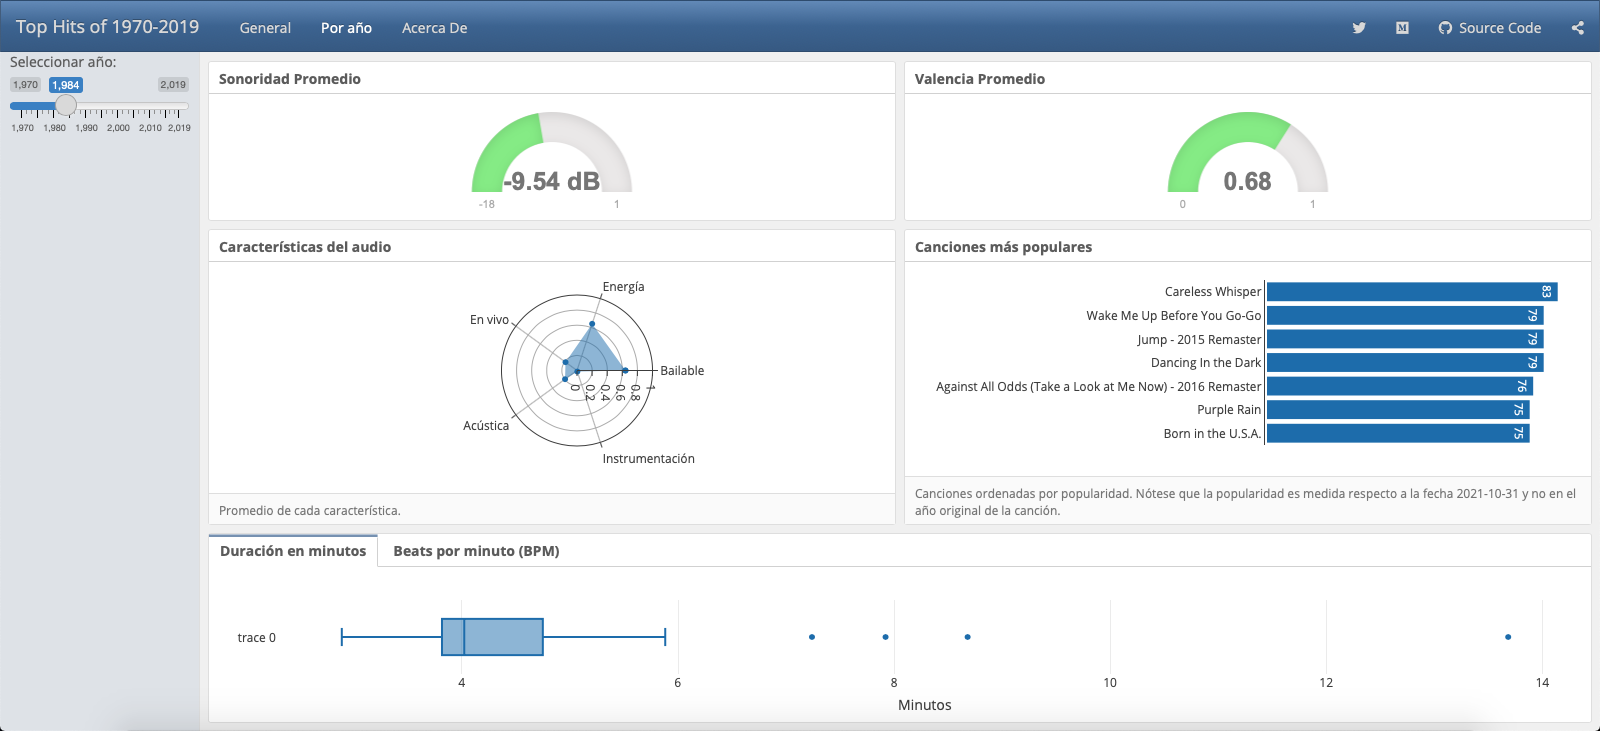
Repository for a dashboard made with R, using the Flexdashboard and Shiny packages. The whole R code is in the file index.Rmd.
The flexdashboard is made interactive with the Shiny package, it was deployed to Shinyapps.io and can be found at https://hugojira.shinyapps.io/TopHits1970-2019/.
The data was downloaded from the Spotify Web API with R code using the Spotifyr wrapper. The code and a detail description on the data can be found in this another GitHub repo.
The goal of the dashboard is to show trends in the top hits songs, from 1970 to 2019, specifically for English spoken music. One of the things shown with the plots is the Loudness War, which is quantified by the decibels relative to full scale (dBFS).
The dashboard has the next two pages to show visualizations

