A simple fortran module that generates figures using PGF/Tikz.
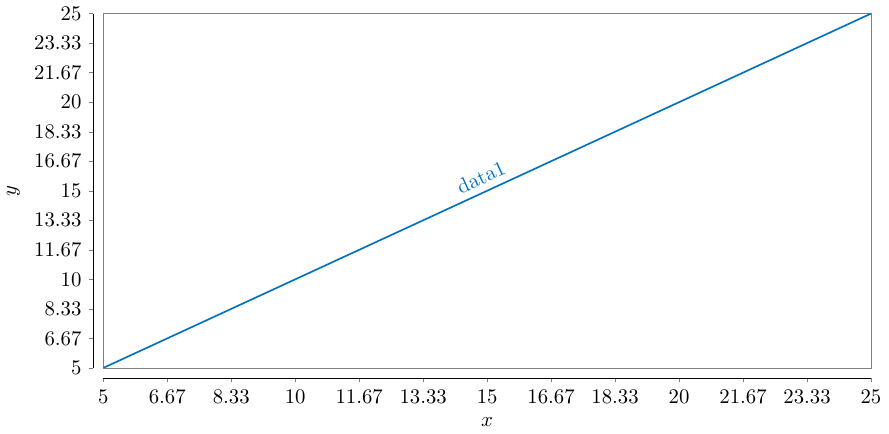
call tikz(z) |
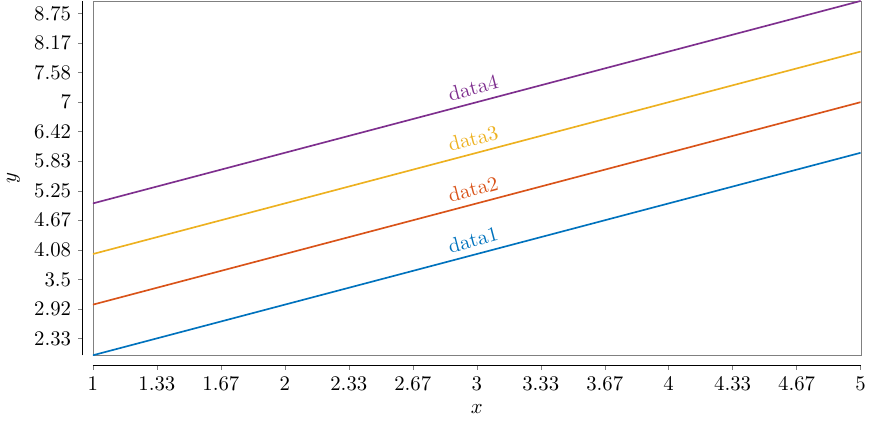
call tikz(x, y) |
 |
 |
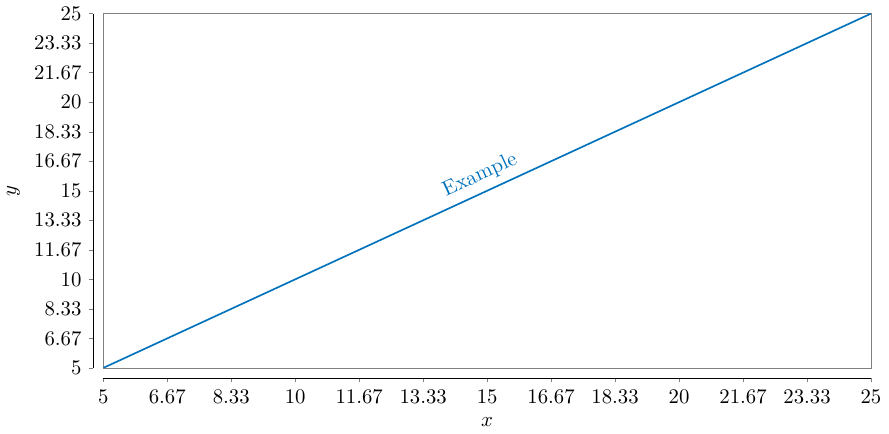
call tikz(z, legend = "Example") |
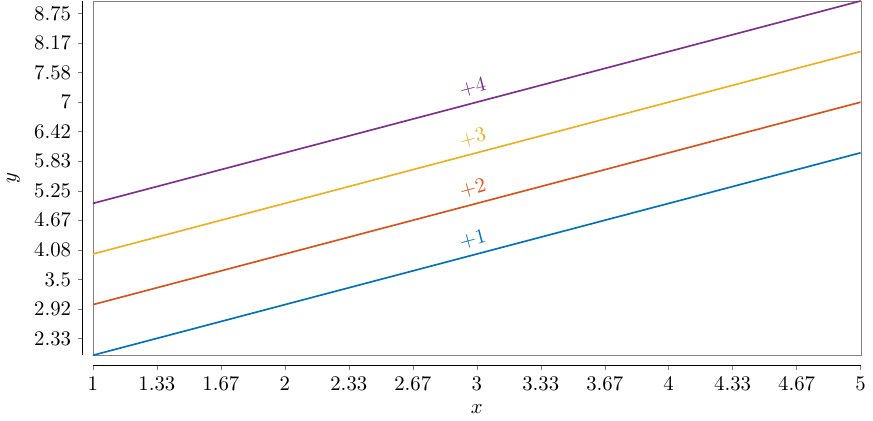
call tikz(x, y, legend = "$+1$; $+2$; $+3$; $+4$ ") |
 |
 |
Dependency: PGF/Tikz
I write this library to be zero installation library.
Simply copy and paste the tikz_module.F90 into your project or library directory and it should be able to work by use tikz_module.
Only support 2D plot for now.
The full syntax is
call tikz(x, y, title, xlabel, ylabel, legend, name, options)x: one dimensional arrayy: one or two dimensional arraytitle: allocatable characters for figure title (optional)xlabel: allocatable characters for label on x-axis (optional)ylabel: allocatable characters for label on y-axis (optional)legend: allocatable characters that denotes legend that use semicolon (;) as delimitername: file name for.tex,.dat, and.pdffile (optional)optionssee options
The abbreviated syntax can be
call tikz(y)        !! x is generated by linear spaced grid between minimum and maximum of y
call tikz(x, y)
options are a character type that works to assign user-defined options to the generated tikz script.
Each category (legend, color, etc) are separated by semicolor ;, and each item under category is separated by comma ,.
The delimiter between category (e.g. legend) and items (e.g. box, north east) is colon :.
Now it supports:
legendorle: legend type and location- legend type:
lineorbox,linemeans legend on the line,boxmeans traditional legend - legend location: see 84.9.5 Legend Placement: Inside to the Data Visualization
- legend type:
colororc: color of each linelinestyleorls: line style of each line, see 4.7.2Line Styles for more detail
Examples:
!! example: plot 2D with predetermined color
call tikz(x, y, name = 'tikzplot_4_col.tex', &
    options = 'color: gray, blue, orange, yellow')

!! example: plot 2D with legend in the box and box at north east
call tikz(x, y, name = 'tikzplot_4_le_box.tex', &
    options = 'legend: box, north east')

!! example: plot 2D with predetermined color, legend in the box, and legend at north east
call tikz(x, y, name = 'tikzplot_4_col_box.tex', &
    options = 'color: gray, blue, orange, yellow; &
legend: box, north east')The Sloped section of template comes from stack overflow, which allows me to put legend along the slope at the function.
\documentclass[tikz]{standalone}
\usepackage{tikz}
\usepackage{pgfplots}
\usetikzlibrary{decorations}
\usetikzlibrary{decorations.pathreplacing, intersections, fillbetween}
\usetikzlibrary{calc,positioning}
\pgfplotsset{compat=newest, scale only axis, width = 13cm, height = 6cm}
\pgfplotsset{sciclean/.style={axis lines=left,
        axis x line shift=0.5em,
        axis y line shift=0.5em,
        axis line style={-,very thin},
        axis background/.style={draw,ultra thin,gray},
        tick align=outside,
        xtick distance=<assigned by tikz-fortran>,
        ytick distance=<assigned by tikz-fortran>,
        major tick length=2pt}}

% Create fake \onslide and other commands for standalone picture
\usepackage{xparse}
\NewDocumentCommand{\onslide}{s t+ d<>}{}
\NewDocumentCommand{\only}{d<>}{}
\NewDocumentCommand{\uncover}{d<>}{}
\NewDocumentCommand{\visible}{d<>}{}
\NewDocumentCommand{\invisible}{d<>}{}

\makeatletter
\tikzset{
Sloped/.code = {
\iftikz@fullytransformed% tikz.code.tex
    \tikzset{sloped}
\else
    \pgfgettransformentries{\mya}{\myb}{\myc}{\myd}{\mys}{\myt}%
    \tikzset{sloped, transform shape, rotate = {atan2(\myb,\mya)}}%
\fi
}
}
\makeatother

% ---------------------------------------------------------------------
% Coordinate extraction
% #1: node name
% #2: output macro name: x coordinate
% #3: output macro name: y coordinate
\newcommand{\Getxycoords}[3]{%
    \pgfplotsextra{%
        % using `\pgfplotspointgetcoordinates' stores the (axis)
        % coordinates in `data point' which then can be called by
        % `\pgfkeysvalueof' or `\pgfkeysgetvalue'
        \pgfplotspointgetcoordinates{(#1)}%
        % `\global' (a TeX macro and not a TikZ/PGFPlots one) allows to
        % store the values globally
         \global\pgfkeysgetvalue{/data point/x}{#2}%
         \global\pgfkeysgetvalue{/data point/y}{#3}%
     }%
}
% ---------------------------------------------------------------------

\begin{document}

\begin{tikzpicture}


\begin{axis}[
    sciclean,
    xlabel = {<assigned by tikz-fortran>},
    ylabel = {<assigned by tikz-fortran>},
    xmin = <assigned by tikz-fortran>,
    xmax = <assigned by tikz-fortran>,
    ymin = <assigned by tikz-fortran>,
    ymax = <assigned by tikz-fortran>,
    legend cell align = left,
    legend pos = <assigned by tikz-fortran>,
    title = {<assigned by tikz-fortran>}]

<plotting assigned by tikz-fortran>

\end{axis}

\end{tikzpicture}

\end{document}Run fpm run --example or gfortran -o run src/tikz_module.F90 example/example.f90 && ./run to see example