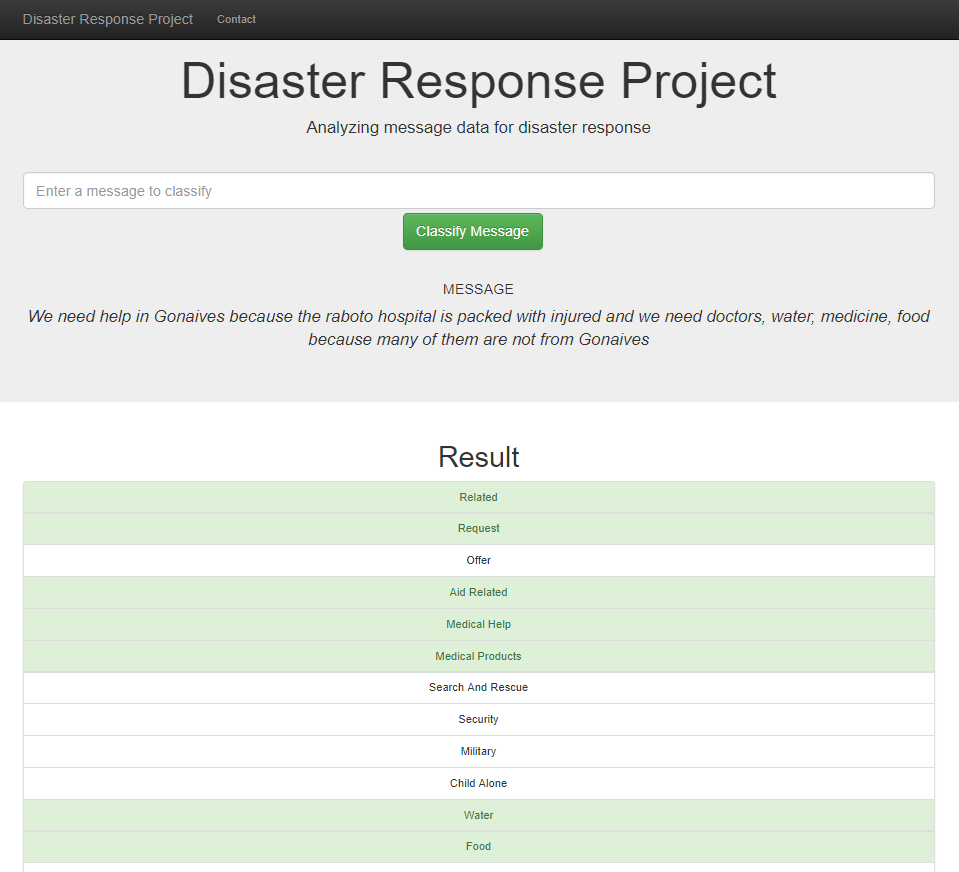
Dashboard for disaster response professionals
The target of this project is to classify messages sent during and after a disaster. With a correct classification of the messages the different disaster response organizations are able to provide much more efficient and effective help for the people that need it.
This project is part of the Data Science Nanodegree @Udacity and is done in collaboration with FigureEight.
There are three main parts of the project:
- ETL Pipeline - takes the messages.csv and categories.csv as input and produces combined sqlite table.
- ML Pipeline - trains and evaluates the model and produces a pickle file from the trained model. This model is then used from the dashboard.
- Dashboard - shows some statistics about the training data and allows the user to input and classify a message.
After the intial cleaning of the data the following classes were used to prepare the data for classification:
The classification of the input vectors was done individually per category by using a MultiOutputClassifier combined with an AdaBoostClassifier (which yielded slightly better results than a RandomForestClassifier)
Because of the unbalanced distributions a average f1-score (weighted average) over all the categories has been used. With a test size of 2% (as suggested in the task-position) a score of 94.7% has been achieved.
Entering the messages manually suits demonstrations purposes but will not fit the demands of disaster response professionals. To make the project suitable for production we would need to build a more sophisticated API or a Microservice.
To use the dashboard you first need to clean the data. After cleaning the data you can train the model and export it for the web application.
The following packages need to be installed for the project:
- numpy, pandas
- scikit-learn
- nltk
- sqlalchemy, pickle
- flask, plotly, json
- pytest
To run the etl pipeline you can execute the following command in the data folder:
python process_data.py messages.csv categories.csv DisasterResponse.db
To train and serialize the model you can execute the following command:
python models/train_classifier.py data/DisasterResponses.db classifier.pkl
To start the web app you can execute this line in the root directory:
python run.py
The feature extraction is hardened with some tests. You can execute all tests by executing the following line in the root directory:
pytest
- Udacity - for the project basis and the teaching
- FigureEight - for providing us with real world data from actual disasters


