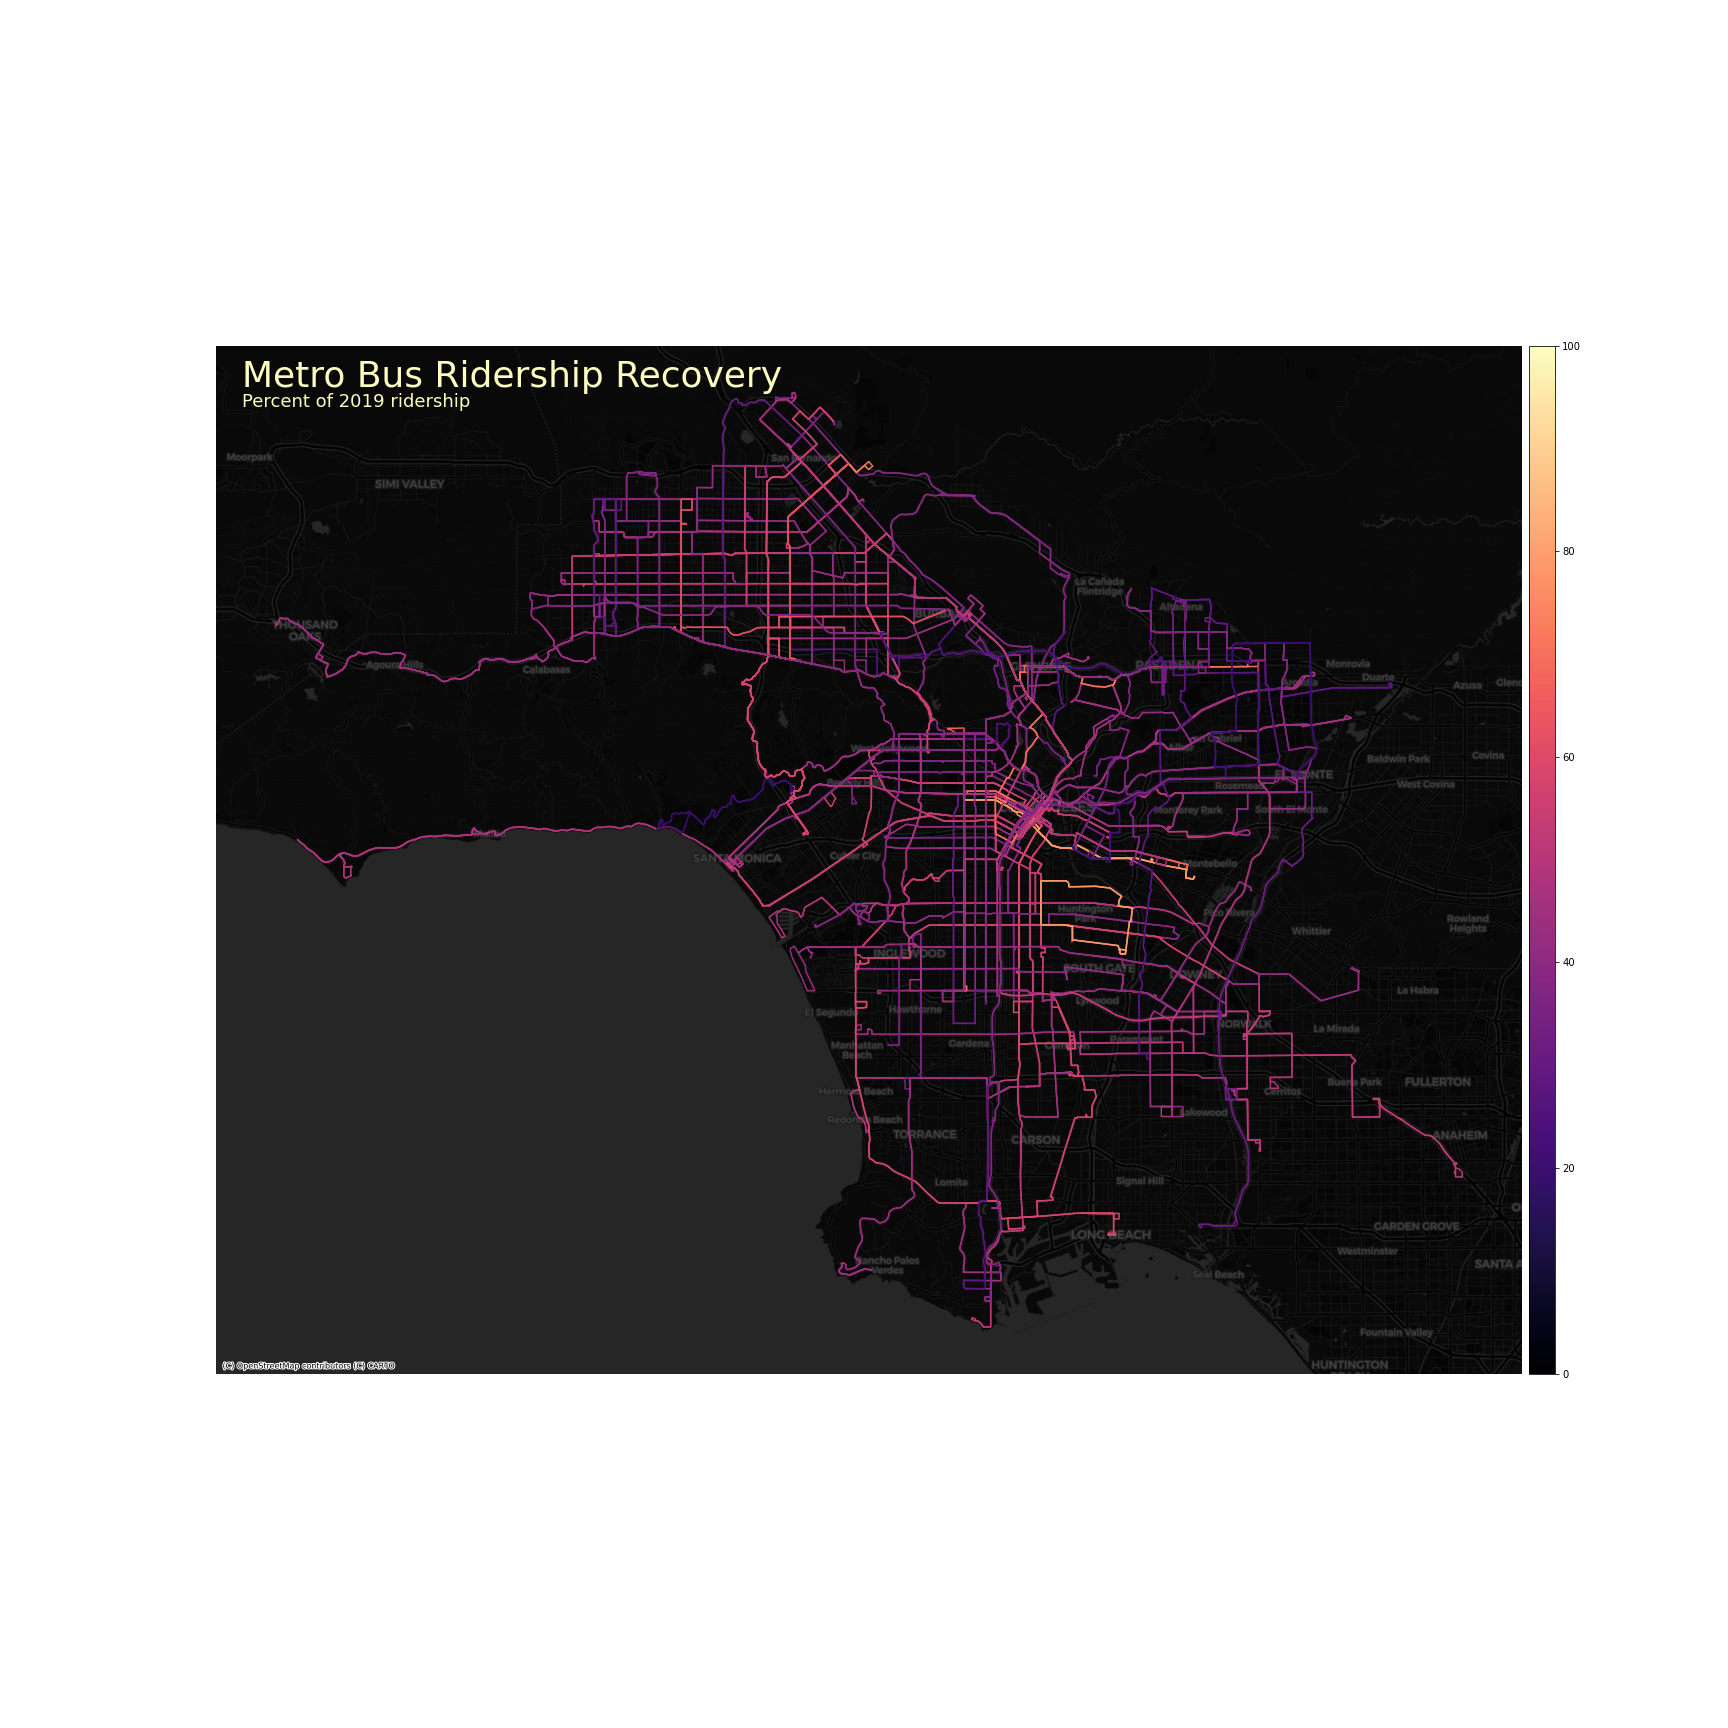
This repository contains code and data analyzing at Los Angeles Metro ridership over time. In particular, it looks at which lines have recovered their ridership in the COVID-19 era, and which ones have not.
Unfortunately, Metro does not publish stop or neighborhood level data, so it can be difficult to identify precisely which neighborhoods have seen the biggest changes, but nonetheless, some broad patterns are visible.
scrape-ridership.py- Downloads raw ridership data from https://isotp.metro.net/MetroRidership/Index.aspx and stores it as a parquet file.process-data.py- Processes the raw ridership data into a form more easily analyzed.metro-ridership-and-covid-recovery.ipynb- notebook producing some visualizations.
metro-ridership-{date}.parquet- Raw ridership datametro-{rail, bus}-recovery.{csv,parquet}- processed ridership data
metro-recovery-map.png- Map of ridership relative to 2019 levelsmetro-recovery-chart.{png, html}- Chart showing recovery through time of the top 30 bus lines (according to 2019 ridership).
