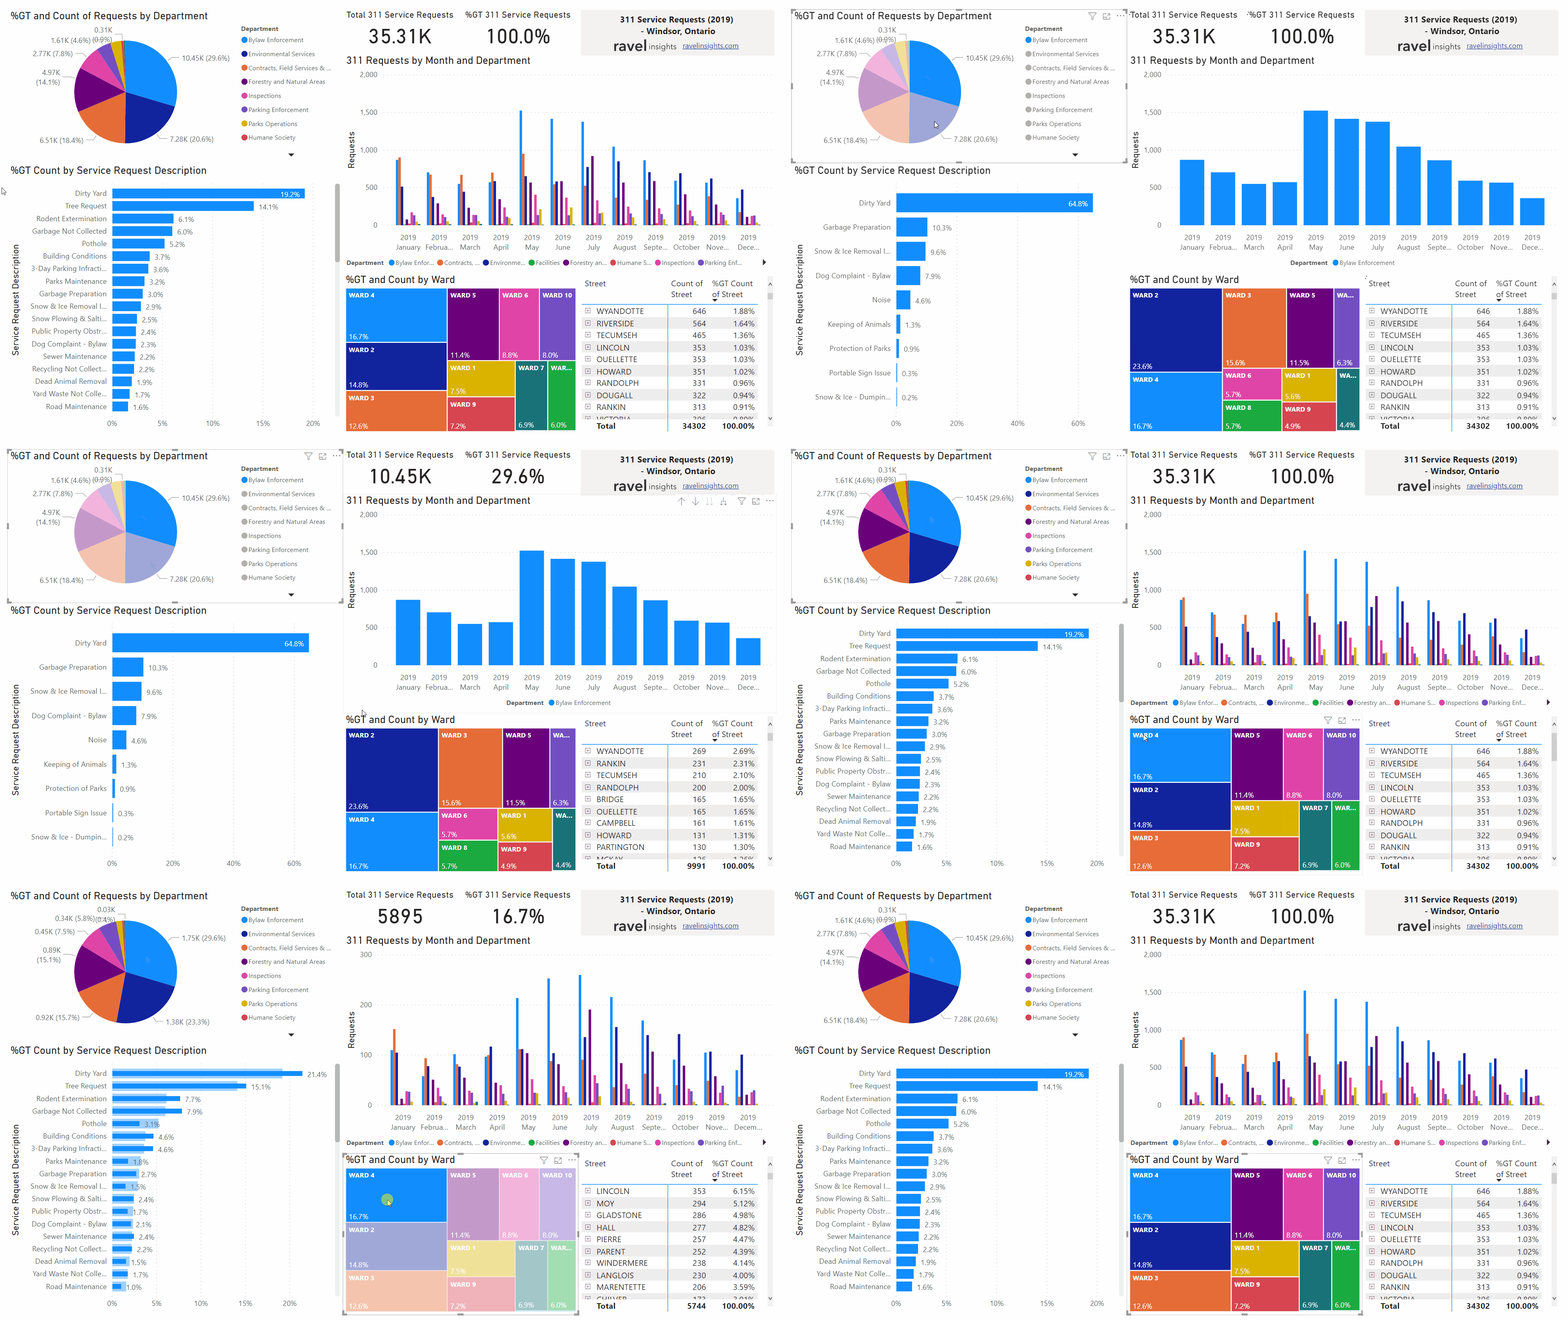
Welcome to the Power BI repository! This repository contains sample projects related to Microsoft Power BI, a powerful tool for business analytics and data visualization.
Power BI is a business analytics tool developed by Microsoft. It allows users to visualize data, create interactive reports and dashboards, and share insights across their organization. Power BI connects to various data sources, transforms data, and provides a comprehensive platform for data analysis and reporting.
- Data Visualization: Create interactive and visually appealing charts, graphs, and maps.
- Data Transformation: Clean and transform data using Power Query Editor.
- Reports and Dashboards: Build custom reports and dashboards with a drag-and-drop interface.
- Data Integration: Connect to a wide range of data sources, including databases, spreadsheets, and cloud services.
- Collaboration: Share reports and dashboards with team members and stakeholders.
- Advanced Analytics: Perform advanced data analysis with DAX (Data Analysis Expressions) and integrate with Azure Machine Learning.
To get started with Power BI:
- Download Power BI Desktop: Download Power BI Desktop
- Create a Power BI Account: Sign up for a Power BI account here.
- Explore Tutorials and Documentation:
- Access Community Resources:
This repository includes:
- Sample Projects: Example Power BI reports and dashboards demonstrating various features and techniques.
- Tutorials: Step-by-step guides on using Power BI for data visualization and analysis.
- Templates: Reusable Power BI templates for common reporting scenarios.
- Scripts: Power Query and DAX scripts for data transformation and analysis.
If you'd like to contribute to this repository, feel free to:
- Fork the repository and create a pull request with your changes.
- Open an issue to suggest improvements or report bugs.
| Project Name | Description | GitHub |
|---|---|---|
| Workout Wednesday | Participate in the Workout Wednesday challenges, which focus on re-creating data-driven visualizations using Power BI. Each week features a new challenge to practice and enhance your Power BI skills. | GitHub |
| Road Accident Dashboard | A Power BI dashboard that analyzes road accident data for 2021 and 2022, providing insights on key metrics such as total casualties, vehicle types, road conditions, and accident severity. | GitHub |
| Spotify Data Dashboard | An advanced Power BI dashboard analyzing Spotify song data, including streaming statistics, playlist counts, and song characteristics across platforms like Apple Music, Deezer, and Shazam. | GitHub |
| Plant Co. Performance Dashboard | A Power BI dashboard analyzing performance for 2023. Includes dynamic visuals such as Waterfall, Treemap, Combo Chart, and Scatter Plot to track YTD vs PYTD trends and profitability segmentation by product type. | GitHub |
Thank you for visiting this repository! I hope you find these resources helpful in your Power BI journey.
Happy Analyzing! 🚀
