NetObserv Operator is a Kubernetes / OpenShift operator for network observability. It deploys a monitoring pipeline to collect and enrich network flows. These flows can be produced by the NetObserv eBPF agent, or by any device or CNI able to export flows in IPFIX format, such as OVN-Kubernetes.
The operator provides dashboards, metrics, and keeps flows accessible in a queryable log store, Grafana Loki. When used in OpenShift, new views are available in the Console.
You can install NetObserv Operator using OLM if it is available in your cluster, or directly from its repository.
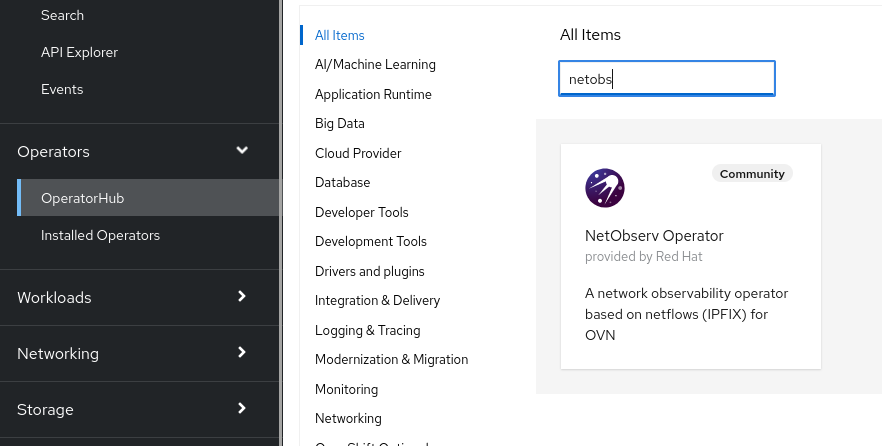
NetObserv Operator is available in OperatorHub with guided steps on how to install this. It is also available in the OperatorHub catalog directly in the OpenShift Console.
Please read the operator description in OLM. You will need to install Loki, some instructions are provided there.
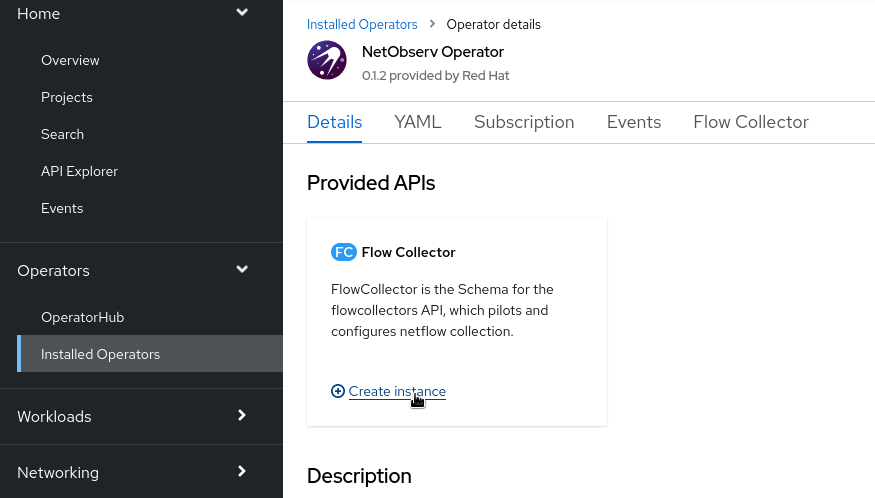
After the operator is installed, create a FlowCollector resource:
Refer to the Configuration section of this document.
A couple of make targets are provided in this repository to allow installing without OLM:
git clone https://github.com/netobserv/network-observability-operator.git && cd network-observability-operator
make deploy deploy-loki deploy-grafana
It will deploy the operator in its latest version, with port-forwarded Loki and Grafana.
Note: the
loki-deployscript is provided as a quick install path and is not suitable for production. It deploys a single pod, configures a 1GB storage PVC, with 24 hours of retention. For a scalable deployment, please refer to our distributed Loki guide or Grafana's official documentation.
To deploy the monitoring pipeline, this make target installs a FlowCollector with default values:
make deploy-sample-crAlternatively, you can grab and edit this config before installing it.
You can still edit the FlowCollector after it's installed: the operator will take care about reconciling everything with the updated configuration:
kubectl edit flowcollector clusterRefer to the Configuration section of this document.
To deploy a specific version of the operator, you need to switch to the related git branch, then add a VERSION env to the above make command, e.g:
git checkout 0.1.2
VERSION=0.1.2 make deploy deploy-loki deploy-grafana
kubectl apply -f ./config/samples/flows_v1beta1_flowcollector_versioned.yaml
Beware that the version of the underlying components, such as flowlogs-pipeline, may be tied to the version of the operator (this is why we recommend switching the git branch). Breaking this correlation may result in crashes. The versions of the underlying components are defined in the FlowCollector resource as image tags.
Pre-requisite: OpenShift 4.10 or above
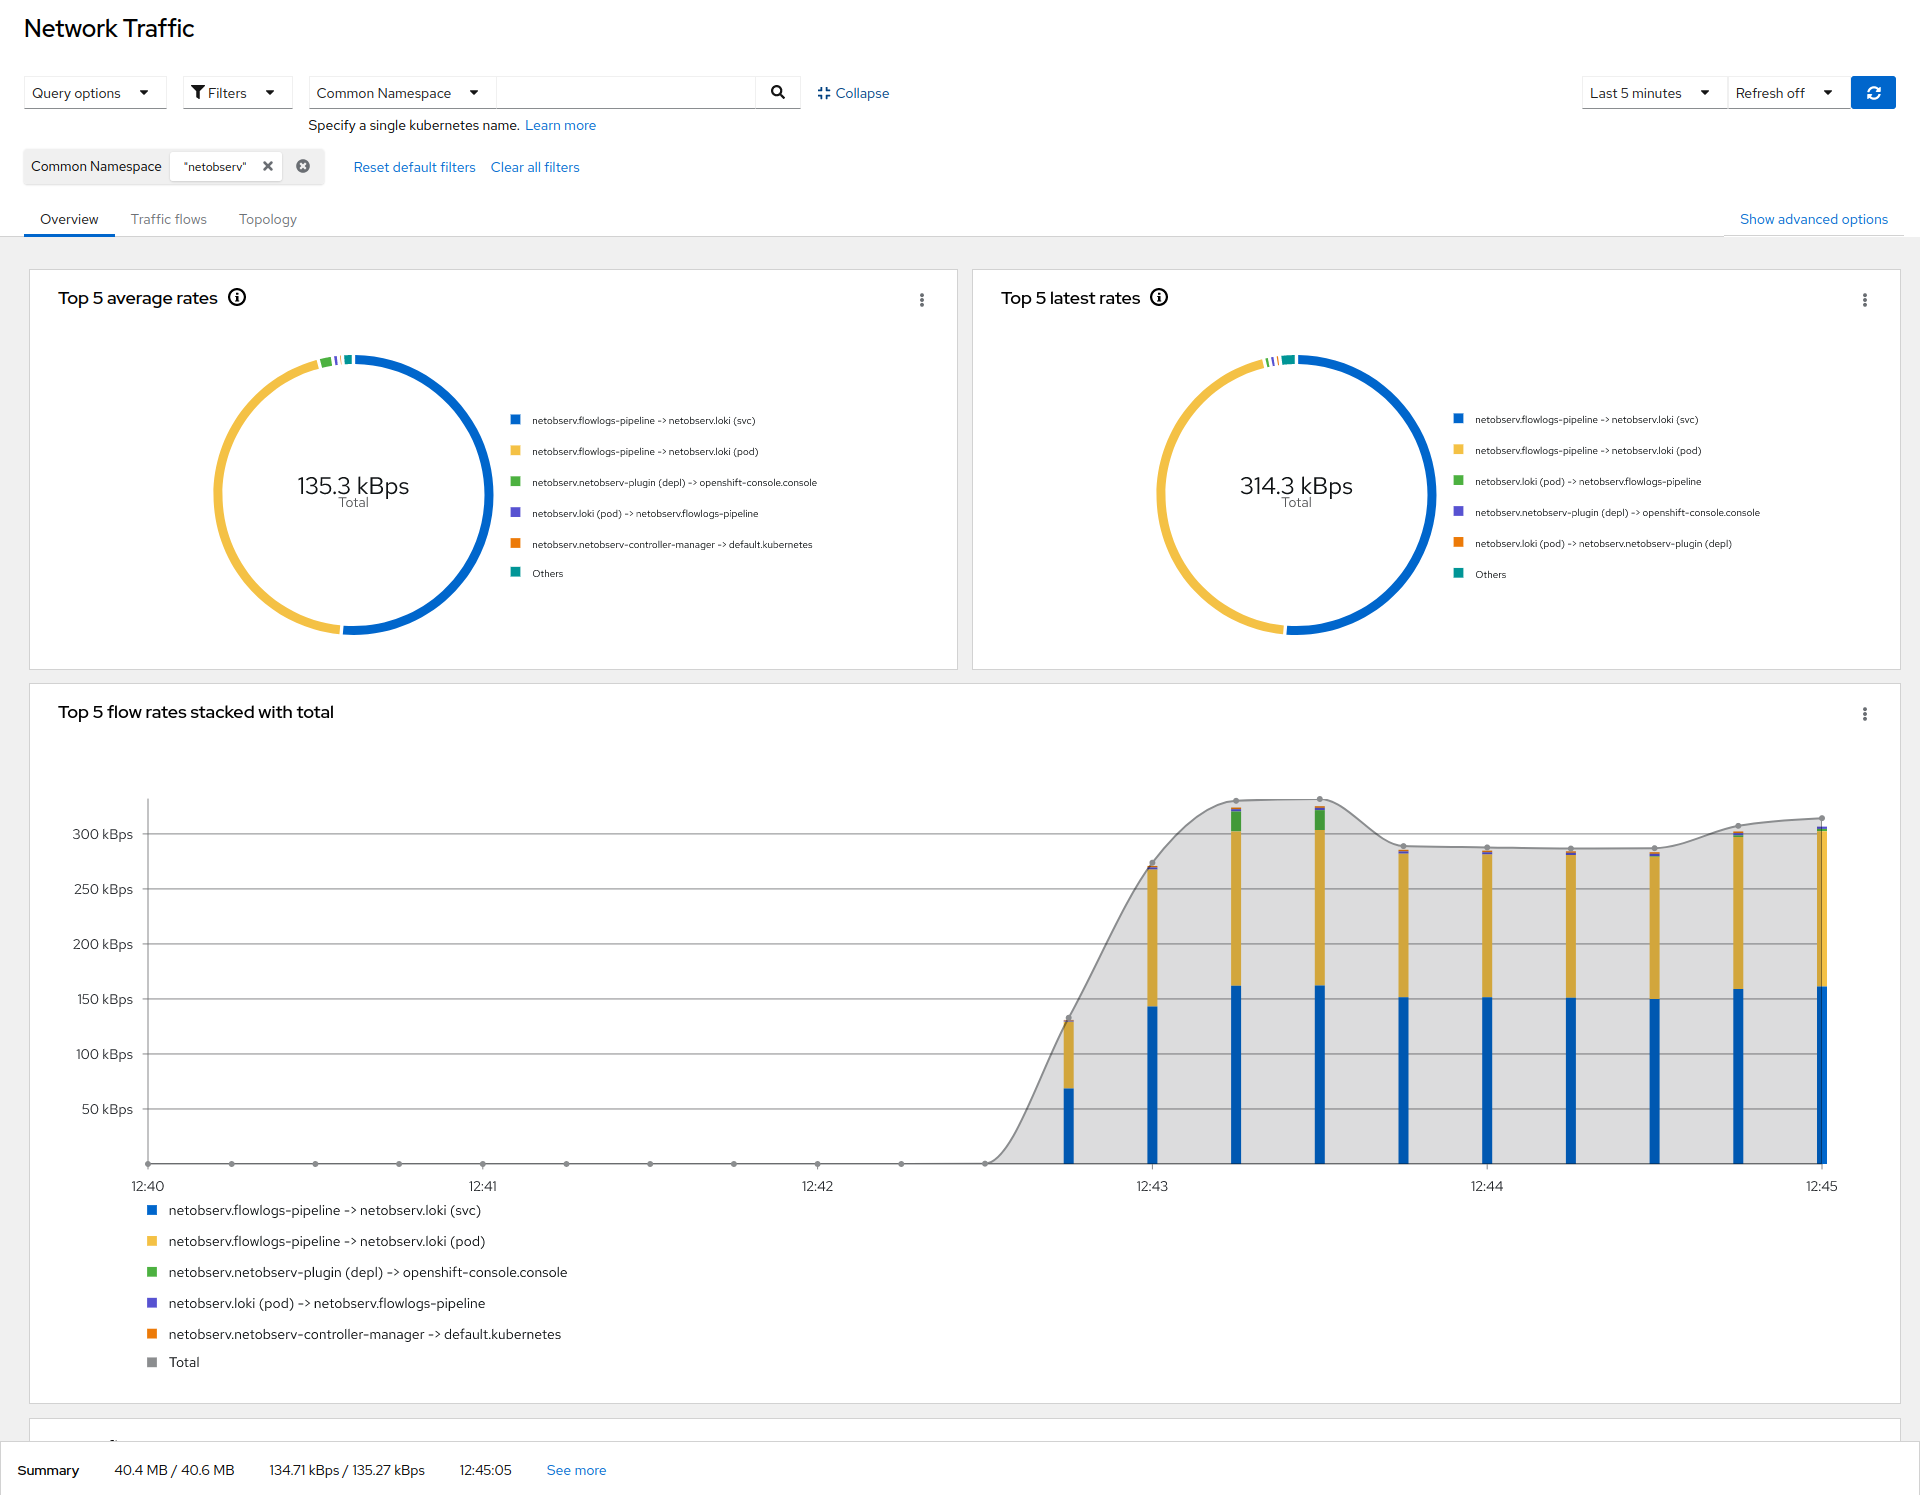
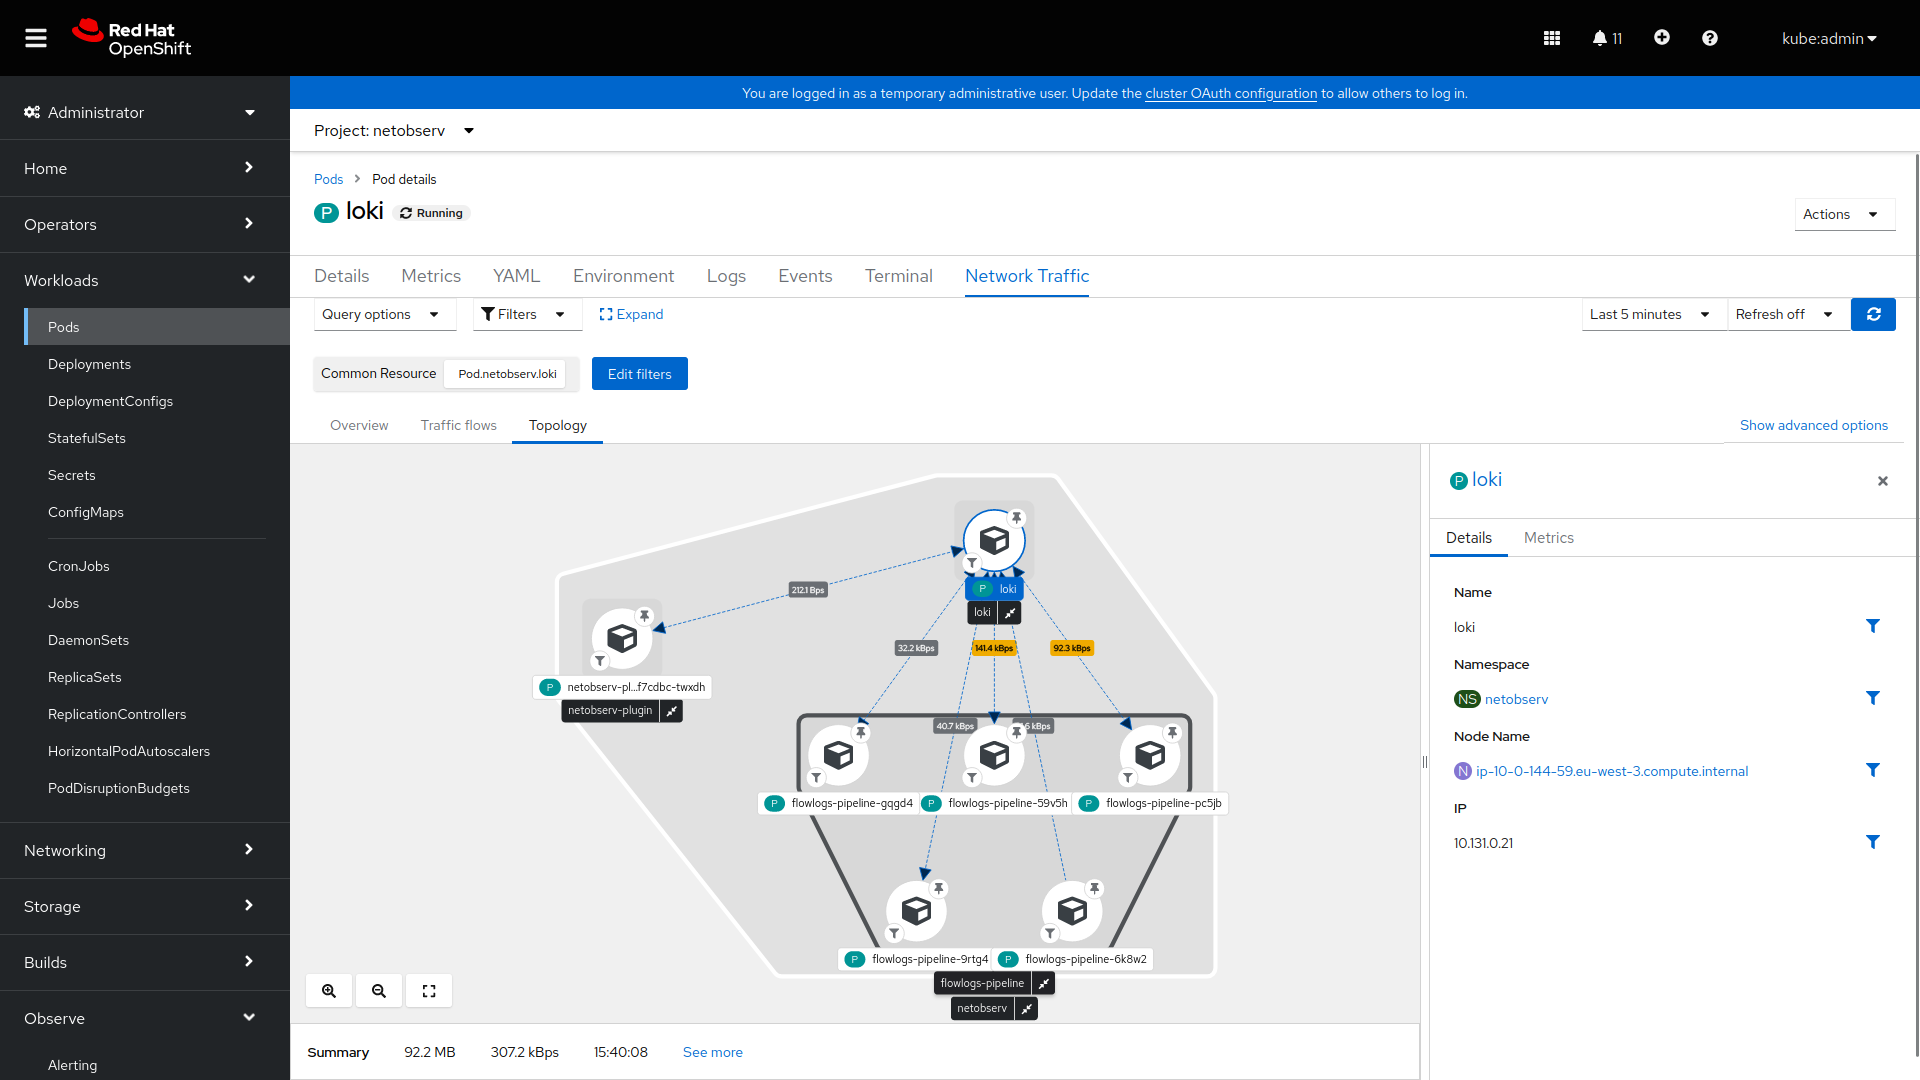
If the OpenShift Console is detected in the cluster, a console plugin is deployed when a FlowCollector is installed. It adds new pages and tabs to the console:
Charts on this page show overall, aggregated metrics on the cluster network. The stats can be refined with comprehensive filtering and display options. Different levels of aggregations are available: per node, per namespace, per owner or per pod/service). For instance, it allows to identify biggest talkers in different contexts: top X inter-namespace flows, or top X pod-to-pod flows within a namespace, etc.
The watched time interval can be adjusted, as well as the refresh frequency, hence you can get an almost live view on the cluster traffic. This also applies to the other pages described below.
The topology view represents traffic between elements as a graph. The same filtering and aggregation options as described above are available, plus extra display options e.g. to group element by node, namespaces, etc. A side panel provides contextual information and metrics related to the selected element.
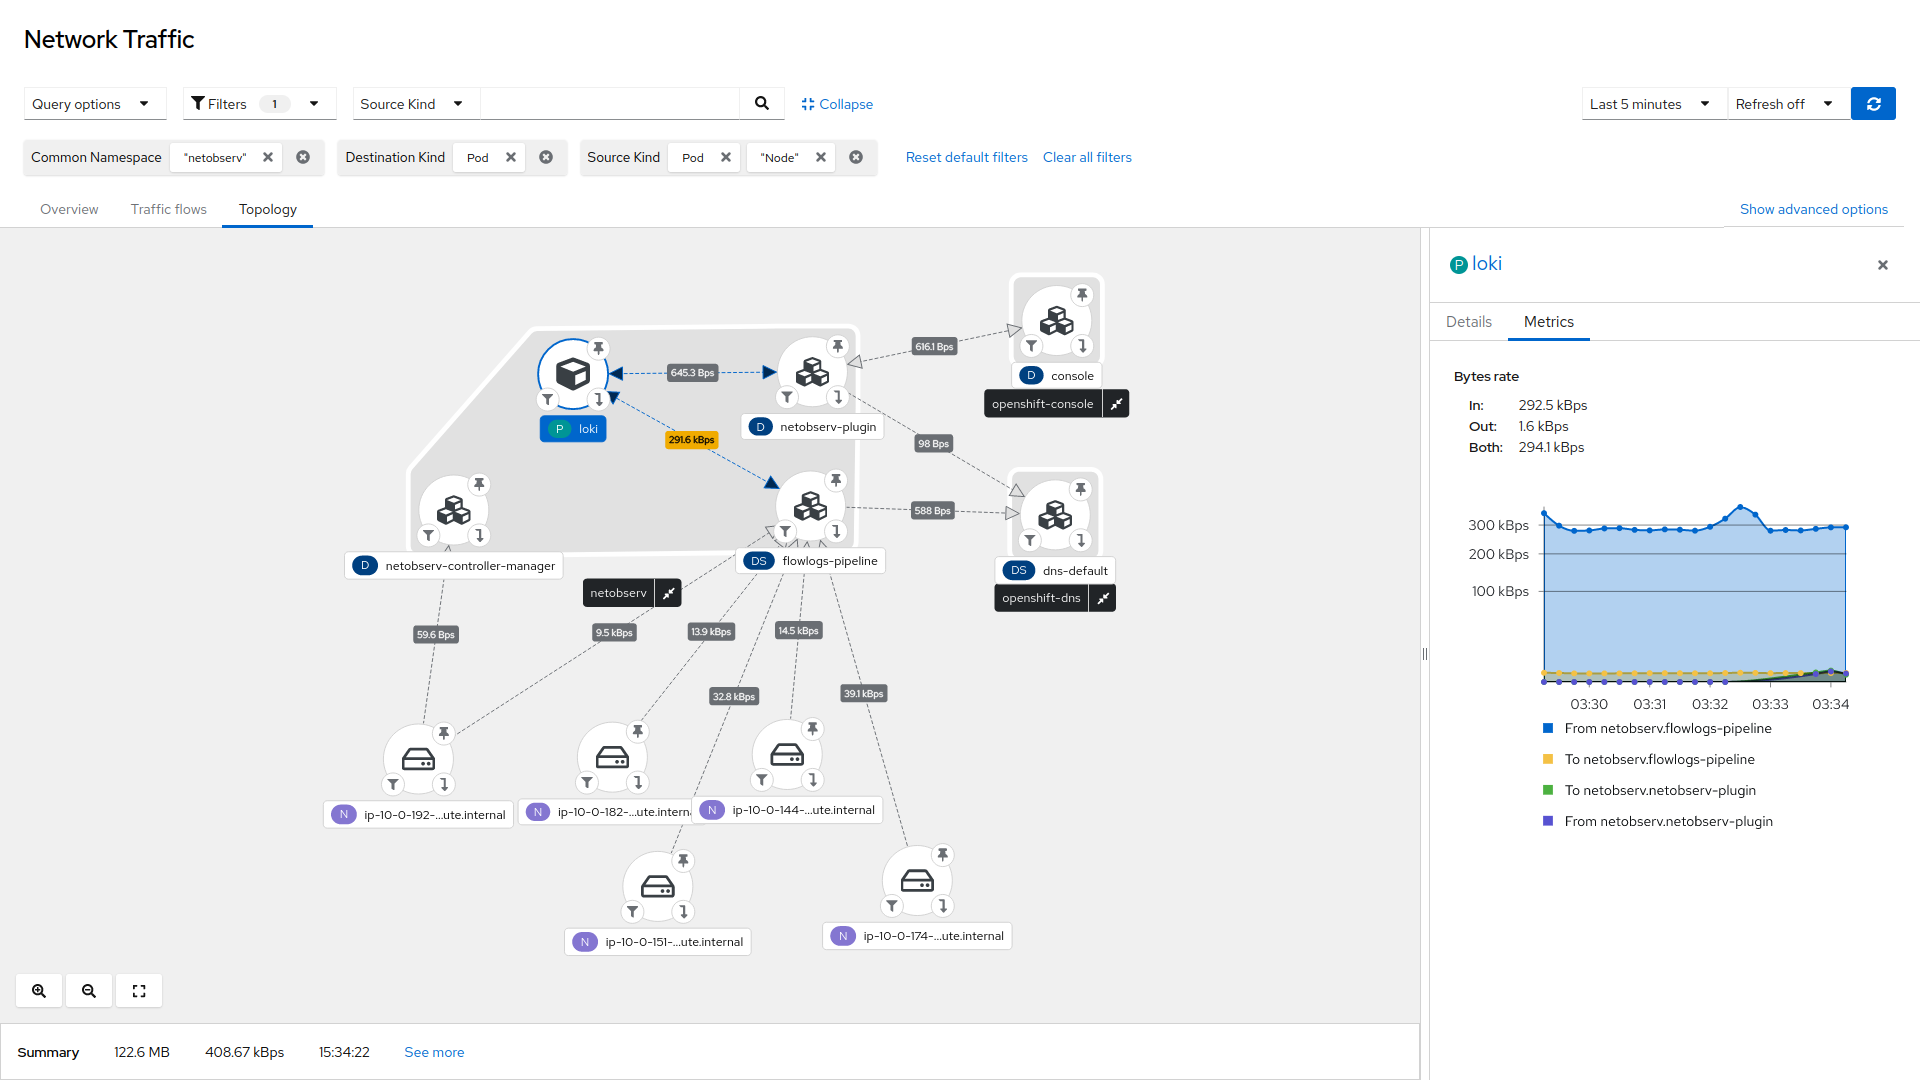 This screenshot shows the NetObserv architecture itself: Nodes (via eBPF agents) sending traffic (flows) to the collector flowlogs-pipeline, which in turn sends data to Loki. The NetObserv console plugin fetches these flows from Loki.
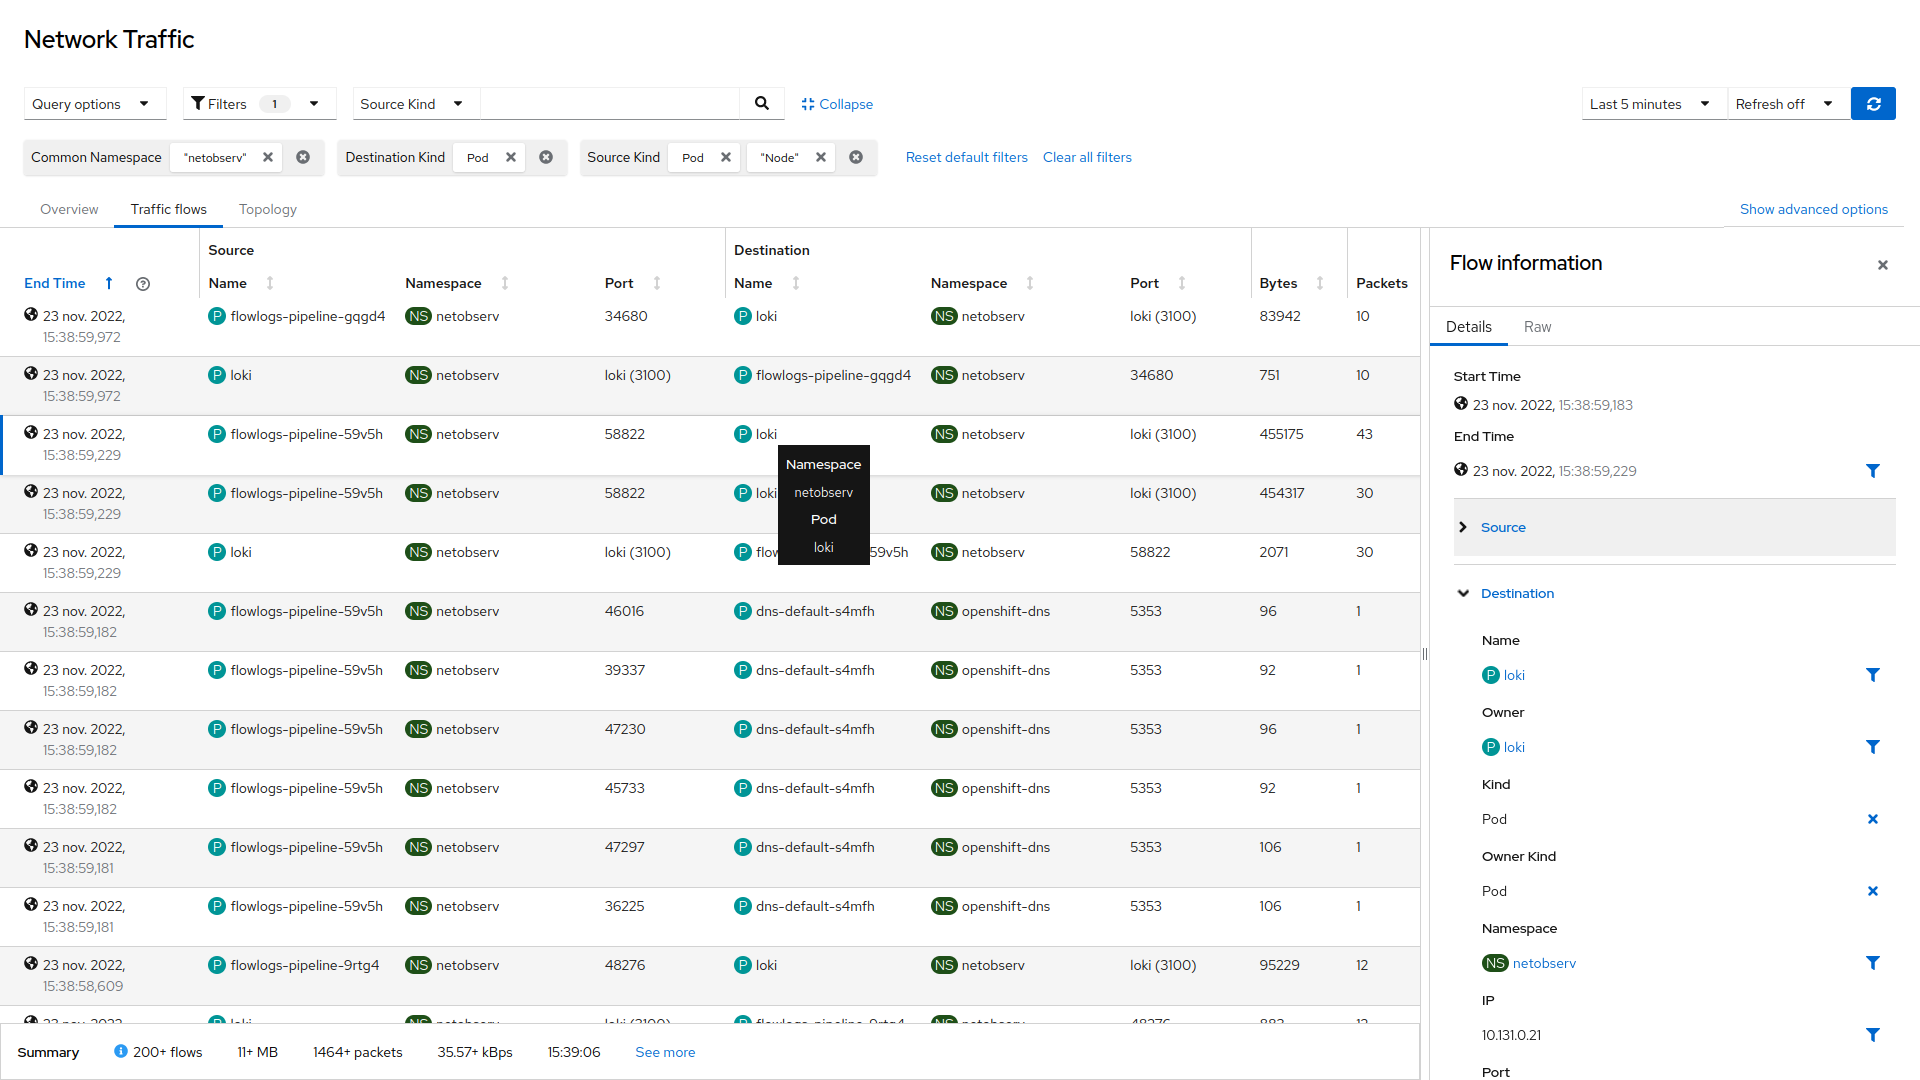
The table view shows raw flows, ie. non aggregated, still with the same filtering options, and configurable columns.
These views are accessible directly from the main menu, and also as contextual tabs for any Pod, Deployment, Service (etc.) in their details page, with filters set to focus on that particular resource.
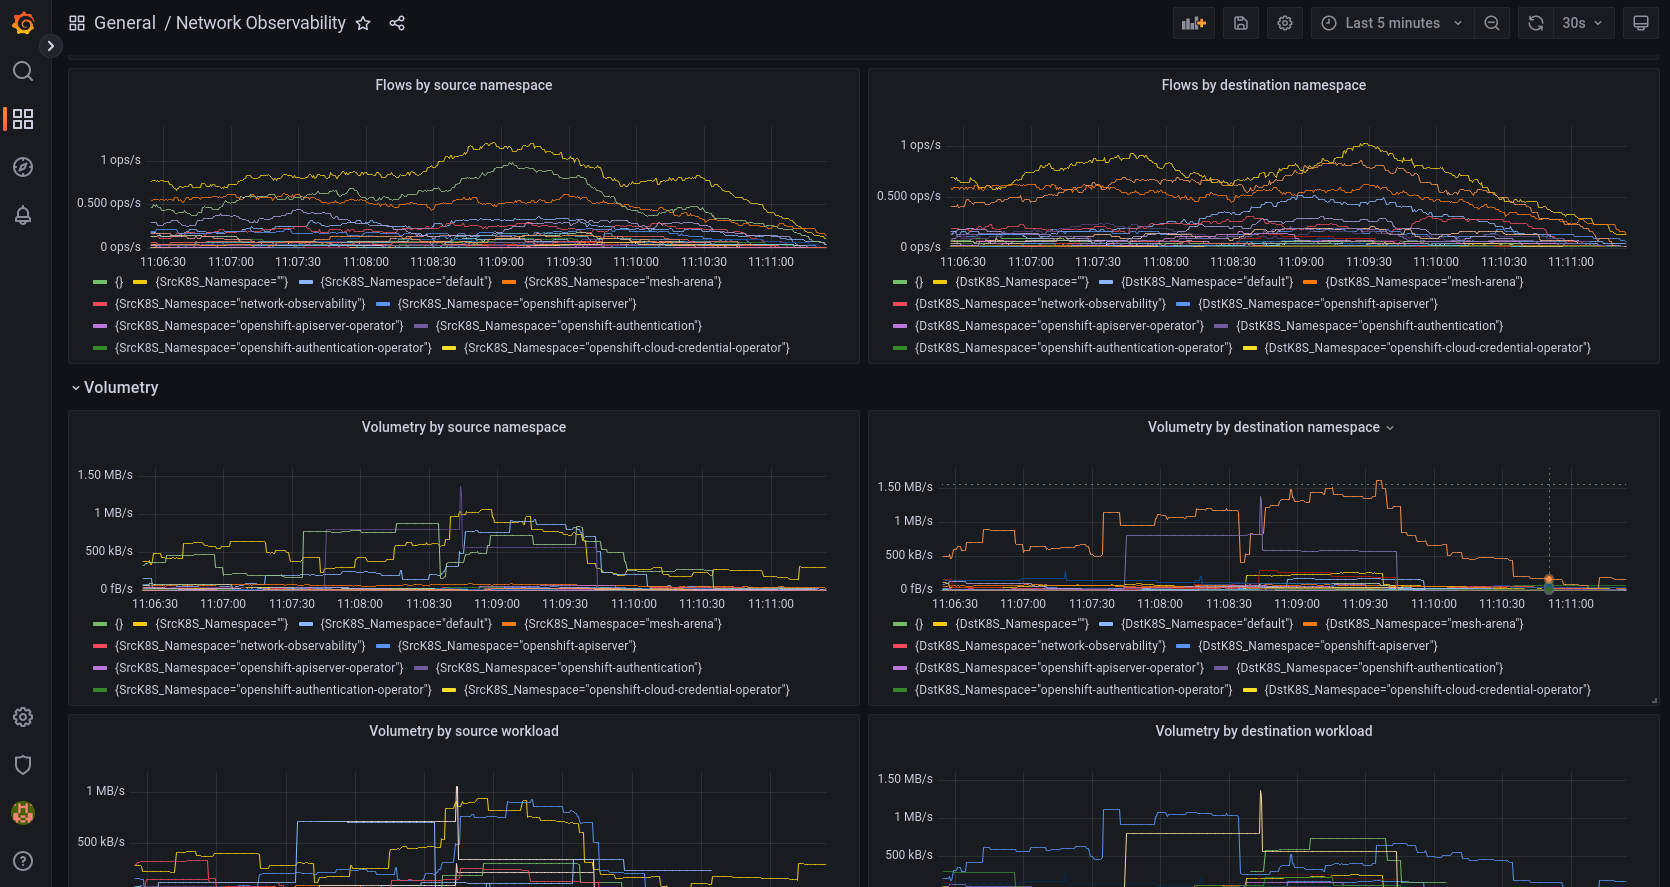
Grafana can be used to retrieve and show the collected flows from Loki. If you used the make commands provided above to install NetObserv from the repository, you should already have Grafana installed and configured with Loki data source. Otherwise, you can install Grafana by following the instructions here, and add a new Loki data source that matches your setup. If you used the provided quick install path for Loki, its access URL is http://loki:3100.
To get dashboards, import this file into Grafana. It includes a table of the flows and some graphs showing the volumetry per source or destination namespaces or workload:
The FlowCollector resource is used to configure the operator and its managed components. A comprehensive documentation is available here, and a full sample file there.
To edit configuration in cluster, run:
kubectl edit flowcollector clusterAs it operates cluster-wide, only a single FlowCollector is allowed, and it has to be named cluster.
A couple of settings deserve special attention:
-
Agent (
spec.agent.type) can beEBPF(default) orIPFIX. eBPF is recommended, as it should work in more situations and offers better performances. If you can't, or don't want to use eBPF, note that the IPFIX option is fully functional only when using OVN-Kubernetes CNI. Other CNIs are not officially supported, but you may still be able to configure them manually if they allow IPFIX exports. -
Sampling (
spec.agent.ebpf.samplingandspec.agent.ipfix.sampling): a value of100means: one flow every 100 is sampled.1means all flows are sampled. The lower it is, the more flows you get, and the more accurate are derived metrics, but the higher amount of resources are consumed. By default, sampling is set to 50 (ie. 1:50) for eBPF and 400 (1:400) for IPFIX. Note that more sampled flows also means more storage needed. We recommend to start with default values and refine empirically, to figure out which setting your cluster can manage. -
Loki (
spec.loki): configure here how to reach Loki. The default URL values match the Loki quick install paths mentioned in the Getting Started section, but you may have to configure differently if you used another installation method. You will find more information in our guides for deploying Loki: with Loki Operator, or our alternative "distributed Loki" guide. -
Quick filters (
spec.consolePlugin.quickFilters): configure preset filters to be displayed in the Console plugin. They offer a way to quickly switch from filters to others, such as showing / hiding pods network, or infrastructure network, or application network, etc. They can be tuned to reflect the different workloads running on your cluster. For a list of available filters, check this page. -
Kafka (
spec.deploymentModel: KAFKAandspec.kafka): when enabled, integrates the flow collection pipeline with Kafka, by splitting ingestion from transformation (kube enrichment, derived metrics, ...). Kafka can provide better scalability, resiliency and high availability. It's also an option to consider when you have a bursty traffic. This page provides some guidance on why to use Kafka. When configured to use Kafka, NetObserv operator assumes it is already deployed and a topic is created. For convenience, we provide a quick deployment using Strimzi: runmake deploy-kafkafrom the repository. -
Exporters (
spec.exporters, experimental) an optional list of exporters to which to send enriched flows. Currently only KAFKA is supported. This allows you to define any custom storage or processing that can read from Kafka. This feature is flagged as experimental as it has not been thoroughly or stress tested yet, so use at your own risk.
In addition to sampling and using Kafka or not, other settings can help you get an optimal setup without compromising on the observability.
Here is what you should pay attention to:
-
Resource requirements and limits (
spec.agent.ebpf.resources,spec.agent.processor.resources): adapt the resource requirements and limits to the load and memory usage you expect on your cluster. The default limits (800MB) should be sufficient for most medium sized clusters. You can read more about reqs and limits here. -
eBPF agent's cache max flows (
spec.agent.ebpf.cacheMaxFlows) and timeout (spec.agent.ebpf.cacheActiveTimeout) control how often flows are reported by the agents. The higher arecacheMaxFlowsandcacheActiveTimeout, the less traffic will be generated by the agents themselves, which also ties with less CPU load. But on the flip side, it leads to a slightly higher memory consumption, and might generate more latency in the flow collection. -
It is possible to reduce the overall observed traffic by restricting or excluding interfaces via
spec.agent.ebpf.interfacesandspec.agent.ebpf.excludeInterfaces. Note that the interface names may vary according to the CNI used. -
The eBPF agent offers more advanced settings via environment variables that you can set through
spec.agent.ebpf.env.
The FlowCollector resource includes configuration of the Loki client, which is used by the processor (flowlogs-pipeline) to connect and send data to Loki for storage. They impact two things: batches and retries.
-
spec.loki.batchWaitandspec.loki.batchSizecontrol the batching mechanism, ie. how often data is flushed out to Loki. Like in the eBPF agent batching, higher values will generate fewer traffic and consume less CPU, however it will increase a bit the memory consumption offlowlogs-pipeline, and may increase a bit collection latency. -
spec.loki.minBackoff,spec.loki.maxBackoffandspec.loki.maxRetriescontrol the retry mechanism. Retries may happen when Loki is unreachable or when it returns errors. Often, it is due to the rate limits configured on Loki server. When such situation occurs, it might not always be the best solution to increase rate limits (on server configuration side) or to increase retries. Increasing rate limits will put more pressure on Loki, so expect more memory and CPU usage, and also more traffic. Increasing retries will put more pressure onflowlogs-pipeline, as it will retain data for longer and accumulate more flows to send. When all the retry attempts fail, flows are simply dropped. Flow drops are counted in the metricnetobserv_loki_dropped_entries_total.
On the Loki server side, configuration differs depending on how Loki was installed, e.g. via Helm chart, Loki Operator, etc. Nevertheless, here are a couple of settings that may impact the flow processing pipeline:
-
Rate limits (cf Loki documentation), especially ingestion rate limit, ingestion burst size, per-stream rate limit and burst size. When these rate limits are reached, Loki returns an error when
flowlogs-pipelinetries to send batches, visible in logs. A good practice is to define an alert, to get notified when these limits are reached: cf this example. It uses a metrics provided by the Loki operator:loki_request_duration_seconds_count. In case you don't use the Loki operator, you can replace it by the same metric provided by NetObserv Loki client, namednetobserv_loki_request_duration_seconds_count. -
Max active streams / max streams per user: this limit is reached when too many streams are created. In Loki terminology, a stream is a given set of labels (keys and values) used for indexing. NetObserv defines labels for source and destination namespaces and pod owners (ie. aggregated workloads, such as Deployments). So the more workloads are running and generating traffic on the cluster, the more chances there are to hit this limit, when it's set. We recommend setting a high limit or turning it off (0 stands for unlimited).
More performance fine-tuning is possible when using Kafka, ie. with spec.deploymentModel set to KAFKA:
-
You can set the size of the batches (in bytes) sent by the eBPF agent to Kafka, with
spec.agent.ebpf.kafkaBatchSize. It has a similar impact thancacheMaxFlowsmentioned above, with higher values generating less traffic and less CPU usage, but more memory consumption and more latency. It is recommended to keep these two settings somewhat aligned (ie. do not set a super lowcacheMaxFlowswith highkafkaBatchSize, or the other way around). We expect the default values to be a good fit for most environments. -
If you find that the Kafka consumer might be a bottleneck, you can increase the number of replicas with
spec.processor.kafkaConsumerReplicas, or set up an horizontal autoscaler withspec.processor.kafkaConsumerAutoscaler. -
Other advanced settings for Kafka include
spec.processor.kafkaConsumerQueueCapacity, that defines the capacity of the internal message queue used in the Kafka consumer client, andspec.processor.kafkaConsumerBatchSize, which indicates to the broker the maximum batch size, in bytes, that the consumer will read.
NetObserv is currently meant to be used by cluster / network admins. There is not yet multi-tenancy implemented, which means a user having access to the data will be able to see all the data. It is up to the cluster admins to restrict the access to the NetObserv and Loki namespaces and services according to their security policy.
By default, communications between internal components are not secured. It is possible to set up TLS for several communications:
- Between processor (
flowlogs-pipeline) and Loki, by settingspec.loki.tls. - With Kafka (both on producer and consumer sides), by setting
spec.kafka.tls. Mutual TLS is supported here. - The metrics server running in the processor (
flowlogs-pipeline) can listen using TLS, viaspec.processor.metrics.server.tls. - The Console plugin server always uses TLS.
To make authenticated queries to Loki, when using the Loki Operator, there are two options:
- per-user auth: set
spec.loki.authTokentoFORWARDin theFlowCollectorresource. The console plugin will forward the logged-in Console user token to Loki. To get access to the flow logs, users must have the following permission:
- apiGroups:
  - 'loki.grafana.com'
  resources:
  - network
  resourceNames:
  - logs
  verbs:
- 'get'- per-app auth, ie. with NetObserv components having access to the logs using their own service account, regardless of the user permissions. For this mode, set
spec.loki.authTokentoHOSTand setupClusterRoleforflowlogs-pipelineandnetobserv-plugin, e.g: role.yaml.
Please refer to this documentation for everything related to building, deploying or bundling from sources.
Please refer to F.A.Q / Troubleshooting main document.
This project is licensed under Apache 2.0 and accepts contributions via GitHub pull requests. Other related netobserv projects follow the same rules:
External contributions are welcome and can take various forms:
- Providing feedback, by starting discussions or opening issues.
- Code / doc contributions. You will find here some help on how to build, run and test your code changes. Don't hesitate to ask for help.

