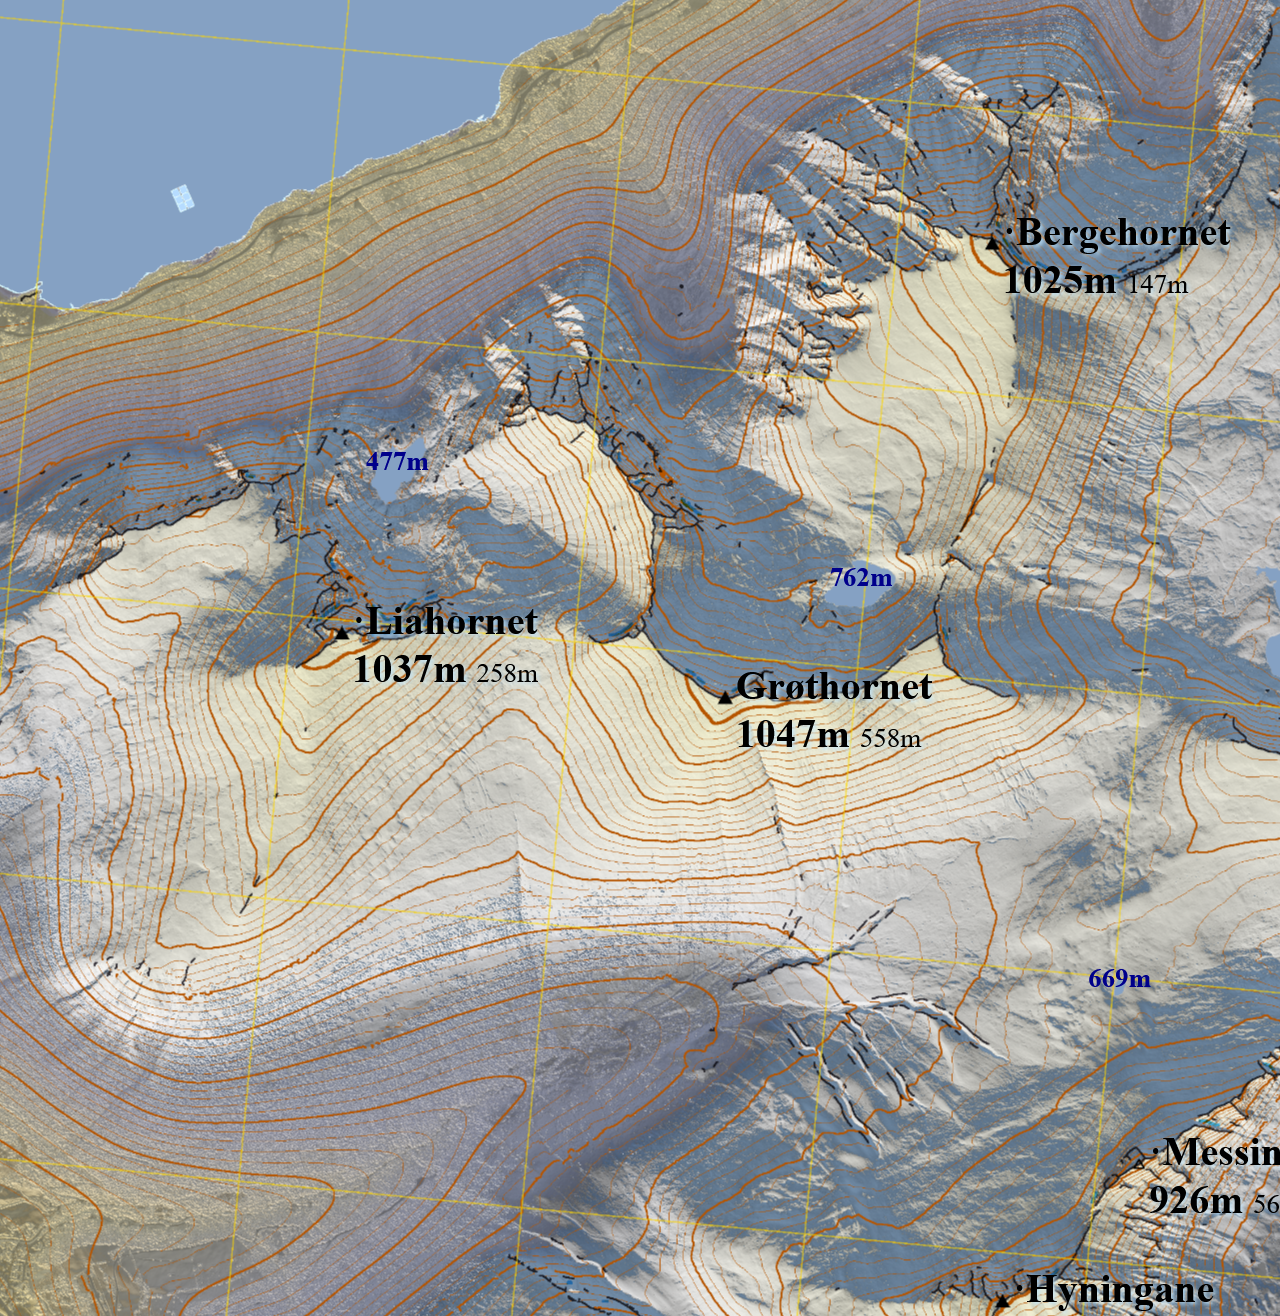
Make topographic relief bitmaps for printing from 32-bit elevation data, overlain with vector graphics
Make printable topographic relief maps. The foreground is vector graphics from RouteMap.jl, and the background is topographic relief maps based on elevation data. The hypsometric colours resemble a clear, early afternoon in mid-February at 62°N, with snow cover above 500 m.
This example from an earlier version uses laser elevations with a 3 metre spacing. Publicly available data covers all of Norway with a spacing of 1 metre or less, so we could potentially zoom in to the street level. Both surface (with trees and houses) and terrain (cleaned of such) are available.
The example includes default elevation contours every 100 m with a fatter curve at 1000 m. The grid is UTM33N 1 km grid.
Rendering the finished bitmaps is not expected to run in one step. As a minimum:
- Step 1:
run_bitmapmap_pipeline()=> A folder hierarchy is established.
If needed, the pipeline establishes an .ini file with default argument values. User updates arguments in the file (recommended) or by passing keywords to the pipeline.
- Step 2: User moves relevant elevation data into user's project folder. It may cover a larger area. This may help:
copy_relevant_tifs_to_folder(source_folder, destination_folder). - Step 3:
run_bitmapmap_pipeline()=> User inspects rendered images.
If an intermediate image file is deleted, the corresponding step is triggered to rerun.
If the keyword complete_sheets_first = true, which is the default, all steps are completed before the next sheet starts processing. Steps in the pipeline are:
- Define a
SheetMatrixBuilderbased onhome/BitmapMaps.ini. Keywords overrule file values. Repl feedback for a preview of the bitmap's geographical extent and division into sheets (define_builder). - Establish folder hierarchy for storing intermediate data (
establish_folder). - User action if missing:
- Make requests for public data at høydedata.no (requires email). Download to each sheet's folder.
- Or, if data exists locally:
copy_relevant_tifs_to_folder
- Unzip elevation data (
unzip_tif). - Consolidate elevation data (
consolidate_elevation_data). - Identify water surfaces (
water_overlay). - Make topographic reliefs (
topo_relief) from a hardcoded hypsometric colour palette. - Make elevation contours (
contour_lines_overlay). - Add UTM grid (
grid_overlay). - Mark dieders and ridges (
ridge_overlay). - Make vector graphics and text covering the full map area.
- Find the prominence of summits and draw markers (
summit_markers). Also writes an .csv file for later matching with geographical names. - Composite bitmap and vector graphics (
join_layers).
using BitmapMaps
smb = run_bitmapmap_pipeline(;complete_sheets_first) # This makes a default .ini and establishes all folders
copy_relevant_tifs_to_folder("yourpath", smb)
run_bitmapmap_pipeline()
Step 11 is currently missing. The ancestor packages used LuxorLayout for this, but the svg's from that solution are in practice uneditable. Linking bitmaps from 'self-produced' svgs may be a better option overall, especially considering that allows stylesheets and interaction.
Summit identification by name is first implemented in v0.0.40. Names are fetched via 'Stadnamn.jl' and added as a column to 'summits.csv'. A future modfication would include overriding with user defined names in the .ini file, as a dictionary of "utm location" => "users own name".
Summit prominences are calculated taking boundary conditions between sheets into account. Since all boundary conditions are not available until the neighbouring sheets are calculated, this introduces iteration. Hence some summits will be appointed a lower prominence after re-running the pipeline.
☛ Look for [ Info: No changes to determine if more iteration is needed to find exact prominence values for summits.
Tall power lines are sometimes marked as obscure summits. Version v0.0.40 introduces a configurable filter, 'Markers / Mininum stress level' for filtering out unwanted summits. Stress is also reported in 'Summits.csv'. If some actual summits are missing, try to set the minimum stress level to 0 and iterate.
GeoArrays.jl has breaking changes in version 0.9 (we currently pin to 0.8.5). Cairo / Pango has long-standing font issues on Windows, we currently pin the version. We could use Inkscape, but it seems to be affected as well.
Some nice to know:
- Metadata for printing is made and stored in .png files. Settings are respected by e.g.
Gimp,MS Paint, andIrFanview. - Water surfaces often require manual touch-up. Try doing sea-level touch up in 'Consolidated.tif'. High elevations can also be
shown (reduced to 256 intensities in Gimp) by adding a temporary 'multiplication layer' in
Gimp. - The pipeline can reuse
SheetMatrixBuilderand modify it by steps, using keywords. - The UTM grid is the correct one for the local utm zone, even though data is from a country-wide zone.
- Sheet numbering starts in the SW corner. See figure:
- Side-by-side overview of all sheets
- Editable text file for peaks? Add peak labels in .svg?
- Change the colour for contour lines.
- Add increasing warm tint to snow on higher elevations.
Bounding boxes have meaning for:
- GeoArrays (this type is defined by
GeoArrays.jl) - file names referring GeoArrays
- SheetMatrixBuilders (this package's main type)
- SheetBuilders (this package's main type)
If you're inspecting your own job definitions, you may only need show_augmented(smb).
show_derived_properties shows the interesting properties for file names and other types.
You may find polygon_string or bbox_external_string more useful for optimizing placement.
Why not just use GeoArrays.bbox and GeoArrays.bbox_overlap?
- Two adjacent map sheets shares a boundary (x_max1 == x_min2), but do not overlap. In
GeoArrays.bbox_overlap, two such boxes do overlap, because x_max1 refers a cell and not it's right edge. - In this package, UTM coordinates are integers (because that resolution is liberally licensed for all of Norway, and because we use folder names corresponding to external boundary boxes). GeoArrays.jl uses floating point numbers.
- A sheet in a map book is naturally defined by its boundary. Such a boundary does not change with cell resolution or data density.
- Downloaded elevation files may be zero-padded. We are mostly interested in the non-zero geographical region.
- Rasters aren't simply matrices. Word definitions and conventions come from various professions.
- When working with online map tools, we like to paste Well-Known-Text polygons.
