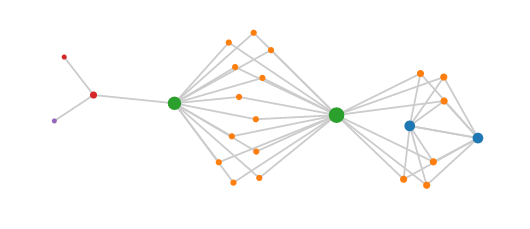
SIMulate Interactive Actor Network VIsualiZation - simianviz - also visualize the simian army in action. Follow @simianviz on twitter to get update notifications.
Originally called Simulate Protocol Interactions in Go - spigo - the name spigo is taken, however simianviz wasn't, so domains have been registered etc. and the name will transition over the coming months.
Launch the dependency graph visualization in your browser
For a local installation of the UI, with no network dependencies, you can start the service using:
$ cd ui
$ npm install
$ npm run dev
Access the service by visiting localhost:8000
$ ./spigo -h
Usage of ./spigo:
  -a string
    	Architecture to create or read, fsm, migration, or read from json_arch/<arch>_arch.json (default "netflixoss")
  -c	Collect to json_metrics csv_metricsand via http: extvars
  -cpuprofile string
    	Write cpu profile to file
  -cpus int
    	Number of CPUs for Go runtime (default 4)
  -d int
    	Simulation duration in seconds (default 10)
  -f	Filter output names to simplify graph by collapsing instances to services
  -g	Enable GraphML logging of nodes and edges to gml/<arch>.graphml
  -j	Enable GraphJSON logging of nodes and edges to json/<arch>.json
  -kv string
    	Configuration key:value - chat:10ms sets default message insert rate
  -m	Enable console logging of every message
  -p int
    	Pirate population for fsm or scale factor % for other architectures (default 100)
  -r	Reload graph from json/<arch>.json to setup architecture
  -s int
    	Sequence number to create multiple runs for ui to step through in json/<arch><s>.json
  -u string
    	Polling interval for Eureka name service, increase for large populations (default "1s")
  -w int
    	Wide area regions to replicate architecture into, defaults based on 6 AWS region names (default 1)
There were too many top level packages so a more hierachical directory structure was setup.
Directory structure
- spigo        # binary built for MacOS
- spigo.go     # main program
- actors       # go code for packaged behaviors
- tooling      # go support code
- ui           # visualization code using d3 and js
- misc         # scripts to run all tests and regenerate output
- json_arch    # architecture definition files
- json         # json dependency graph output
- json_metrics # flow, metrics and guesstimate output
- csv_metrics  # histograms saved as tables
- png          # images for readme
- archived     # old files and packages
- gml          # old graphml dependency graphs
The format of architecture definition files is described in json_arch/README
Docker compose (v1 and default to version2) yaml files can be converted to architecture json by extracting the dependency tree. Some editing to set the right relative counts and actor packages will be needed.
$ cd compose2arch; go install

$ compose2arch -file myarch.yaml > json_arch/myarch.json
See this paper for some Occam code and results for the original version of this idea circa 2007.
The public launch was during a short keynote presentation at the March 2015 O'Reilly Software Architecture Conference: Monitoring Microservices - A Challenge - Video of the 10 minute talk
Most of the microservices presentations on Adrian's slideshare account discuss the current state of work.
The basic framework is in place, but more interesting behaviors, automonous running, and user input to control or stop the simulation haven't been added yet.
Next steps include connecting the output directly to the browser over a websocket so the dynamic behavior of the graph can be seen in real time. A lot of refactoring has cleaned up the code and structure in preparation for more interesting features.
Jason Brown's list of interesting Gossip papers might contain something interesting to try and implement...
