Tool for extracting HySDS metrics from ElasticSearch/OpenSearch out as aggregrates for reporting and cost-production modeling.
Tools for extracting metrics out of captured runtime performance of jobs from HySDS metrics in Elasticsearch/OpenSearch. These reports can be used by ops and can also be used as input to other cost-production models for anlaysis.
Metrics extractions are important to get actuals from production, which can then be used as input for modeling estimations based on actuals.
- Extracts actual runtime metrics from a HySDS venue.
- Extracts all metrics enumerations of each job type and its set of compute instance types.
- Leverages ES' built-in aggregrations API to compute statistics on the ES server side.
- Exports to CSV the job metric agreggration by version and instance type
- Exports to CSV the job metric name total counts that merges versions and instance types
This guide provides a quick way to get started with our project.
- Python 3.8+
- Access to ES endpoint containing the "logstash-*" indices of a HySDS Metrics service.
- Has been tested on ElasticSearch v7.10.X and OpenSearch v2.9.X
$ git clone https://github.com/hysds/metrics_extractor/
The main tool is:
metrics_extractor/metrics_extractor/hysds_metrics_es_extractor.py
The hysds_metrics_es_extractor.py tool requires a HySDS Metrics ES url endpoint, and a temporal range to query against.
The ES URL endpoint:
- --es_url=my_es_url , where the url is the ES search endpoint for logstash-* indices.
The es_url typically has the form:
https://my_venue/__mozart_es__/logstash-*/_search
https://my_venue/__metrics_es__/logstash-*/_search
The temporal range can be provided in one of two ways:
- --days_back=NN , where NN is the number of days back to search starting from "now".
- --time_start=20240101T000000Z --time_end=20240313T000000Z , where the timestamps extents are in UTC format with the trailing "Z".
Verbosity options:
- --verbose
- --debug
Quick start examples:
$ hysds_metrics_es_extractor.py --verbose --es_url="https://my_pcm_venue/mozart_es/logstash-*/_search" --days_back=21
$ hysds_metrics_es_extractor.py --debug --es_url="https://my_pcm_venue/metrics_es/logstash-*/_search"  --time_start=20240101T000000Z --time_end=20240313T000000Z
hysds_metrics_es_extractor.py will produce two output csv report of job metrics.
Example CSV output of that aggregrates all job enumerations for each job_type-to-instance_type pairings:
The file name is composed of the following tokens:
"job_aggregrates_by_version_instance_type {hostname} {start}-{end} spanning {duration_days} days.csv".
The results of querying ES for logstash aggregrates will be exported out for the following fields:
- job_type: the algorhtm container and version
- job runtime (minutes avg): the mean total runtime of the stage-in, container runs, and stage-out
- container runtime (minutes avg): the mean runtime of the container runs of the job. there can be multiple containers so this is the average of the set.
- stage-in size (GB avg): the mean size of data localized from storage (e.g. AWS S3) into the compute node Verdi worker.
- stage-out size (GB avg): the mean size of data publish from compute node Verdi worker out to storage (e.g. AWS S3).
- instance type: the compute node (e.g. AWS EC2) type used for running the job
- stage-in rate (MB/s avg): the mean transfer rate of data localized into the worker.
- stage-out rate (MB/s avg): the mean transfer rate of data pubished out of the worker.
- daily count avg: the mean count of successful jobs sampled over the given duration.
- count over duration: the total count of successful jobs sampled over the given duration.
- duration days: the sampled duration to query ES of job metrics.
Note that the aggregates are constrained to only samples with successful jobs (exit code 0) and ignores failed jobs so as to not skew the timing results.
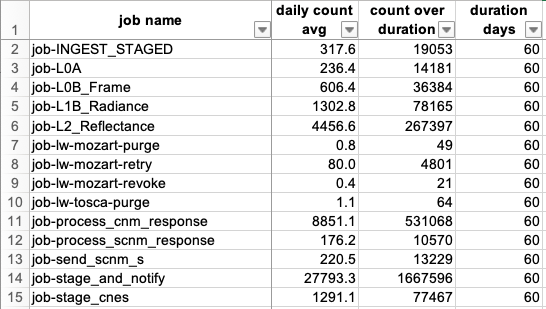
Example CSV output of job_counts_by_name that collapses each job name aggregrate's enumerations across all of its verisons and instance types:
The file name is composed of the following tokens:
"job_counts_by_name {hostname} {start}-{end} spanning {duration_days} days.csv".
The results of querying ES for logstash aggregrates will be exported out for the following fields:
- job_name: the algorhtm name (without version)
- daily count avg: the mean count of successful jobs sampled over the given duration.
- count over duration: the total count of successful jobs sampled over the given duration.
- duration days: the sampled duration to query ES of job metrics.
Note that the aggregates are constrained to only samples with successful jobs (exit code 0) and ignores failed jobs so as to not skew the timing results.
See our CHANGELOG.md for a history of our changes.
See our: LICENSE

