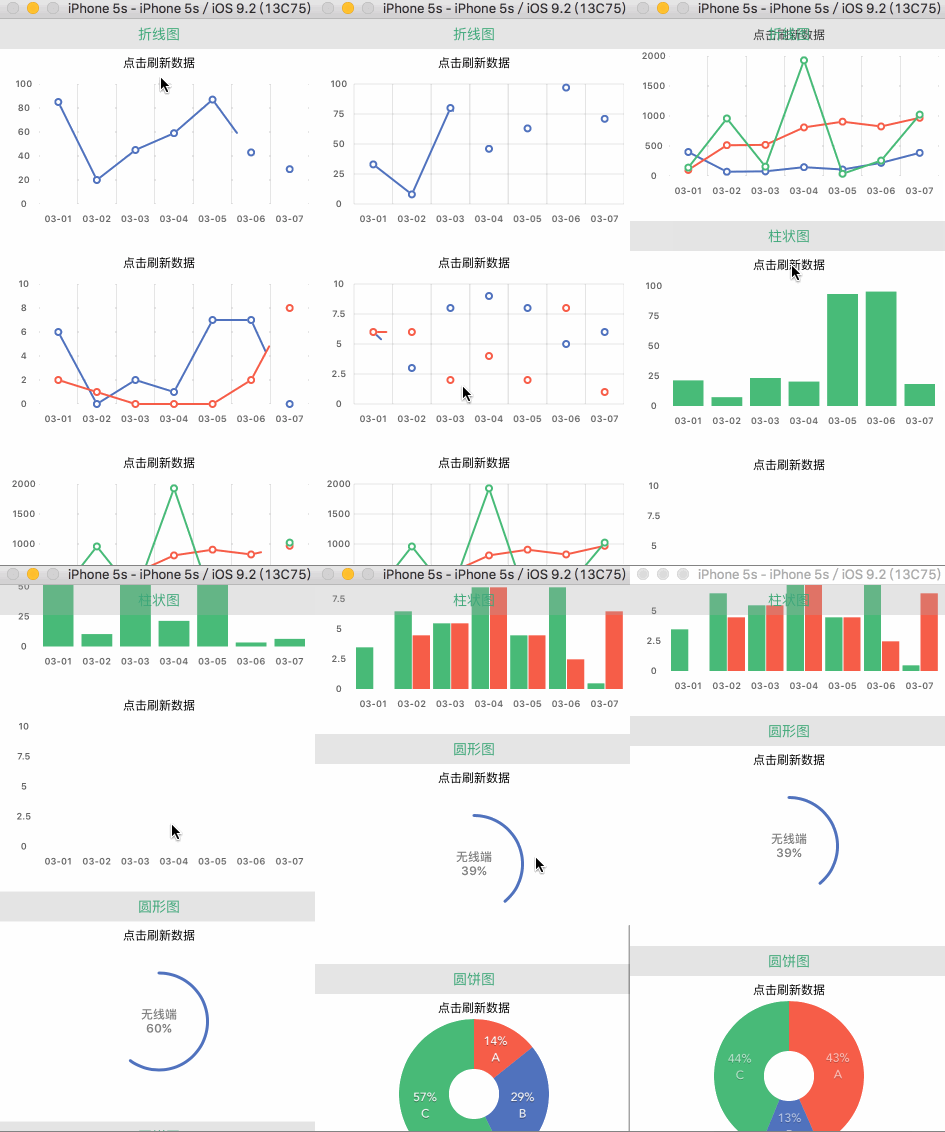
####导入主头文件 #import "SCChart.h"
1.实例化 ( SCChartLineStyle | SCChartBarStyle )
SCChart *chartView = [[SCChart alloc] initwithSCChartDataFrame:CGRectMake(10, 10, [UIScreen mainScreen].bounds.size.width - 20, 150) withSource:self withStyle:SCChartLineStyle];
2.设置横坐标标题
- (NSArray *)SCChart_xLableArray:(SCChart *)chart {
    return 横坐标数组;
}
3.设置数值(多重数组, 纵坐标标题动态计算)
- (NSArray *)SCChart_yValueArray:(SCChart *)chart {
    return @[数组1,数组2];
}
4.设置折现颜色
- (NSArray *)SCChart_ColorArray:(SCChart *)chart {
    return @[SCBlue,SCRed,SCGreen];
}
5.是否显示间隔线条(折线图专用)
- (BOOL)SCChart:(SCChart *)chart ShowHorizonLineAtIndex:(NSInteger)index {
    return YES;
}
1.实例化
SCCircleChart *chartView = [[SCCircleChart alloc] initWithFrame:CGRectMake(0, (self.frame.size.height-100)/2, SCREEN_WIDTH, 100.0) total:@100 current:@60 clockwise:YES];
2.设置圆环颜色
[chartView setStrokeColor:SCBlue];
3.画线
[chartView strokeChart];
1.设置数值并实例化
NSArray *items = @[[SCPieChartDataItem dataItemWithValue:10 color:SCRed description:@"A"],
                   [SCPieChartDataItem dataItemWithValue:20 color:SCBlue description:@"B"],
                   [SCPieChartDataItem dataItemWithValue:40 color:SCGreen description:@"C"],
                   ];

SCPieChart *chartView = [[SCPieChart alloc] initWithFrame:CGRectMake((SCREEN_WIDTH-150)/2, (self.frame.size.height-150)/2, 150.0, 150.0) items:items];
2.设置描述文字
chartView.descriptionTextColor = [UIColor whiteColor];
chartView.descriptionTextFont  = [UIFont fontWithName:@"Avenir-Medium" size:12.0];
3.画线
[chartView strokeChart];
