- Summary
- Usage
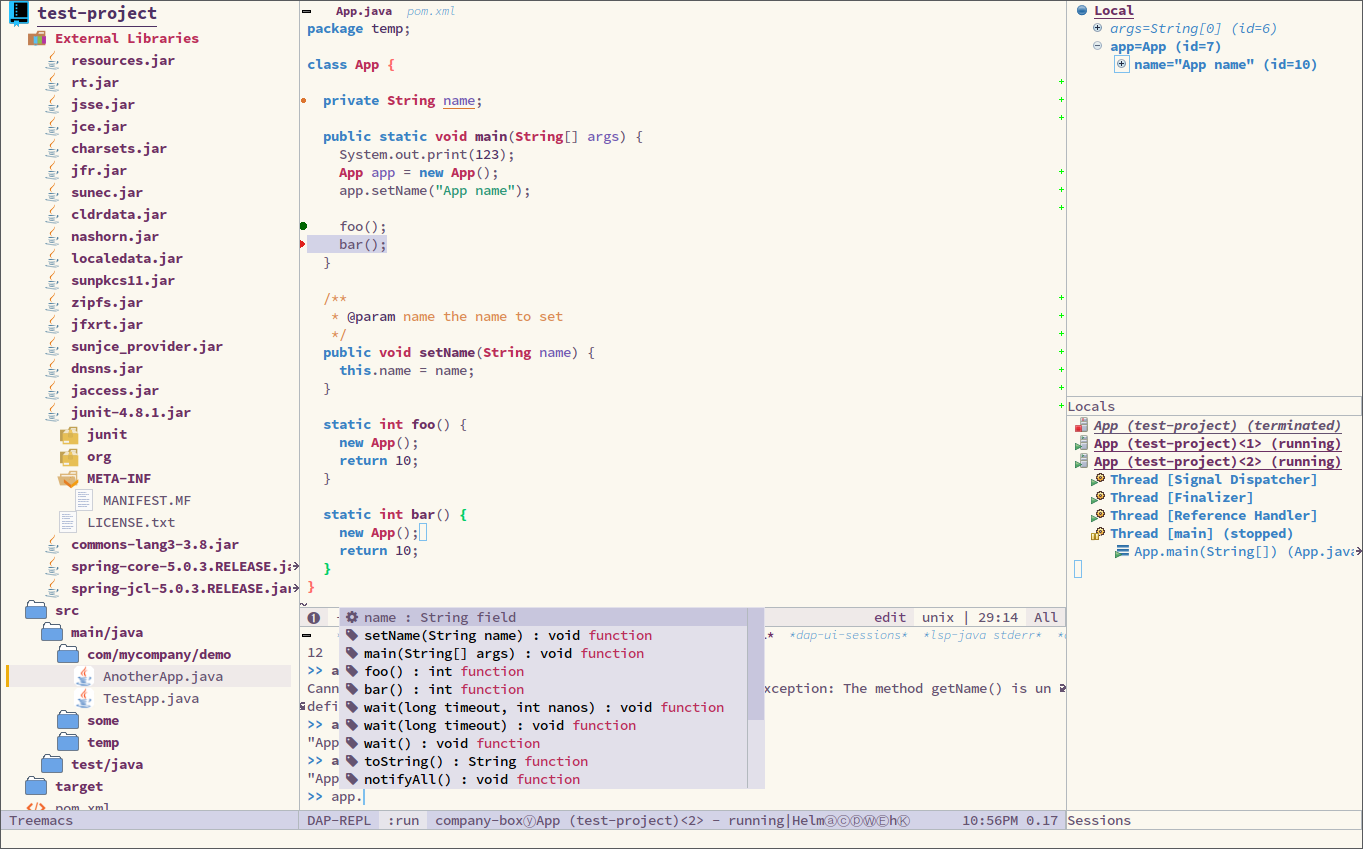
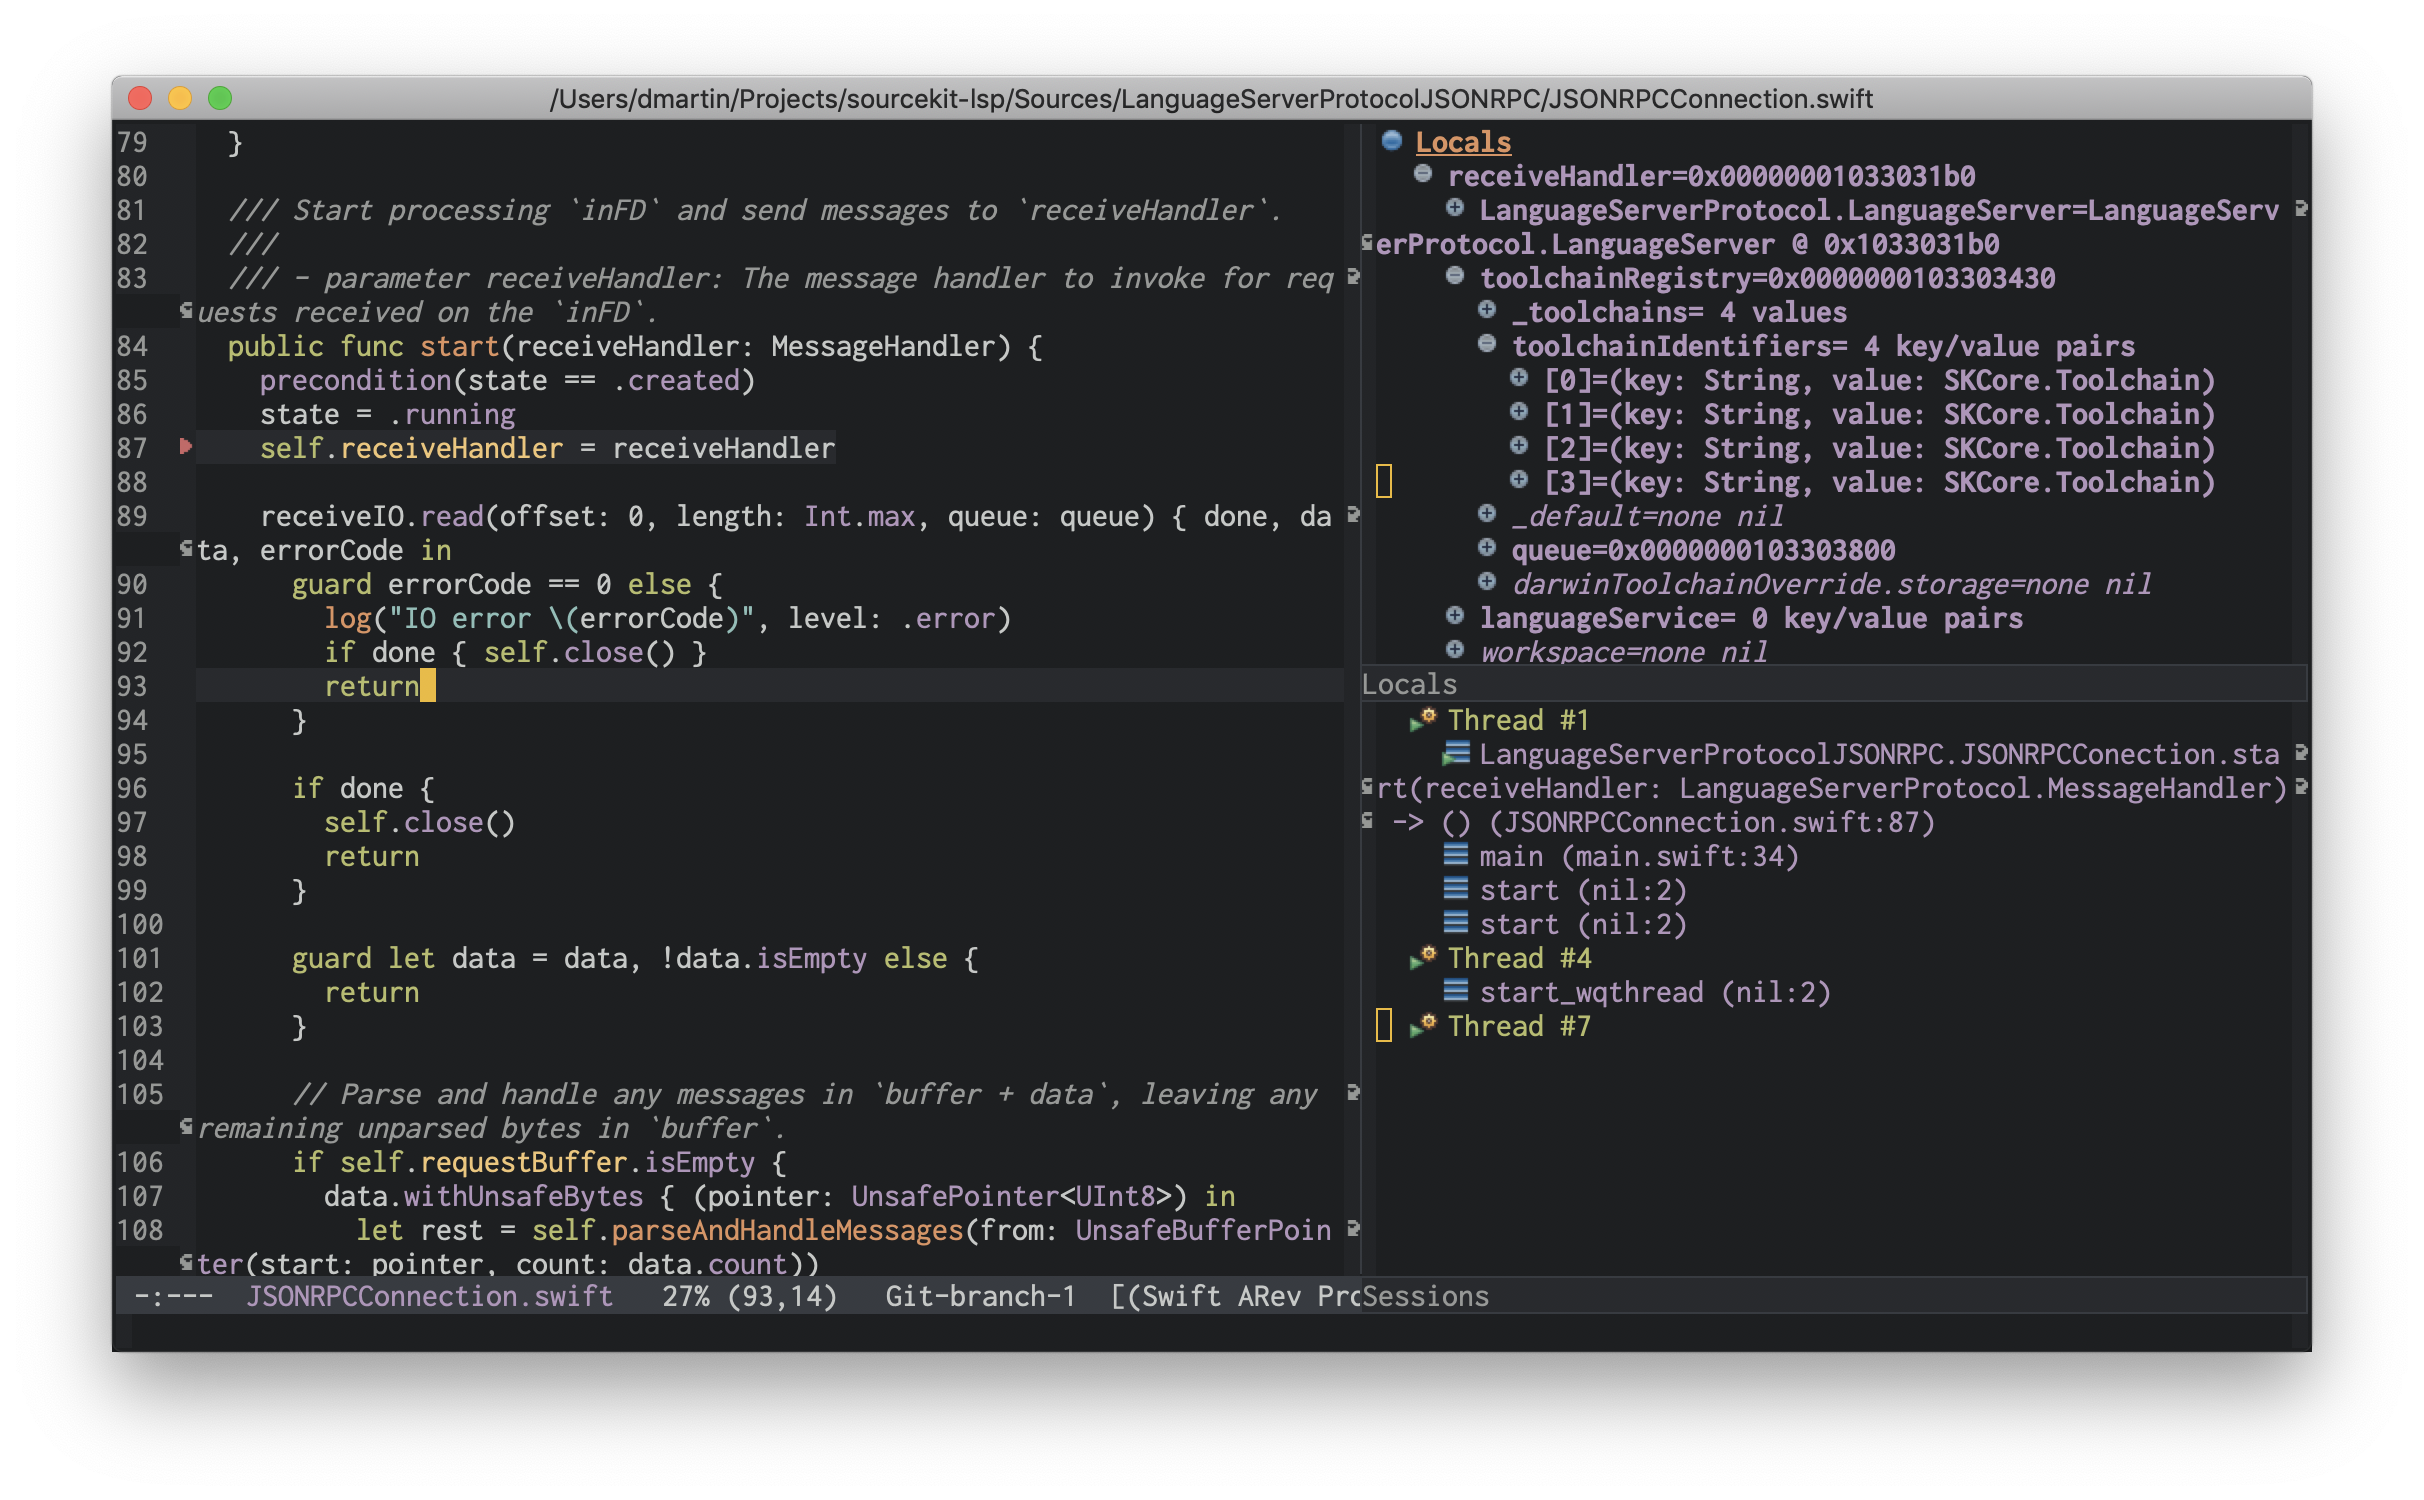
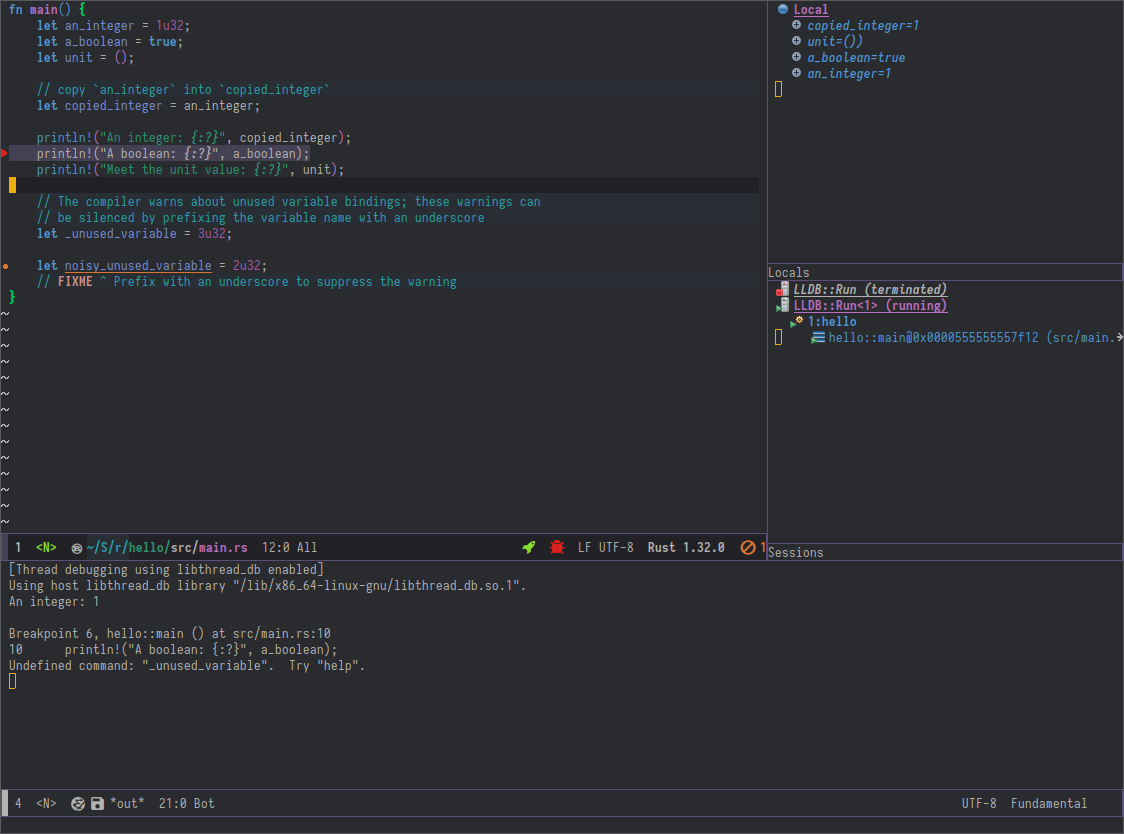
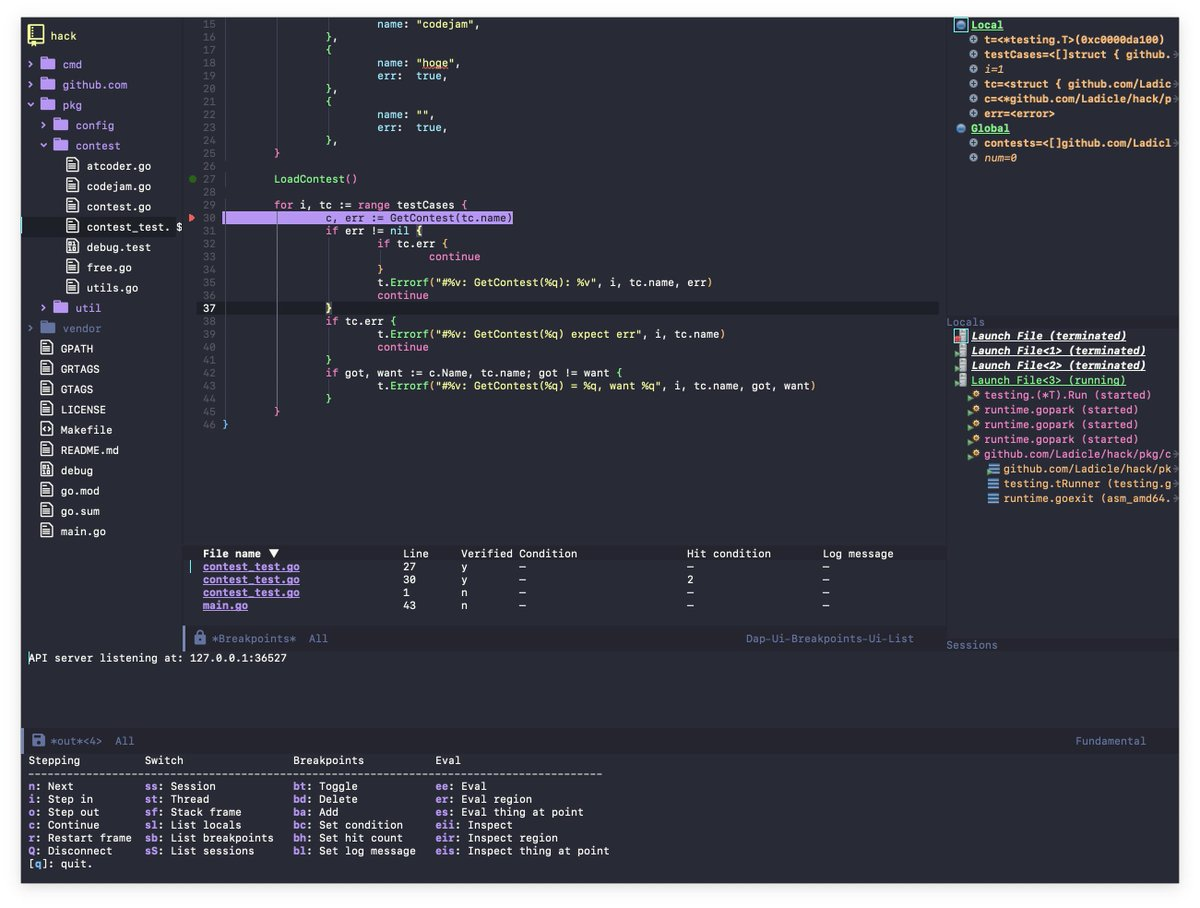
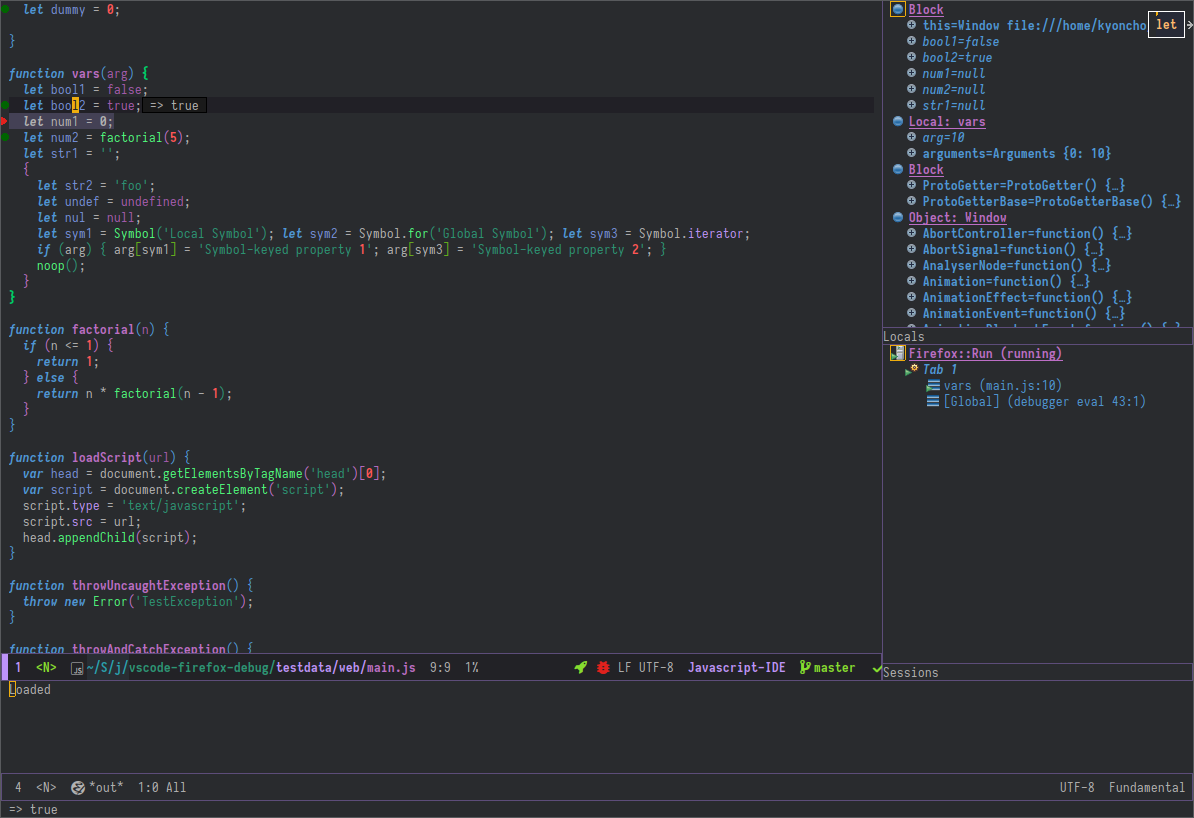
- Screenshot
- Features
- Configuration
- Extending DAP with new Debug servers
- Links
- Troubleshooting
- Acknowledgments
- What’s next
Emacs client/library for Debug Adapter Protocol is a wire protocol for communication between client and Debug Server. It’s similar to the LSP but provides integration with debug server.
Note: dap-mode works only against lsp.el interface.
The project is in it’s early stage but although it is not extensively tested it is considered stable enough to be used. The API considered unstable until 1.0 release is out. It is tested against Java, Python, Ruby, Elixir and LLDB (C/C++/Objective-C/Swift).
The main entry points are dap-debug and dap-debug-edit-template. The first
one asks for a registered debug template and starts the configuration using
the default values for that particular configuration. The later creates a
debug template which could be customized before running.
- Launch/Attach
- Breakpoints
- Exceptions
- Pause & Continue
- Step In/Out/Over
- Callstacks
- Threads
- Multiple simultaneous debug sessions
- Evaluating statements
- Debug/Run configurations
| Command | Description |
|---|---|
dap-breakpoint-toggle | Toggle breakpoint at line |
dap-breakpoint-delete | Delete breakpoint at line |
dap-breakpoint-add | Add java breakpoint at line |
dap-breakpoint-condition | Set/unset breakpoint condition |
dap-breakpoint-hit-condition | Set/unset breakpoint hit condition |
dap-breakpoint-log-message | Set/unset breakpoint log message |
dap-eval | Eval string |
dap-eval-region | Eval region string |
dap-eval-thing-at-point | Eval symbol at point |
dap-step-in | Debug step in |
dap-next | Debug next |
dap-step-out | Debug step out |
dap-stop-thread | Stop thread |
dap-restart-frame | Restart frame |
dap-continue | Debug continue |
dap-disconnect | Cancel current debug session |
dap-switch-stack-frame | Switch active stack frame |
dap-switch-thread | Switch active thread |
dap-switch-session | Switch active session |
dap-debug-edit-template | Generate run command |
dap-debug | Create and run new configuration using the available templates |
dap-debug-last | Debug previous configuration |
dap-debug-recent | Select configuration to run from the previously started command |
dap-go-to-output-buffer | Go output buffer |
| Command | Description |
|---|---|
dap-ui-sessions | Show active/terminated sessions view |
dap-ui-locals | Show locals view |
dap-ui-breakpoints | Show breakpoints view |
dap-ui-inspect | Inspect |
dap-ui-repl | DAP UI REPL |
dap-ui-inspect-region | Inspect region |
dap-ui-inspect-thing-at-point | Inspect symbol at point |
The sessions view is showed after invoking dap-ui-sessions . It represents
the list of the active sessions.
| Command | Description | Keybindings |
|---|---|---|
dap-ui-session-select | Select object at point | <return> |
dap-ui-session-remove WIP | Remove terminated session from the list of running sessions | |
tree-mode-toggle-expand | Toggle node expand state | <tab> |
Locals can be viewed after invoking dap-ui-locals.
Breakpoints can be viewed after invoking dap-ui-breakpoints.
| Command | Description | Keybindings |
|---|---|---|
dap-ui-breakpoints-goto | Go to breakpoint under cursor | <return> |
dap-ui-breakpoints-delete | Delete breakpoint under cursor | d |
dap-ui-breakpoints-delete-selected | Delete selected breakpoints | D |
bui-list-mark | Mark breakpoint under point | m |
bui-list-unmark | Unmark breakpoint under point | u |
bui-list-unmark-all | Unmark breakpoint under point | U |
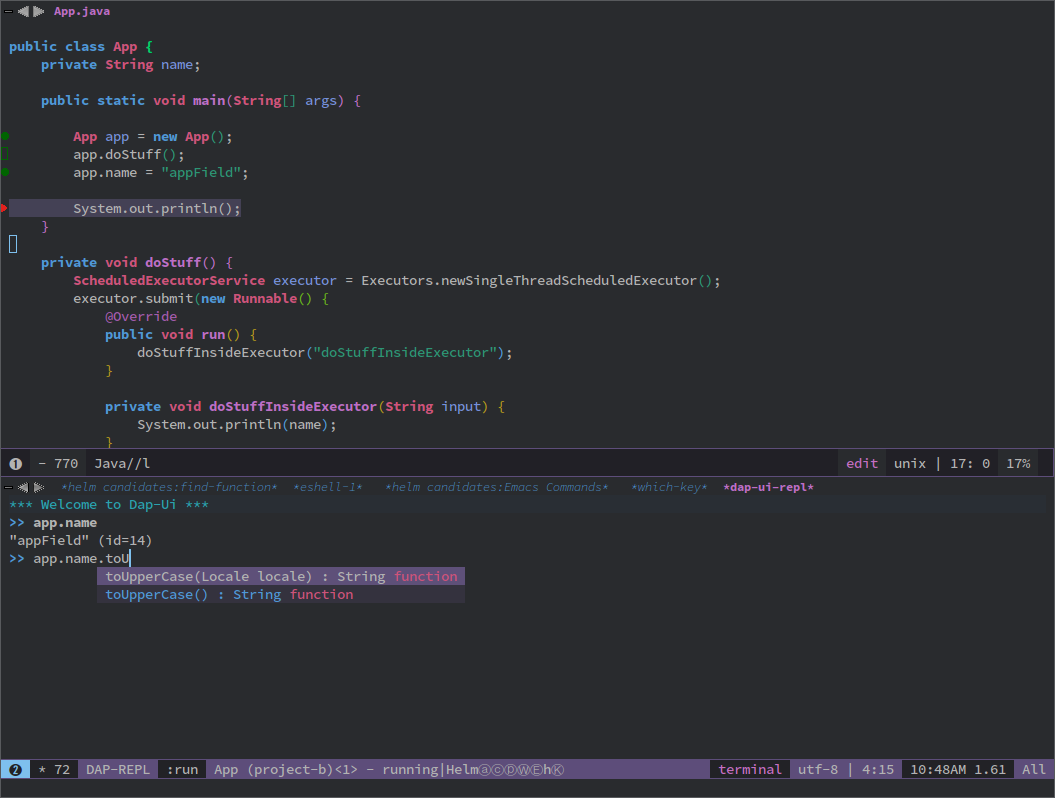
DAP provides a debug shell to execute command when the program has hit
breakpoints. The REPL has the same features as standart emacs shell (e. g.
command history, C-p/n navigation through history, etc.) in addition to
optional company-mode autocompletion.
Enable both dap-mode and dap-ui-mode.
(dap-mode 1)
(dap-ui-mode 1)
;; enables mouse hover support
(dap-tooltip-mode 1)
;; use tooltips for mouse hover
;; if it is not enabled `dap-mode' will use the minibuffer.
(tooltip-mode 1)
After enabling DAP mode on emacs side follow the language specific settings.
Latest version of LSP Java will automatically discover if dap-mode is
present and it will download and install the required server side
components. If you have already downloaded a Eclispe JDT Server you will
have to force server update via lsp-java-update-server. In order to enable lsp java you will have to require dap-java.el
(require 'dap-java)| Command | Description |
|---|---|
dap-java-debug | Debug java |
dap-java-run-test-method | Run test method |
dap-java-debug-test-method | Debug test method |
dap-java-run-test-class | Run test class |
dap-java-debug-test-class | Debug test class |
- install latest version of ptvsd.
pip install "ptvsd>=4.2"- Then add the following line in your config:
(require 'dap-python)
This will add the python related configuration to
dap-debug.
- Download and extract VSCode Ruby Extension. You can do that either by:
- Calling
dap-ruby-setup, the extension will be downloaded and all your path will be automatically set up. - Or download the extension manually. Make sure that
dap-ruby-debug-programis:("node" path-to-main-js)wherenodeis either “node” if nodejs is on the path or path to nodejs andpath-to-main-jsis full path./out/debugger/main.jswhich is part of the downloaded VScode package.
- Calling
- Follow the instructions on installing
rdebug-idefrom Ruby Debug Installation - Put in your emacs configuration.
(require 'dap-ruby)
LLDB is a debugger that supports, among others, C, C++, Objective-C and Swift.
- Clone and follow the instructions to compile lldb-vscode from https://github.com/llvm-mirror/lldb/tree/master/tools/lldb-vscode
- Put in your emacs configuration.
(require 'dap-lldb)
Note: For proper Swift support, you need to compile LLDB from https://github.com/apple/swift-lldb and put the compiled LLDB library/framework in the “extensions” folder.
Make sure that you have properly configured Elixir and that you have Elixir LS
binaries on the path and put in your emacs configuration.
(require 'dap-elixir)Then when you do dap-debug-edit-template and select Elixir which will
generate runnable debug configuration. For more details on supported settings
by the Elixir Debug Server refer to it’s documentation.
For easier of setting up vscode extension, you only need to call dap-php-setup after requiring dap-php.
This is using felixbecker/vscode-php-debug (downloadable from the marketplace) as dap-server between emacs and the xdebug-extension on the http-server side. Make sure it is trans/compiled to javascript properly. Only tested under linux with node.
(require 'dap-php)To begin debugging, select “PHP Run Configuration” from the dap-debug menu, issue the debug request in your browser,
select the running thread (dap-switch-thread) and then dap-step-in.
Using https://github.com/WebFreak001/code-debug
For easier of setting up vscode extension, you only need call dap-gdb-lldb-setup after requiring dap-gdb-lldb.
Or download and extract VSCode extension (make sure that dap-gdb-lldb-path is pointing to the extract location).
(require 'dap-gdb-lldb)Then do dap-debug or dap-debug-edit-template and selet GBD or LLDB configuration.
- For easier of setting up vscode extension, you only need call
dap-go-setupafter requiringdap-go.- Or manually download and extract VSCode Go Extension.
- Install the delve command by following instructions on delve - installation.
- Put in your emacs configuration.
(require 'dap-go)
- For easier of setting up vscode extension, you only need call
dap-firefox-setupafter requiringdap-firefox.- Or manually download and extract VSCode Firefox Debug Extension.
- Make sure that
dap-firefox-debug-programis pointing to the proper file. - Put in your configuration file:
(require 'dap-firefox)
dap-debug or dap-debug-edit-template and select the firefox template. For additional documentation on the supported template parameters or about different configuration templates refer to Firefox Debug Adapter.
- For easier of setting up vscode extension, you only need call
dap-chrome-setupafter requiringdap-chrome.- Or manually download and extract VSCode Chrome Debug Extension.
- Make sure that
dap-chrome-debug-programis pointing to the proper file. - Put in your configuration file:
(require 'dap-chrome)
dap-debug or dap-debug-edit-template and select the chrome template. For additional documentation on the supported template parameters or about different configuration templates refer to Chrome Debug Adapter.
- For easier of setting up vscode extension, you only need call
dap-edge-setupafter requiringdap-edge.- Or manually download and extract VSCode Edge Debug Extension.
- Make sure that
dap-edge-debug-programis pointing to the proper file. - Put in your configuration file:
(require 'dap-edge)
dap-debug or dap-debug-edit-template and select the edge template. For additional documentation on the supported template parameters or about different configuration templates refer to Edge Debug Adapter.
- For easier of setting up vscode extension, you only need call
dap-node-setupafter requiringdap-node.- Or manually download and extract VSCode Node Debug Extension.
- Make sure that
dap-node-debug-programis pointing to the proper file. - Put in your configuration file:
(require 'dap-node)
dap-debug or dap-debug-edit-template and select the node template. For additional documentation on the supported template parameters or about different configuration templates refer to Nodejs Debugging.
There are two methods that are used for registering remote extensions:
dap-register-debug-provider- register a method to call for populating startup parameters. It should either populate:debugPortand:hostin case of TCP Debug Adapter Server or:dap-server-pathwhen STD out must be used for Debug Adapter Server communication.dap-register-debug-templateregister a debug template which will be available whendap-debugis called. The debug template must specify:typekey which will be used to determine the provider to be called to populate missing fields.
For full example you may check dap-java.el.
(dap-register-debug-provider
 "programming-language-name"
 (lambda (conf)
   (plist-put conf :debugPort 1234)
   (plist-put conf :host "localhost")
   conf))

(dap-register-debug-template "Example Configuration"
                             (list :type "java"
                                   :request "launch"
                                   :args ""
:name "Run Configuration"))If you notice a bug, open an issue on Github Issues.
- Daniel Martin - LLDB integration.
- Kien Nguyen - NodeJS debugger, Edge debuggers, automatic extension installation.
- Aya Igarashi - Go debugger integration.
- Watches

