Work in progress.
To make this a thing, we're going to need lots of food images...
Start uploading your food images here: https://share.streamlit.io/mrdbourke/nutrify/main/food_image_collector.py
Streaming progress on Twitch/making videos about it on YouTube.
End goal: take a photo of food an learn about it (nutrition information, where it's from, recipes, etc).
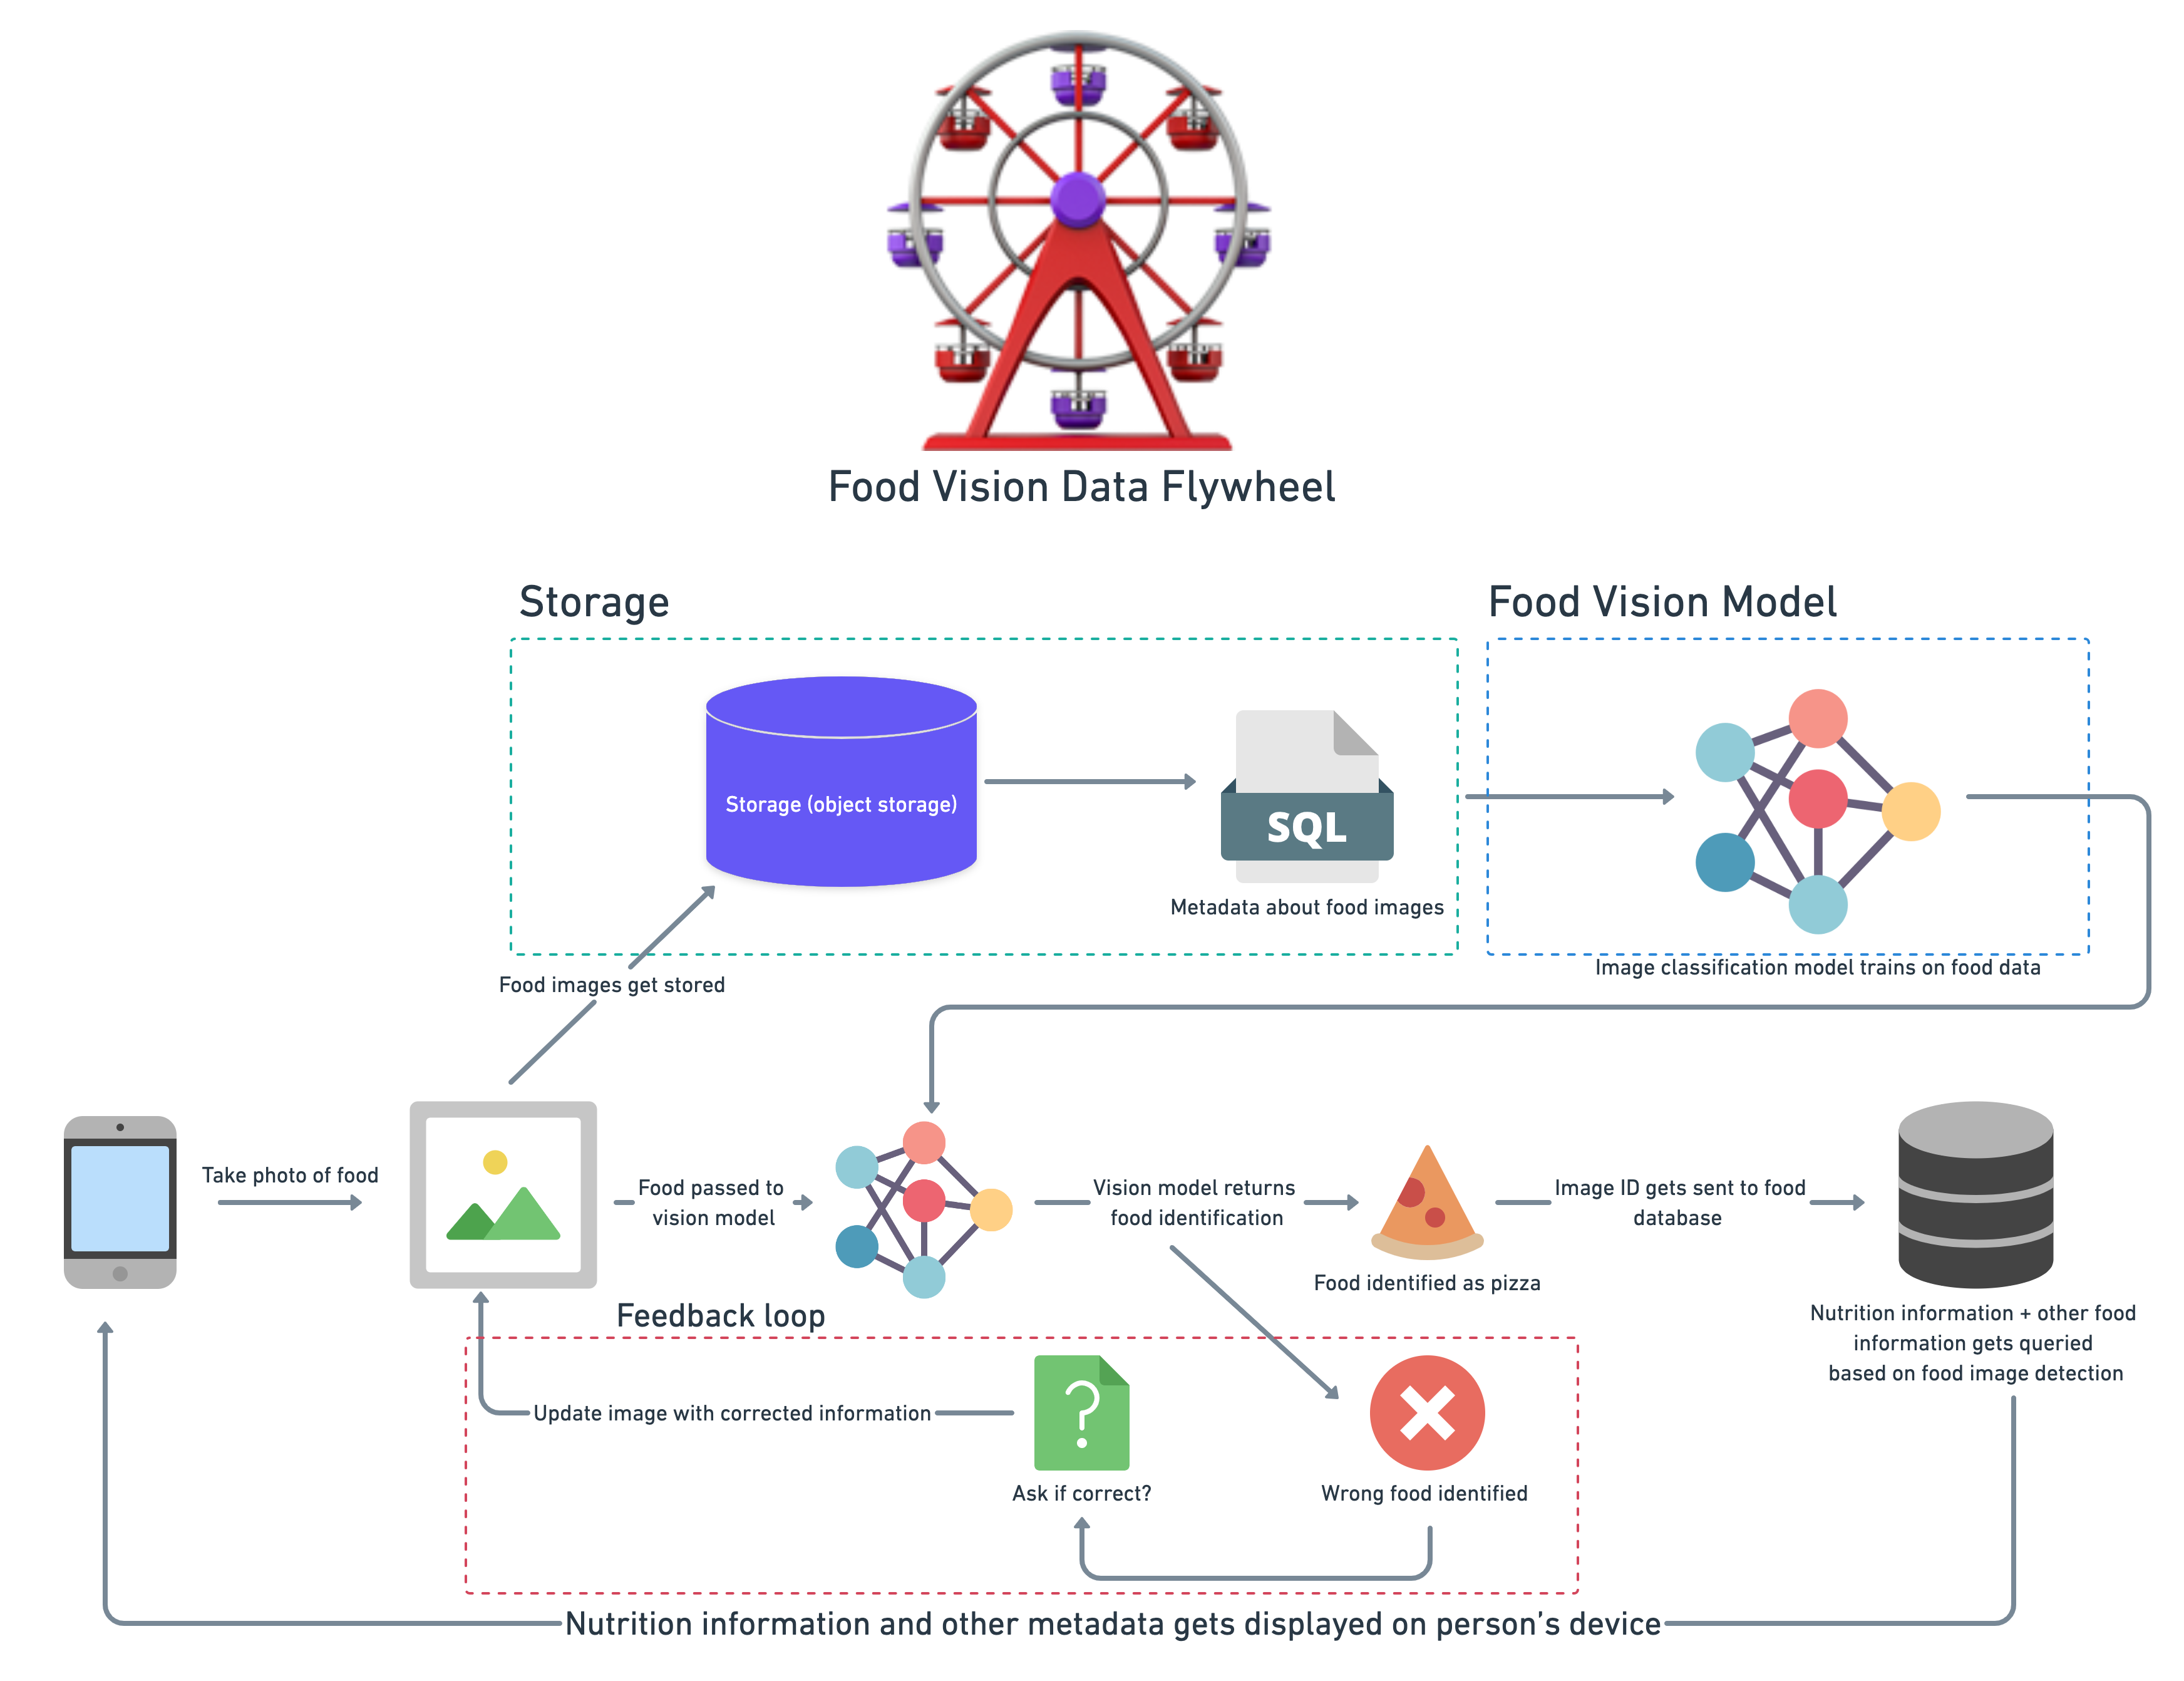
Something like this (a data flywheel for food images):

Status: making a small application to collect large amounts of food images.
images/- folder with misc images for the projectfood_image_collector.py- Streamlit-powered app that collects photos and uploads them to a Google Storage bucket and stores metadata in Google Sheets (these are private), see the workflow below.save_to_gsheets.py- Small utility script that saves a bunch of metadata about an uploaded image to a Google Sheet (this will likely move into a dedicatedutils/folder later on.utils.py- Series of helper functions used infood_image_collector.py, for example,upload_blod(), a function that uploads a photo to Google Storage.requirements.txt- A text file with the dependency requirements for this project.
The script food_image_collector.py is currently hosted using Streamlit Cloud. It does this:
As of: 15 September 2021
Note: this is very likely to change.
Build food image collection app, need a way to store images at large scale, images: object storage (Google Storage), info about images: relational database (PostgreSQL).
Build small prototype computer vision app to take a photo of ~10 different types of foods and return back their nutrition information (this'll be done via a public nutrition API, if you know of one, please let me know).
Merge inputs to stage 1 and stage 2 into a database (start linking together the data flywheel, more images get taken, models get improved, more images, better models, more images, better models, etc).
Upgrade stage 1, 2, 3 to work with world's 100 most commonly eaten foods (start with top of the Pareto curve and then start working backwards towards the tail).
Repeat the above until almost every food you can eat is covered.
