It is a no-nonsense, lean and mean, fast 8085 simulator written in pure C. It supports actual 8085 opcodes, packs an assembler, disassembler, debugger and virtual machine - the whole suite - for compiling, debugging and running 8085 programs at a glance.
It also features a nice little REPL CUI, written as a separate project of mine (Cell).
Unfortunately, due to some compatibility problems of Cell, The8085 cannot be compiled on Windows, which is not necessarily a bad thing. I use Linux as my primary OS and Windows has enough of these or far better 8085 simulators anyway.
I have also provided a CMakeLists.txt for people who are into that sort of thing.
First, clone the project :
git clone https://gitlab.com/iamsubhranil/The8085_v2.git
cd The8085_v2
git submodule update --init Cell
For people with CMake, you can do an out of directory build :
mkdir build
cd build
cmake -DCMAKE_BUILD_TYPE=Release ..
make all
./the8085
For everybody else :
your-favourite-c-compiler *.c Cell/cell.c -O3 -o the8085
ENABLE_TESTS: Run all tests before initializing the REPL to ensure consistency of the virtual machine. All of these tests must pass in each commit.
Run with :
./the8085
or
./the8085 <file_to_run>
or
./the8085 <file_to_run> <address_to_load>
The least -std I can compile this with is gnu99, which I think is enough of legacy support anyway. Also, this will fail to compile on any compiler which doesn't support gnu standards. Considering the OS to be Linux, this shouldn't be much of a problem.
The supported syntax is exactly similar to the original 8085 syntax, only to make it look pretty and reduce some typing hassle, all opcodes must be in lowercase. See test and programs folders to get a better idea.
The8085 has two modes of assembly - file mode and inline mode.
In file mode, you specify a file name to read and assemble from, and the assembler parses and assembles the whole file at once, either storing or not storing corresponding 8085 opcodes to memory, depending upon the result of compilation.
To use file mode of compilation, invoke the load keyword.
>> load <filename-to-load> <memory-address-to-store>
The assembler will output various error messages with full source highlighting in case one or more errors occurs. In case of successful compilation it will display a message like the following :
[load] <filename-to-load> loaded [starting-address - ending-address]
If the result of compilation is unsuccessful, no guarantees are made on the content of the memory starting from the specified <memory-address-to-store>.
This mode is directly invoked if you run the program with an argument as file-to-run. In that case, the compiled code is executed directly, no shell is provided, and the program exits as soon as the code finishes executing.
That way of invokation is exactly similar as doing the following :
>> load <file-to-run> 0x100
[load] <file-to-run> loaded [0x100 - <ending-address>]
>> dis 0x100 <ending-address>
...
>> exec 0x100
Optionally, if you also provide an address-to-load as the second argument, the consecutive load, dis and exec starts from there.
In this mode of assembly, you can write and compile one line of assembly code at a time. Like the file mode, if the result of compilation is unsuccessful, no guarantees are made on the content of the memory at the specific address.
To invoke this mode, use the asm keyword.
>> asm <memory-address-to-start>
After invoking this command, the inline assembler will initialize itself, show a bunch of help messages to the user, point to the <memory-address-to-start>, and return the user to a new REPL. Considering <memory-address-to-start> to be c050, this should look like the following :
[c050] >> _
The compilation will start from the address c050, and increment automatically depending upon the statements to be compiled. You can write any valid 8085 assembly statement here, followed by an Enter, which will result the statement to be compiled and loaded at the specified memory address.
The real beauty of this mode lies on the help keyword and autocomplete features. Invoking help you should see all different 8085 opcodes and a short description of them. You will even get full autocompletion and command suggestion feature on each one of them. For example, if you press j followed by a tab, you will be presented with the first opcode that starts with j, and pressing consecutive tabs will circle you through all the opcodes that starts with j. This is a feature of Cell rather than a feature of The8085, nonetheless it is pretty cool. You will also be notified of abusing of labels in the programs - specifically using undeclared labels upon compilation of the statement and at exit of this REPL.
Here is an example how this mode works :
>> asm c050
[0xc050] >> xra a
0xc050: 0xaf
[0xc051] >> mvi a, 05h
0xc051: 0x3e
0xc052: 0x05
[0xc053] >> jnz exit
[Warning] Label used but not declared yet!
[line 1] jnz exit
             ^^^^
[Info] To avoid erroneous results, either declare or manually patch the label before execution.
0xc053: 0xc2
0xc054: 0x00
0xc055: 0x00
[0xc056] >> label exit: hlt
0xc056: 0x76
[0xc057] >> exit
>> _
You can even get the details of a specific opcode, including types and number of operands, instruction length, machine cycles and t-states that it takes by typing help <opcode> inside the shell. For a bonus, The8085 will generate a random example for you on how to use this opcode as well, at runtime.
The disassembler takes two addresses as inputs - the starting and ending addresses to disassemble between - decomposes every byte, and shows the corresponding assembly code to the user. To avoid the hassle of manually finding a hlt to stop disassembly, it also takes the ending address explicitly. The output is unknown if you try to disassemble the content of an address which is not a valid 8085 opcode.
To invoke the disassembler, use the dis keyword.
>> dis <address-to-disassemble-from> <address-to-disassemble-upto>
It outputs three columns in the following format
addr: <assembly-code> <hex-code>
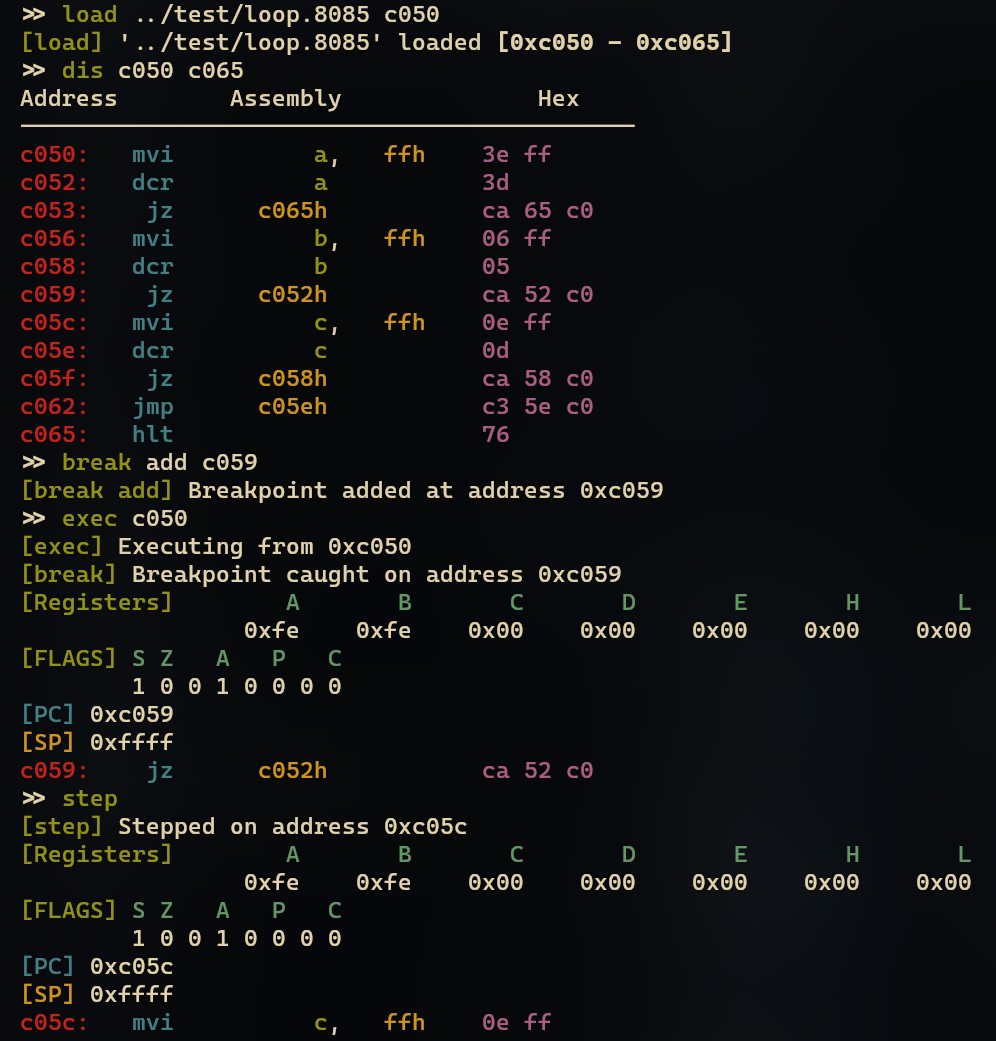
Here is an example of the disassembly of test/loop.8085, loaded at 0xc050 :
>> load test/loop.8085 c050
[load] 'test/loop.8085' loaded [0xc050 - 0xc065]
>> dis c050 c065
Address        Assembly		     Hex
--------------------------------------------
c050:   mvi	     a,   ffh	 3e ff
c052:   dcr	     a       	 3d
c053:    jz	 c065h       	 ca 65 c0
c056:   mvi	     b,   ffh	 06 ff
c058:   dcr	     b       	 05
c059:    jz	 c052h       	 ca 52 c0
c05c:   mvi	     c,   ffh	 0e ff
c05e:   dcr	     c       	 0d
c05f:    jz	 c058h       	 ca 58 c0
c062:   jmp	 c05eh       	 c3 5e c0
c065:   hlt	             	 76
>> _
You can manually set or view the content of a range of addresses in memory by using the set and show keywords. Keep in mind though all values are in hex.
>> show 8000
[show] 8000: 0x3b
>> show 8000 8004
[show] 8000: 0x3b
[show] 8001: 0x65
[show] 8002: 0xb7
[show] 8003: 0x8e
[show] 8004: 0x1f
>> set 8000 3f
[set] 0x8000: 0x3b -> 0x3f
>> set 8000 2c 4b 62 8a 39
[set] 0x8000: 0x3f -> 0x2c
[set] 0x8001: 0x65 -> 0x4b
[set] 0x8002: 0xb7 -> 0x62
[set] 0x8003: 0x8e -> 0x8a
[set] 0x8004: 0x1f -> 0x39
>> _
To execute a program which starts at an address addr in memory, use the exec keyword like the following :
>> exec <addr>
The machine will execute consecutive instructions until it reaches a hlt or a breakpoint has occurred - more on that later.
ProTip (mostly to myself) : If your program is giving erroneous results, always check for a hlt at the end.
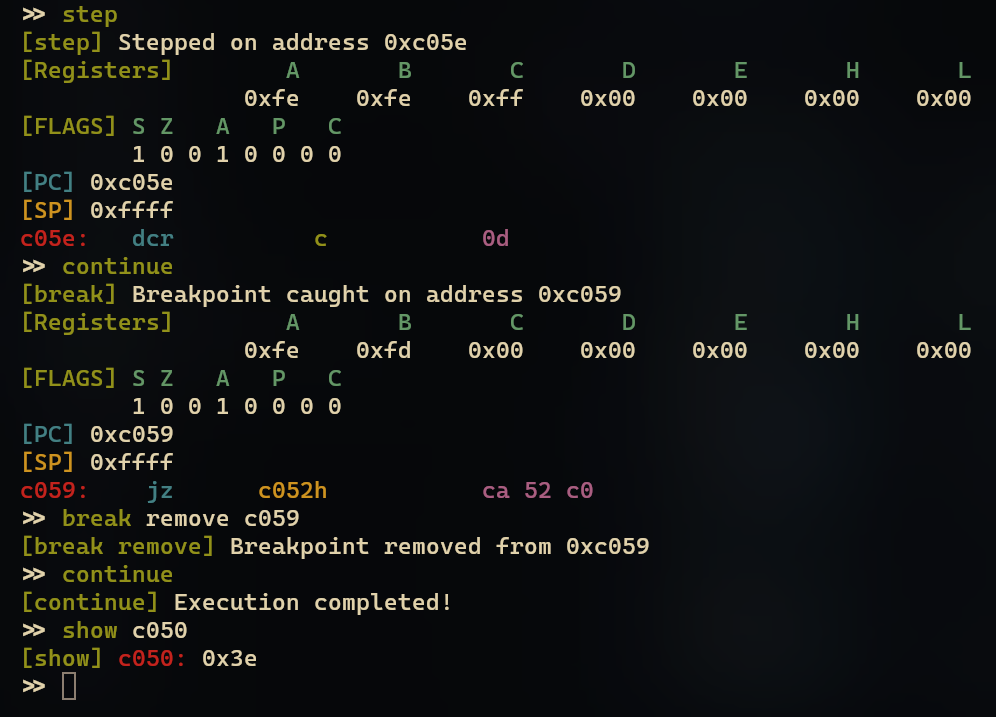
You can add breakpoints to some address(es) in memory, the machine will pause the execution when the program counter reaches to that particular address(es) in memory.
To add a breakpoint to an address, use the break add command.
>> break add <memory-address-to-break-at>
On successful addition of the breakpoint, a message like the following will be shown (considering the address to be c050):
[break add] Breakpoint added at address 0xc050
If you attach multiple breakpoints to one address, only the first will remain.
You can view all attached breakpoints using break view command. To remove an attached breakpoint, use break remove command.
When a running program reaches to a breakpoint, the machine will pause its execution, print its status (value stored in all registers and flags), and show the instruction that is going to be executed (i.e. the instruction at addr). Here is an example of the same using programs/store_sum.8085 loaded at 0xc050 :
>> load programs/store_sum.8085 c050
[load] 'programs/store_sum.8085' loaded [0xc050 - 0xc061]
>> dis c050 c061
Address        Assembly		     Hex
--------------------------------------------
c050:   lxi	     h, c000h	 21 00 c0
c053:   mov	     b,     m	 46
c054:   inx	     h       	 23
c055:   mov	     a,     m	 7e
c056:   mvi	     d,   00h	 16 00
c058:   add	     b       	 80
c059:   jnc	 c05dh       	 d2 5d c0
c05c:   inr	     d       	 14
c05d:   inx	     h       	 23
c05e:   mov	     m,     a	 77
c05f:   inx	     h       	 23
c060:   mov	     m,     d	 72
c061:   hlt	             	 76
>> break add c053
[break add] Breakpoint added at address 0xc053
>> exec c050
[exec] Executing from 0xc050
[break] Breakpoint caught on address 0xc053
[Registers]	   A	   B	   C	   D	   E	   H	   L
          	0x00	0x00	0x00	0x00	0x00	0xc0	0x00
[FLAGS] S Z   A   P   C
        0 0 0 0 0 0 0 0
[PC] 0xc053
[SP] 0xffff
c053:   mov	     b,     m	 46
>> _
When the machine stumbles upon a breakpoint, you can execute only the next instruction, i.e. step to the next instruction if you want using the step keyword like the following (continuing the previous example) :
>> step
[step] Stepped on address 0xc054
[Registers]	   A	   B	   C	   D	   E	   H	   L
          	0x00	0x00	0x00	0x00	0x00	0xc0	0x00
[FLAGS] S Z   A   P   C
        0 0 0 0 0 0 0 0
[PC] 0xc054
[SP] 0xffff
c054:   inx	     h       	 23
>> _
The step keyword, along with set and show to manipulate the memory, creates a very powerful framework to easily debug the running program.
But obviously, more times than ever, you want to skip all other instructions and stop only at the breakpoints, such as when you're in a loop or in a large program, and hence you can use continue. It will keep the machine running until it stumbles upon the next breakpoint, in which case, the machine status will be printed like the previous and the REPL will wait for user input.
If you want the underlying virtual machine to match the speed of a real 8085 microprocessor (~3MHz), you can use the calibrate keyword. The calibrator will run through some instructions, compare the projected speed and actual speed, and adjust the sleep time of the virtual machine to get closer to 3MHz. You can invoke the keyword multiple times to get closer to 3MHz if you want, and the calibrator will refuse to calibrate the machine if it detects the average frequency to be less than 3MHz at all cases.
>> calibrate
[Info] Estimated time : 0.120400s (0.001204s/run) (0.0000003333s/t-state) (3.000000 mHz)
[Info] [Before] Total time : 0.002631s (0.000026s/run) (0.0000000073s/t-state) (137.286203 mHz)
[Info] Adjusting sleep for 326ns(0.0000003260s)..
[Info] [After] Total time : 0.165776s (0.001658s/run) (0.0000004590s/t-state) (2.178844 mHz)
>> calibrate
[Info] Estimated time : 0.120400s (0.001204s/run) (0.0000003333s/t-state) (3.000000 mHz)
[Info] [Before] Total time : 0.145392s (0.001454s/run) (0.0000004025s/t-state) (2.484318 mHz)
[Info] Not enough frequency delta to calibrate!
>> _
If you want to support the development of this project, get involved! Make a PR to any feature that you have in mind, trying to maintain the code style fully. Compile with -DENABLE_TESTS and make sure all of them passes.
This project is licensed under the MIT license. Use it as you want. No strings attached. If you like it, let me know by hitting the star button.

