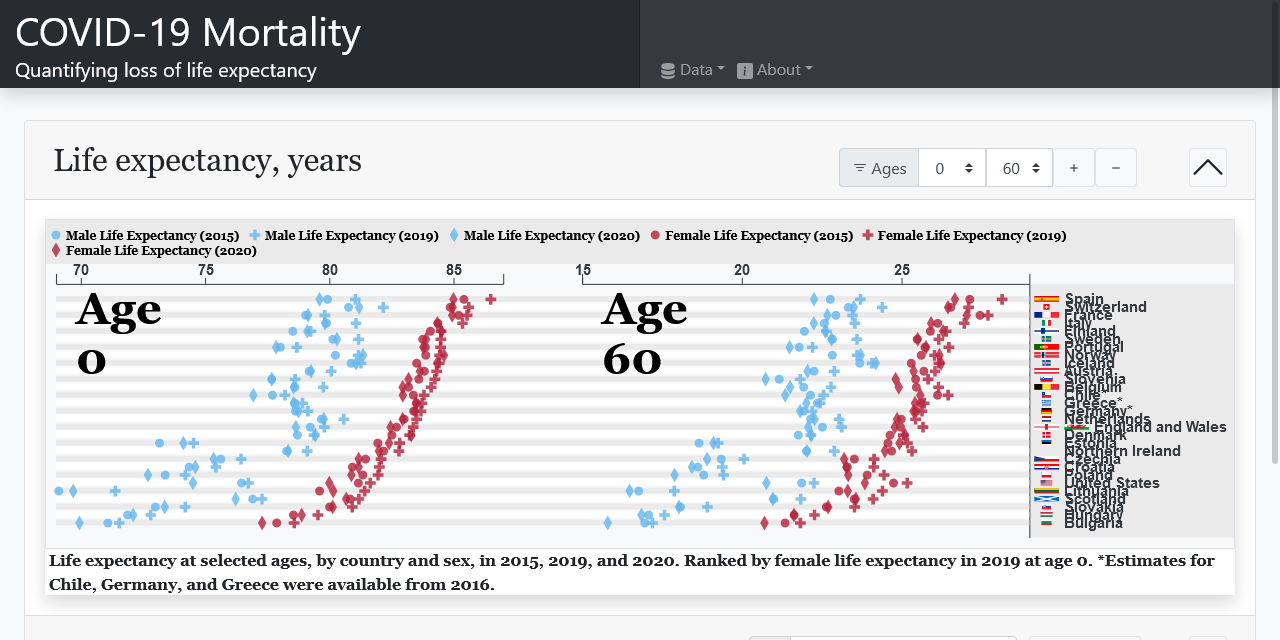
A Play Framework website for data visualisation. Customized from https://github.com/ianknowles/graphing-server-core for https://www.medrxiv.org/content/10.1101/2021.03.02.21252772v3.full to show changes to life expectancy due to the COVID-19 pandemic.
The build supports Scala.js for frontend scripting, slick for database access, and scss compilation.
The project can be compiled with sbt, and produces a .deb install archive. This installs the webserver as a service that requires a reverse-proxy such as nginx to be served on port 80 to the web.
No licenses are provided to redistribute the code, please contact the authors for a license if you wish to do so. The core dashboard platform will be freely available shortly.
