Prometheus is an open source systems monitoring and alerting toolkit that has been adopted by a larger number of companies and organizations. Prometheus is now part of the Cloud Native Computing Foundation (CNCF). It comprises of a Prometheus Server that scrapes and stores time series data and an alertmanager to handle alerts.
Prometheus scrapes metrics from instrumented jobs and stores all scraped samples locally and runs rules over this data or generate alerts. Grafana can be used to visualize the collected data.
We shall be installing Prometheus and Grafana tools on AWS EKS cluster and we assume that the AWS EKS cluster has already been provisioned. Prometheus and Grafana tools can easily be installed using helm
helm ls
In order to install Prometheus and Grafana, we can use gp2 EBS volumes for local storage. However for Production deployments it is highly recommended to use io1 EBS volumes for higher performance.
kubectl create -f prometheus-storageclass.yaml
curl -o prometheus-values.yaml https://raw.githubusercontent.com/helm/charts/master/stable/prometheus/values.yaml
- Modify the downloaded file to uncomment the storageClass and set it to "prometheus" at line # 164 and 664
- By default Prometheus server is exposed as ClusterIP, hence in order to access the Web UI we need to expose Prometheus server as a NodePort. Search for type: ClusterIP and add nodePort: 30900 and change the type to NodePort as indicated below.
    externalIPs: []

    loadBalancerIP: ""
    loadBalancerSourceRanges: []
    servicePort: 80
    nodePort: 30900
    type: NodePort
helm install -f prometheus-values.yaml stable/prometheus --name prometheus --namespace prometheus
kubectl get all -n prometheus
It shall render an output like this:
NAME                                                 READY     STATUS    RESTARTS   AGE
pod/prometheus-alertmanager-77cfdf85db-s9p48         2/2       Running   0          1m
pod/prometheus-kube-state-metrics-74d5c694c7-vqtjd   1/1       Running   0          1m
pod/prometheus-node-exporter-6dhpw                   1/1       Running   0          1m
pod/prometheus-node-exporter-nrfkn                   1/1       Running   0          1m
pod/prometheus-node-exporter-rtrm8                   1/1       Running   0          1m
pod/prometheus-pushgateway-d5fdc4f5b-dbmrg           1/1       Running   0          1m
pod/prometheus-server-6d665b876-dsmh9                2/2       Running   0          1m

NAME                                    TYPE        CLUSTER-IP       EXTERNAL-IP   PORT(S)    AGE
service/prometheus-alertmanager         ClusterIP   10.100.89.154    <none>        80/TCP     1m
service/prometheus-kube-state-metrics   ClusterIP   None             <none>        80/TCP     1m
service/prometheus-node-exporter        ClusterIP   None             <none>        9100/TCP   1m
service/prometheus-pushgateway          ClusterIP   10.100.136.143   <none>        9091/TCP   1m
service/prometheus-server               NodePort    10.100.151.245   <none>        80/30900   1m

NAME                                      DESIRED   CURRENT   READY     UP-TO-DATE   AVAILABLE   NODE SELECTOR   AGE
daemonset.apps/prometheus-node-exporter   3         3         3         3            3           <none>          1m

NAME                                            DESIRED   CURRENT   UP-TO-DATE   AVAILABLE   AGE
deployment.apps/prometheus-alertmanager         1         1         1            1           1m
deployment.apps/prometheus-kube-state-metrics   1         1         1            1           1m
deployment.apps/prometheus-pushgateway          1         1         1            1           1m
deployment.apps/prometheus-server               1         1         1            1           1m

NAME                                                       DESIRED   CURRENT   READY     AGE
replicaset.apps/prometheus-alertmanager-77cfdf85db         1         1         1         1m
replicaset.apps/prometheus-kube-state-metrics-74d5c694c7   1         1         1         1m
replicaset.apps/prometheus-pushgateway-d5fdc4f5b           1         1         1         1m
replicaset.apps/prometheus-server-6d665b876                1         1         1         1m
The Prometheus server can now be accessed at one of the node IP addresses at port 30900.
Run the following:
curl -o grafana-values.yaml https://raw.githubusercontent.com/helm/charts/master/stable/grafana/values.yaml
Edit the grafana-values.yaml file by replacing storageClass with "prometheus", enabled with true and adminPassword with your password "password"
persistence:
  enabled: true
  storageClassName: "prometheus"
  # accessModes:
  #   - ReadWriteOnce
  # size: 10Gi
  # annotations: {}
  # subPath: ""
  # existingClaim:

adminUser: admin
adminPassword: password
Uncomment the datasources section inside the grafana-values.yaml file and set the url attribute to point to the url of the Prometheus server
datasources:
 datasources.yaml:
   apiVersion: 1
   datasources:
   - name: Prometheus
     type: prometheus
     url: http://prometheus-server.prometheus.svc.cluster.local
     access: proxy
     isDefault: true
Change the grafana service type to LoadBalancer so that its is accessible using a AWS ELB Service url, all of these changes have been made to the file.
service:
  type: LoadBalancer
  port: 80
  annotations: {}
  labels: {}
helm install -f grafana-values.yaml stable/grafana --name grafana --namespace grafana
kubectl get all -n grafana
Retrieve the ELB url by running the following:
export ELB=$(kubectl get svc -n grafana grafana -o jsonpath='{.status.loadBalancer.ingress[0].hostname}')

echo "http://$ELB"
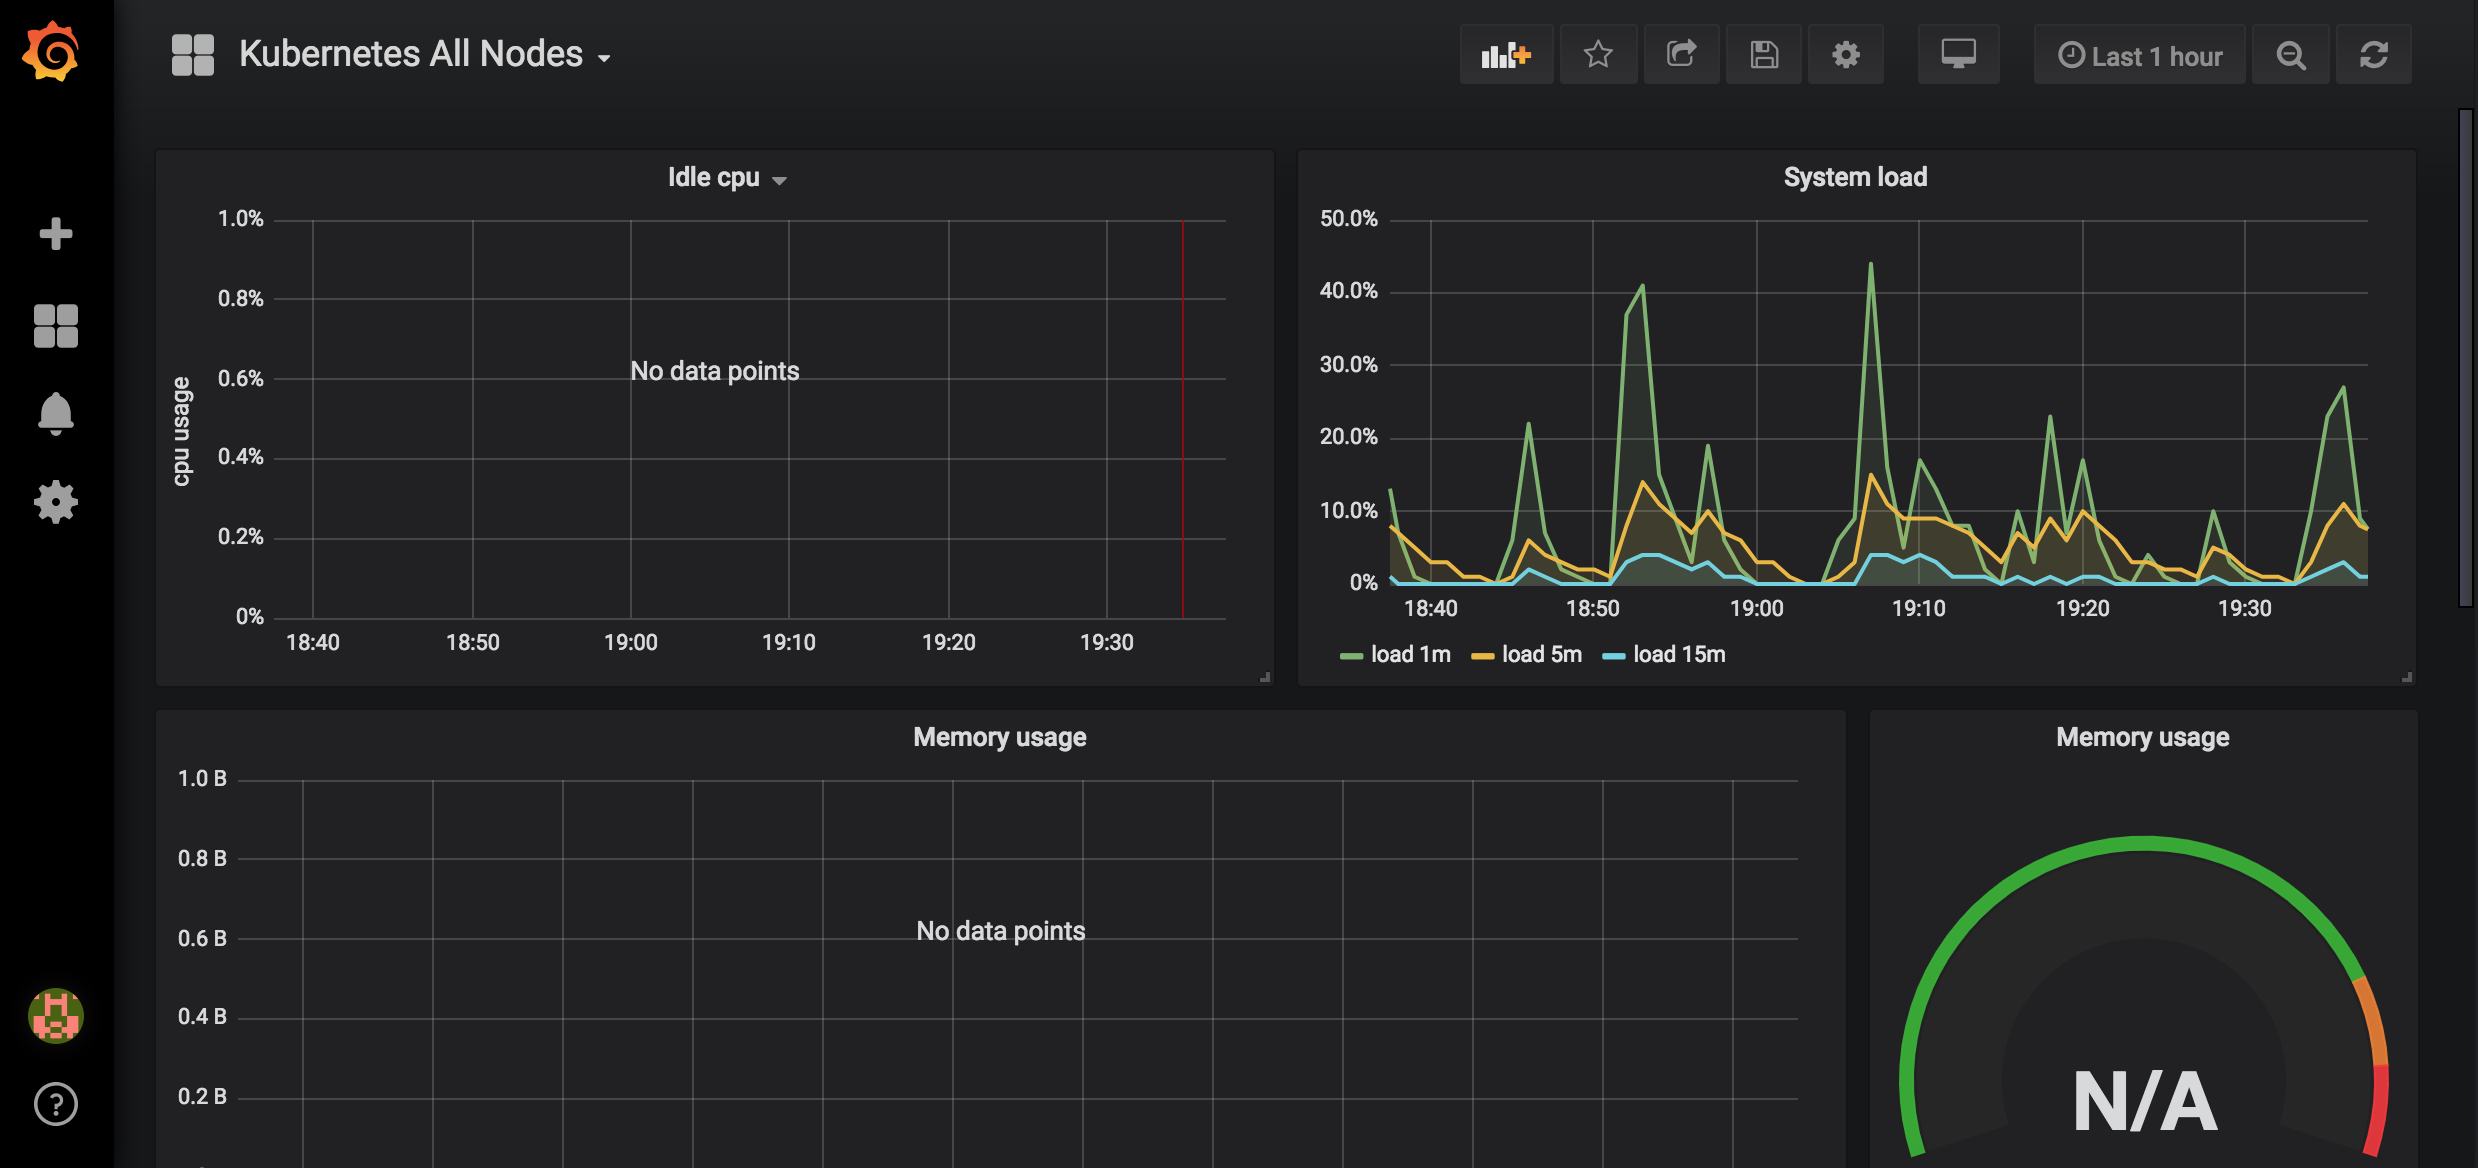
Using the ELB url, login to the Grafana dashboard. Since we configured the datasources section above, you will notice that Install Grafana & create your first data source are already completed. Click + button on the left panel and select import, enter 3131 dashboard id under Grafana.com Dashboard and click Load. Leave the defaults, select Prometheus as the endpoint under prometheus data sources drop down, click Import. This will sow monitoring dashboard for all the cluster nodes.
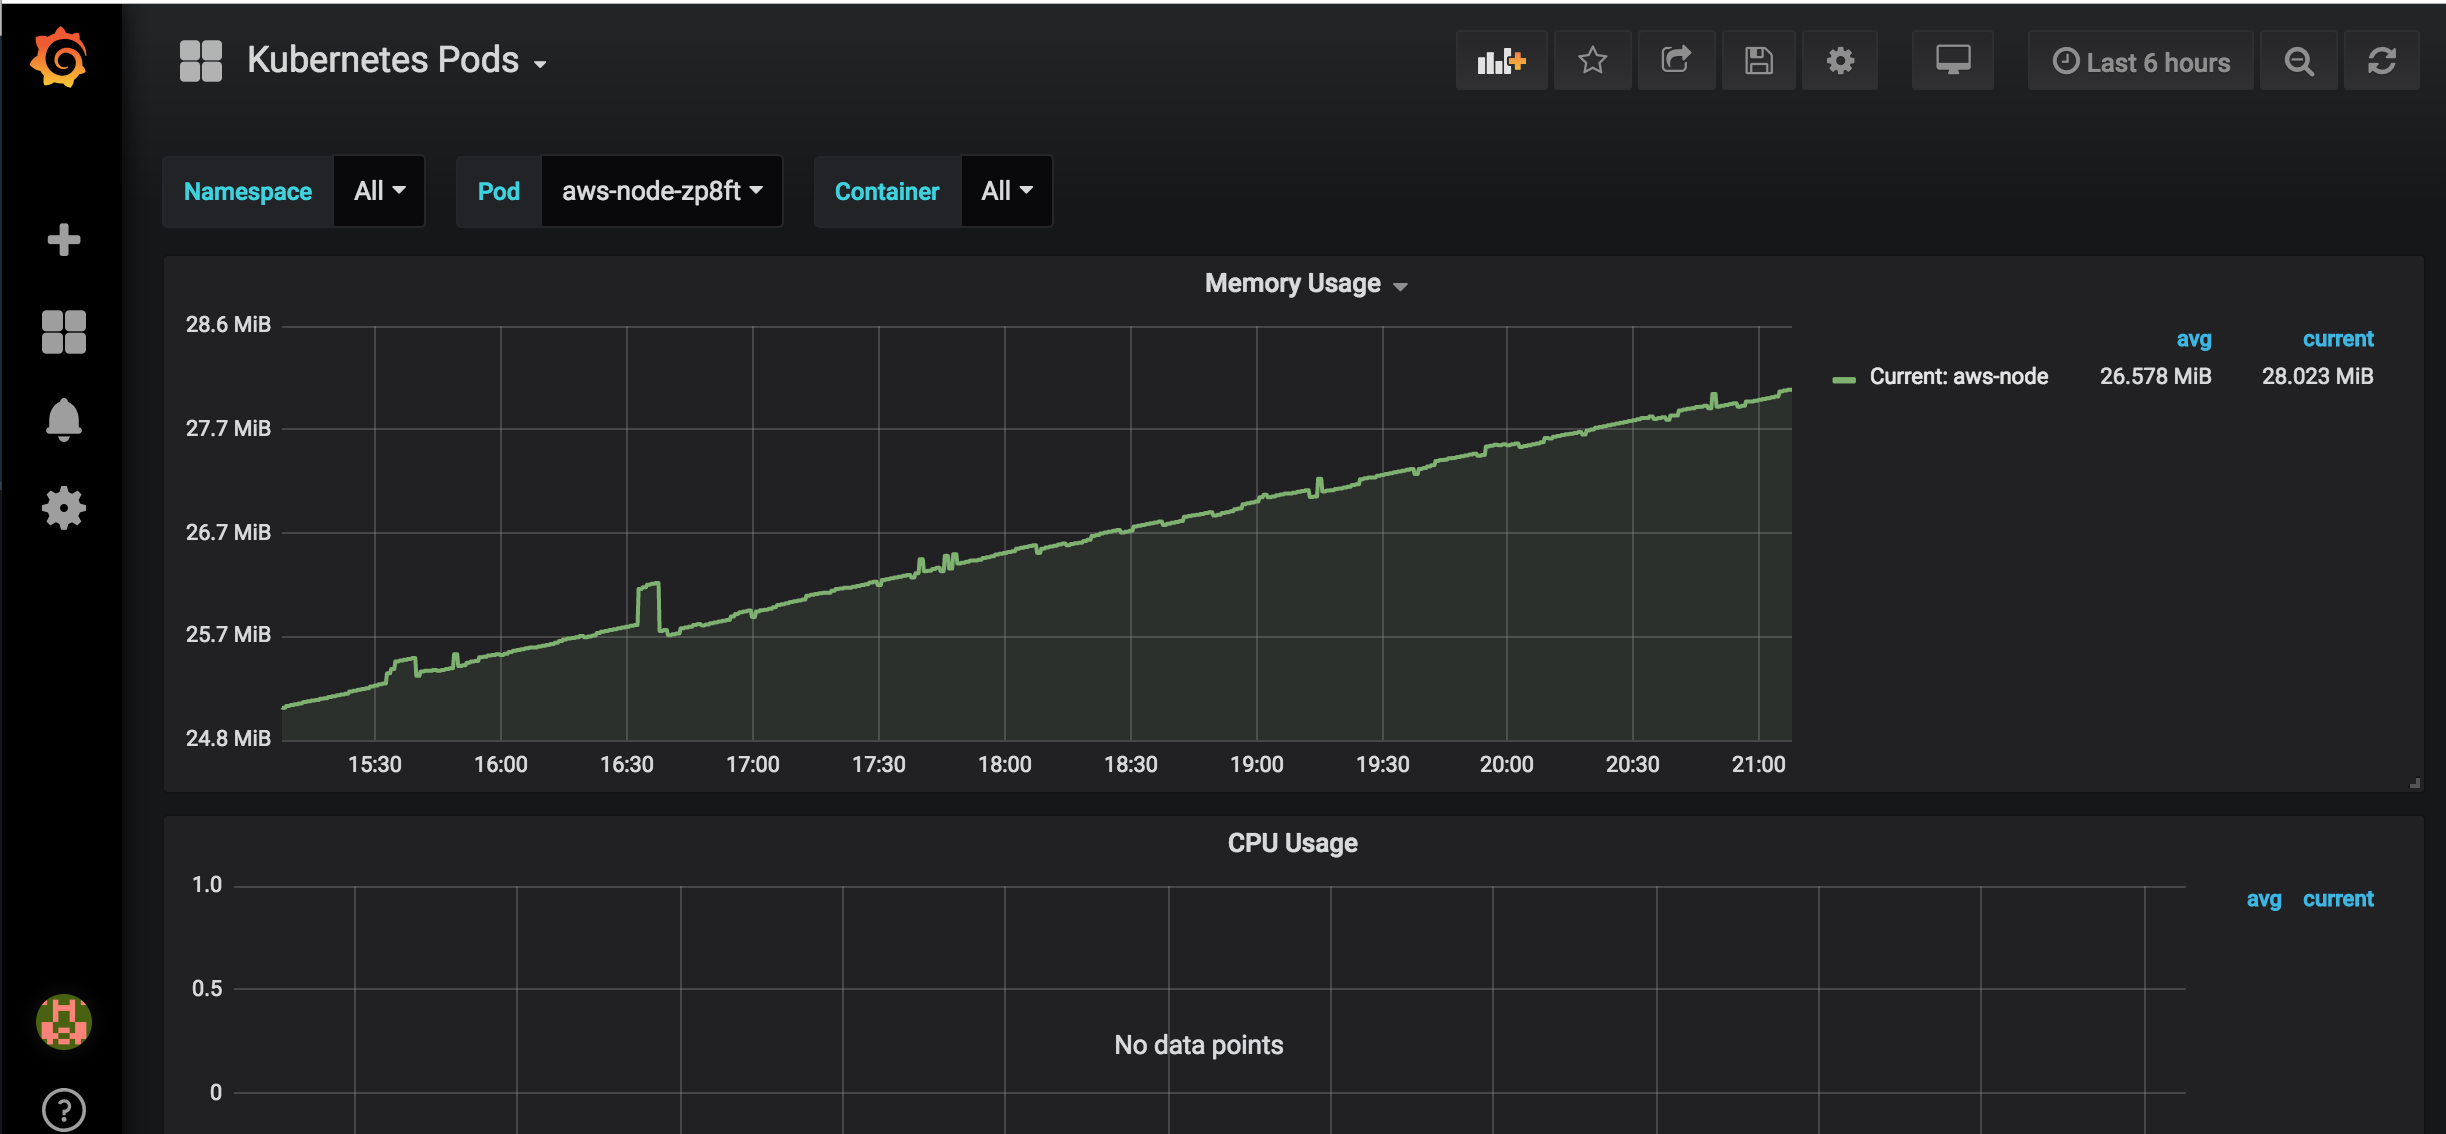
In order to monitor the EKS Kubernetes cluster pods, create a dashboard and enter 3146 for dashboard id.


