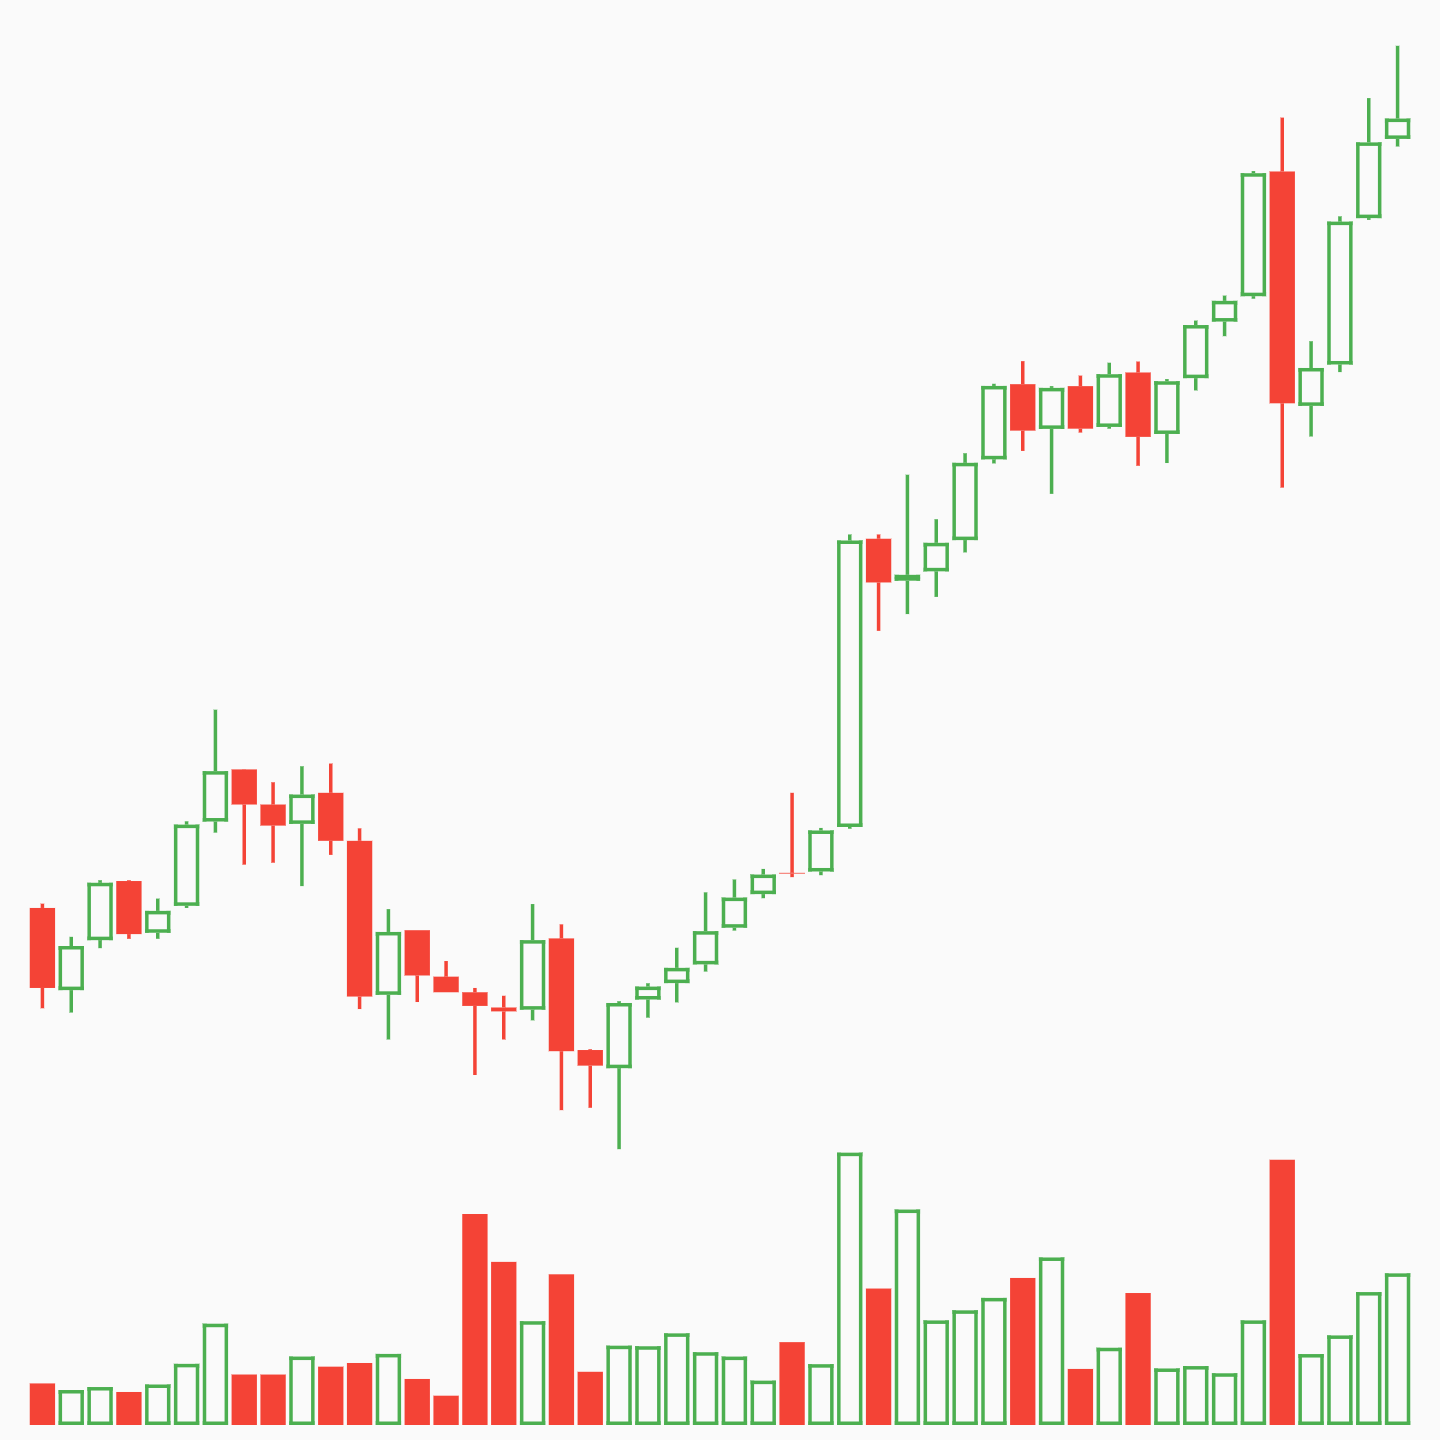
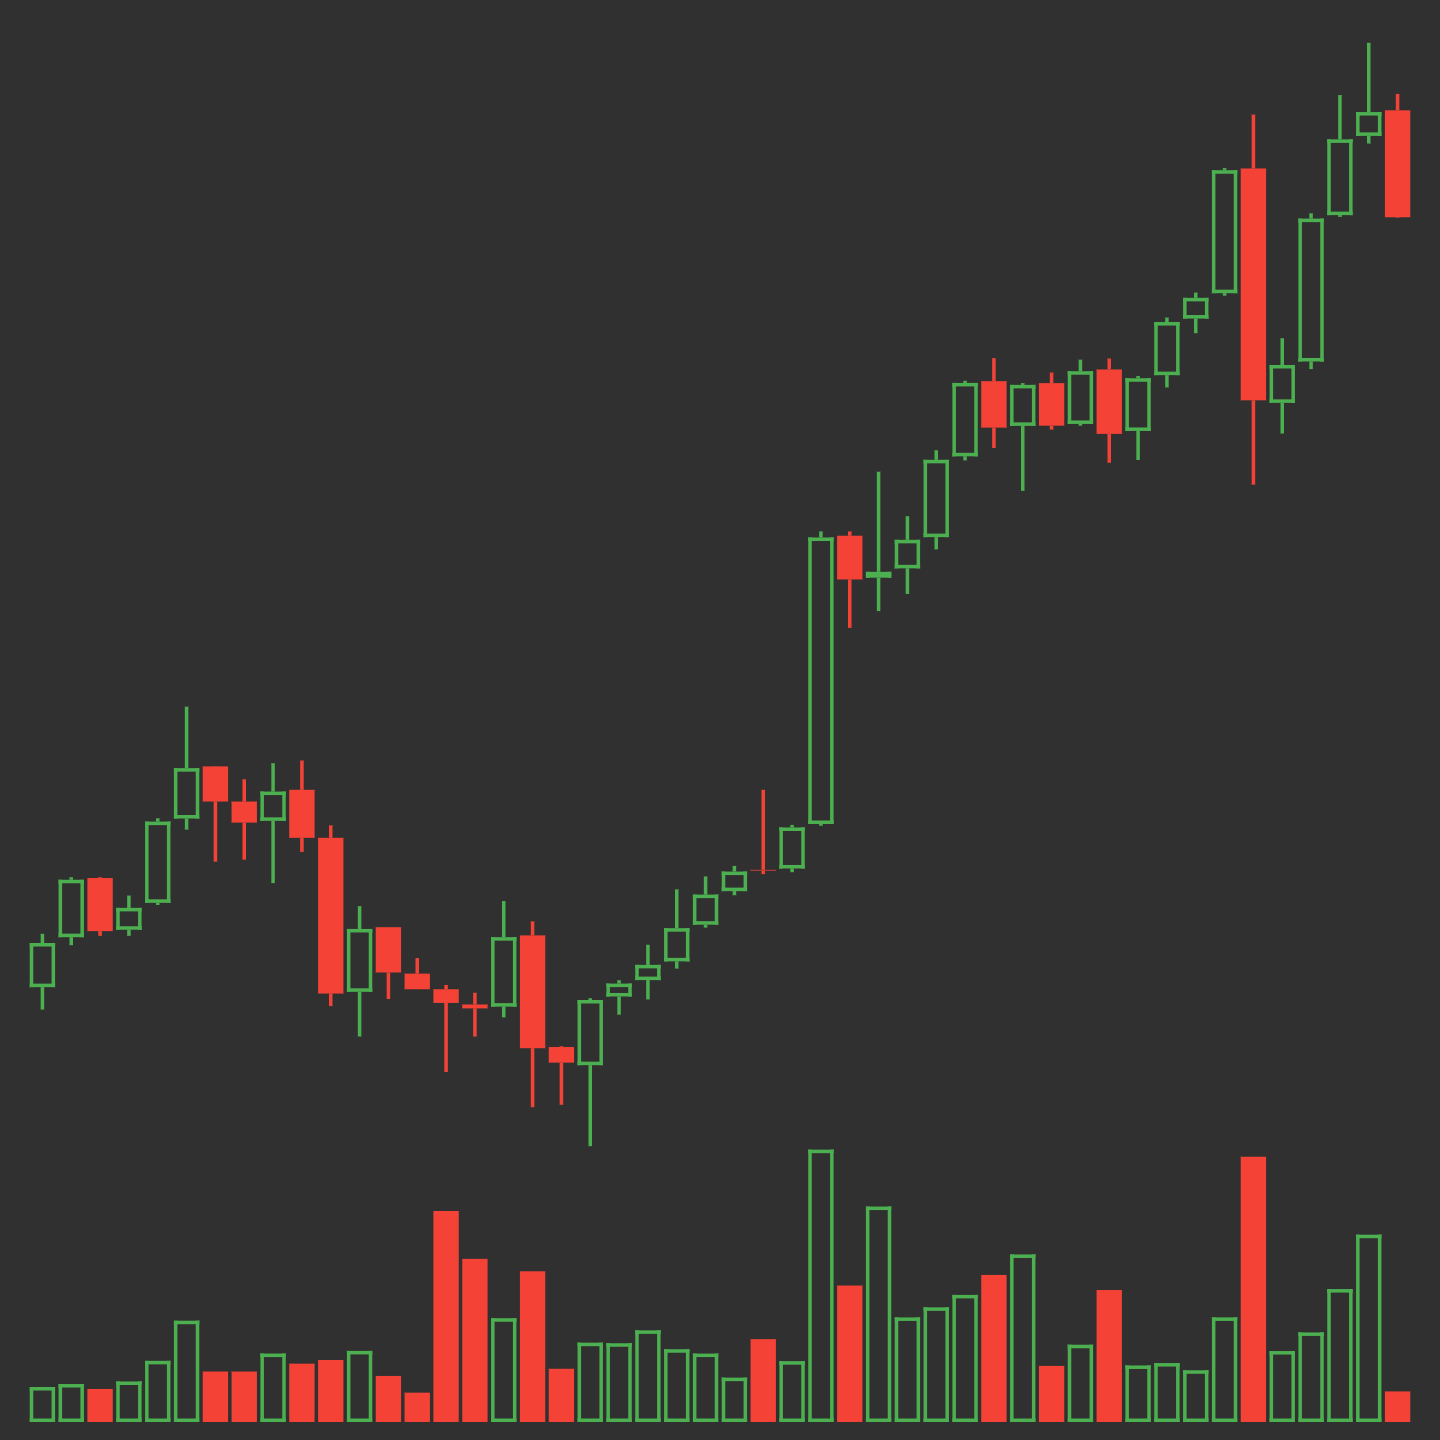
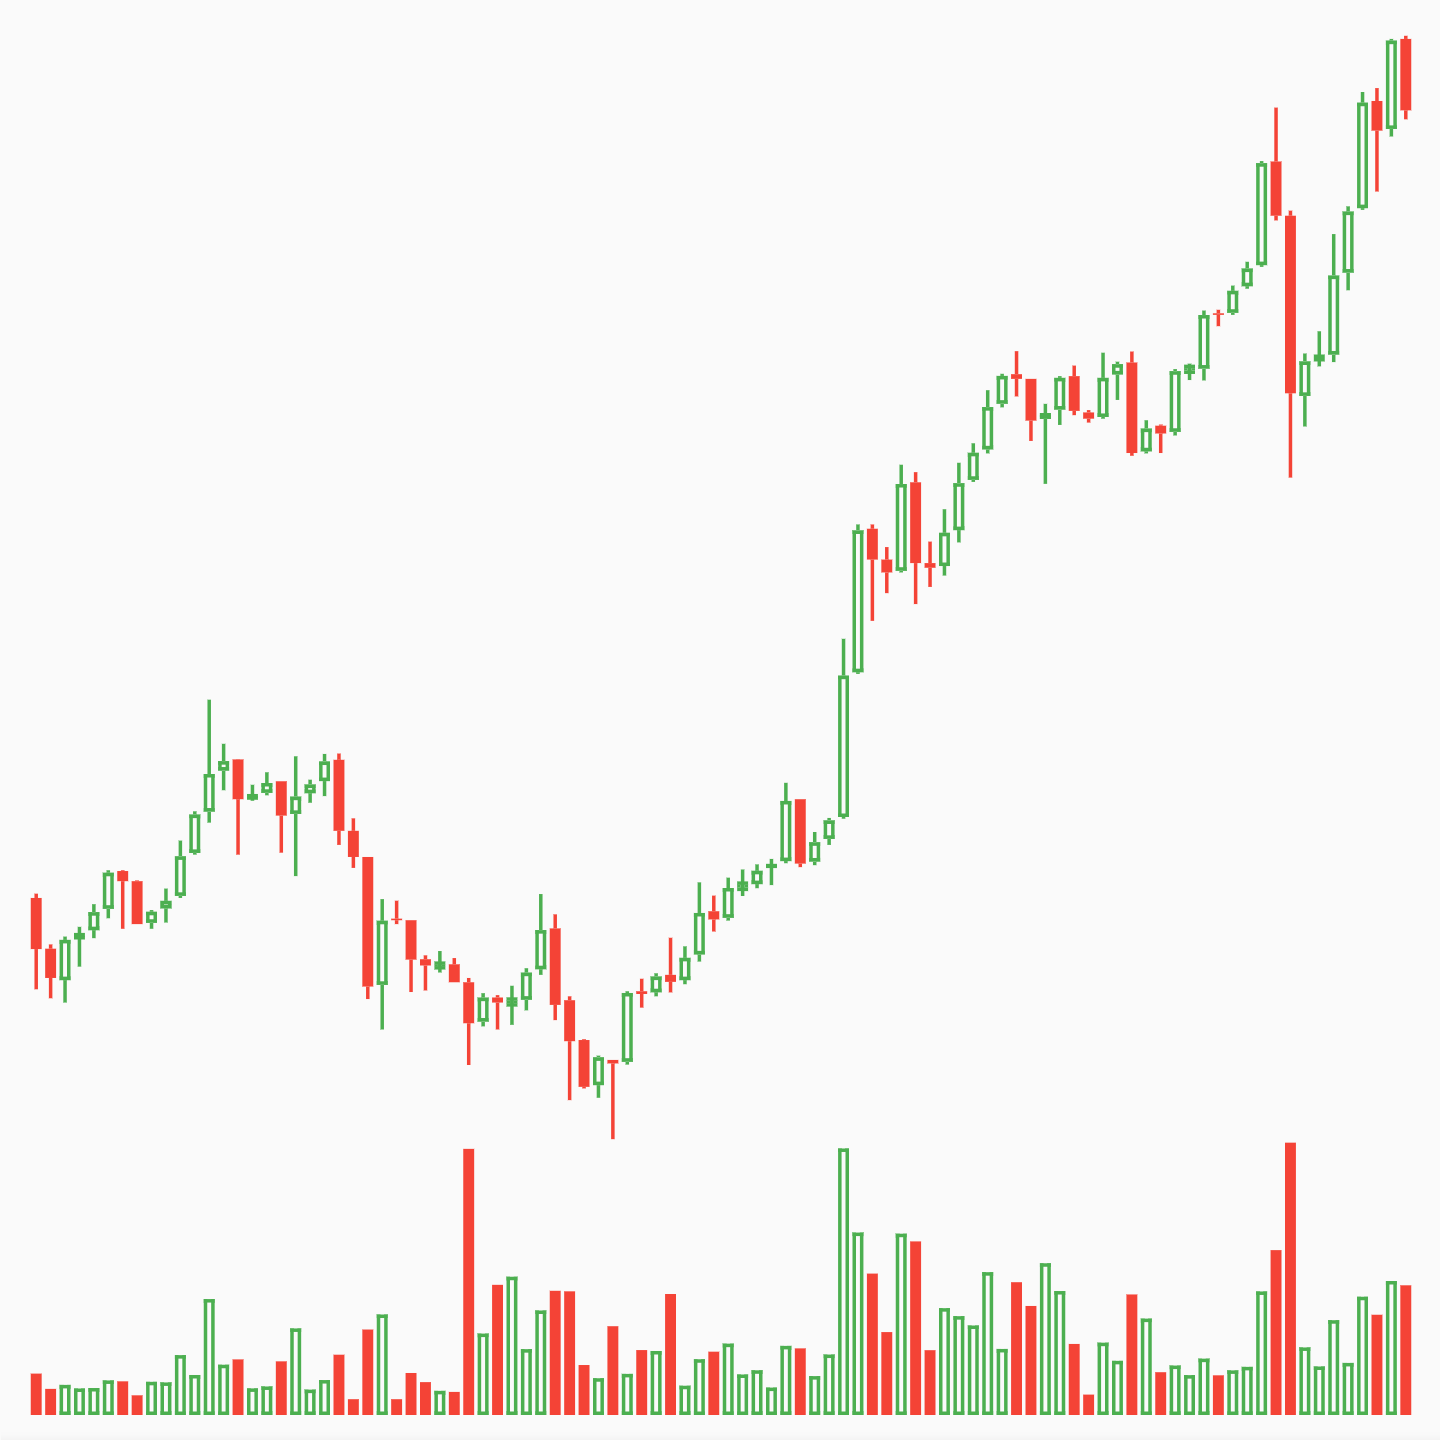
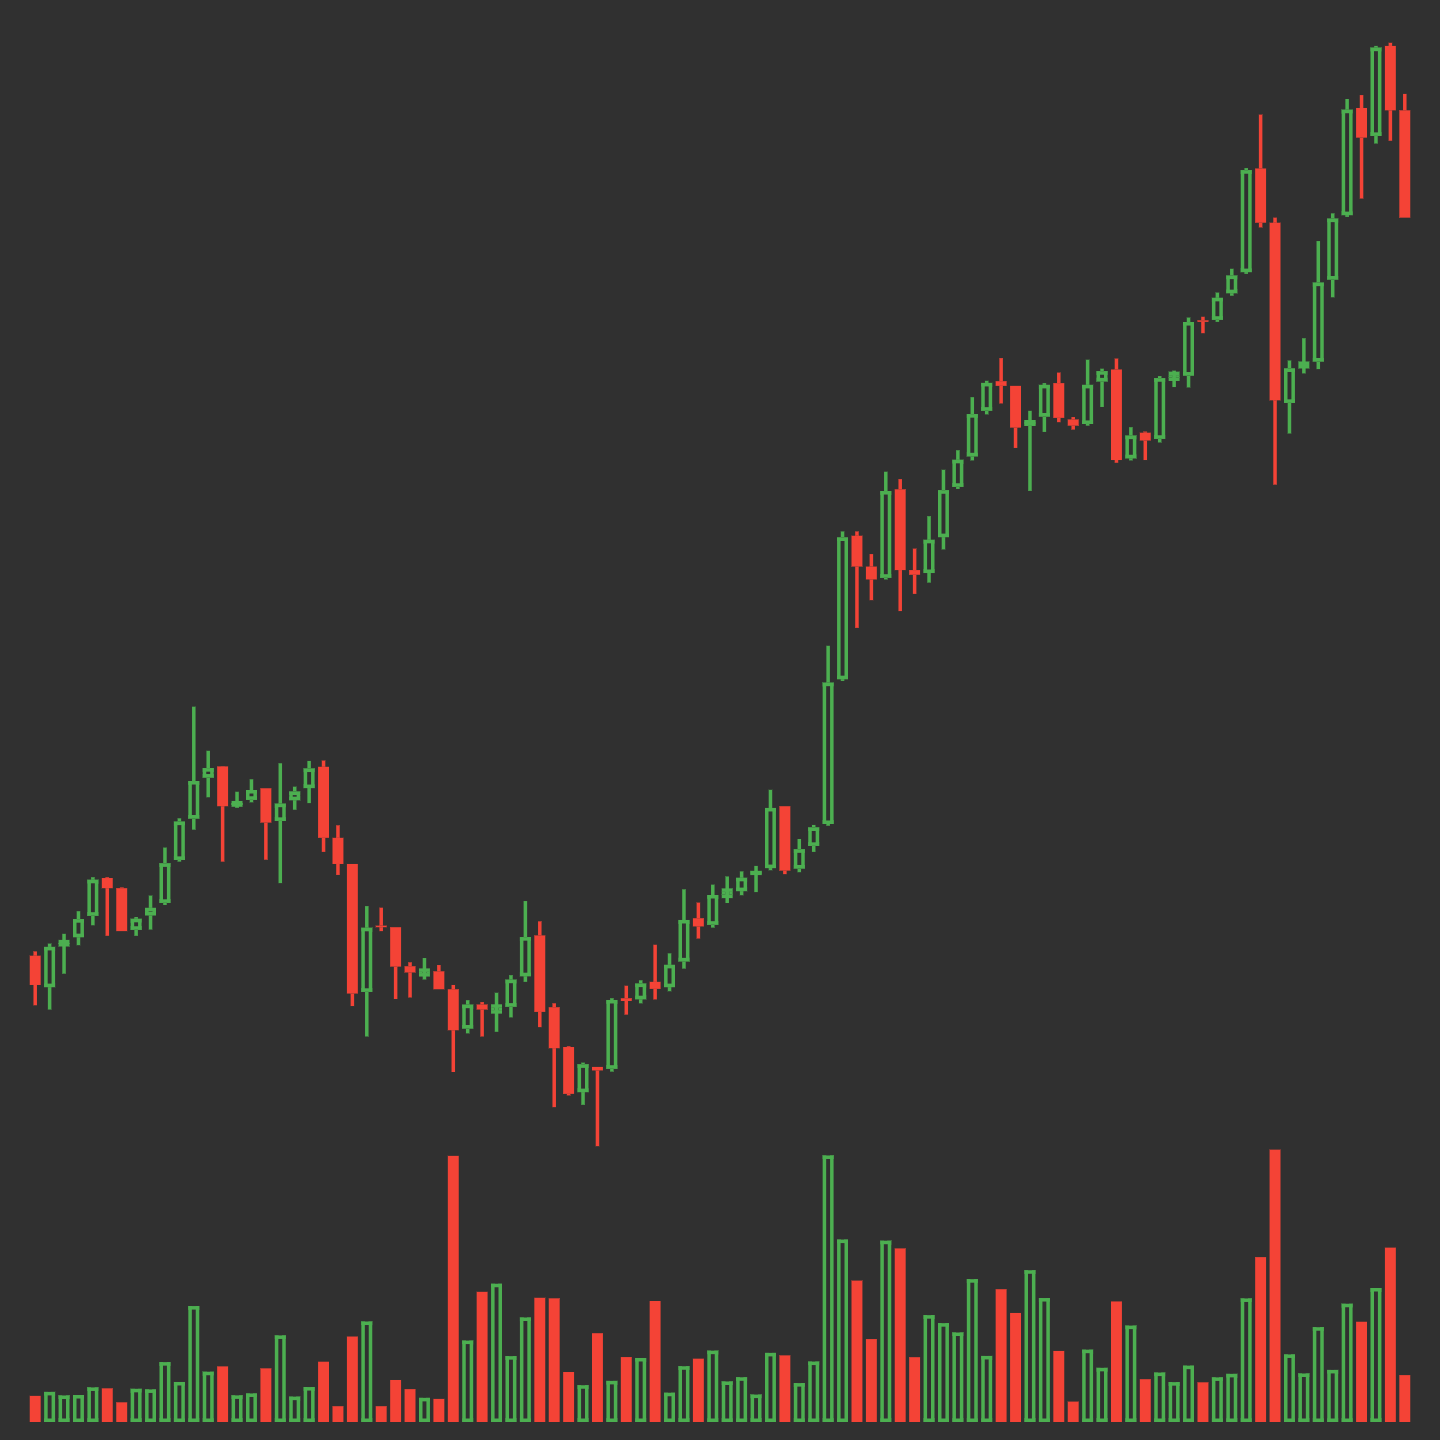
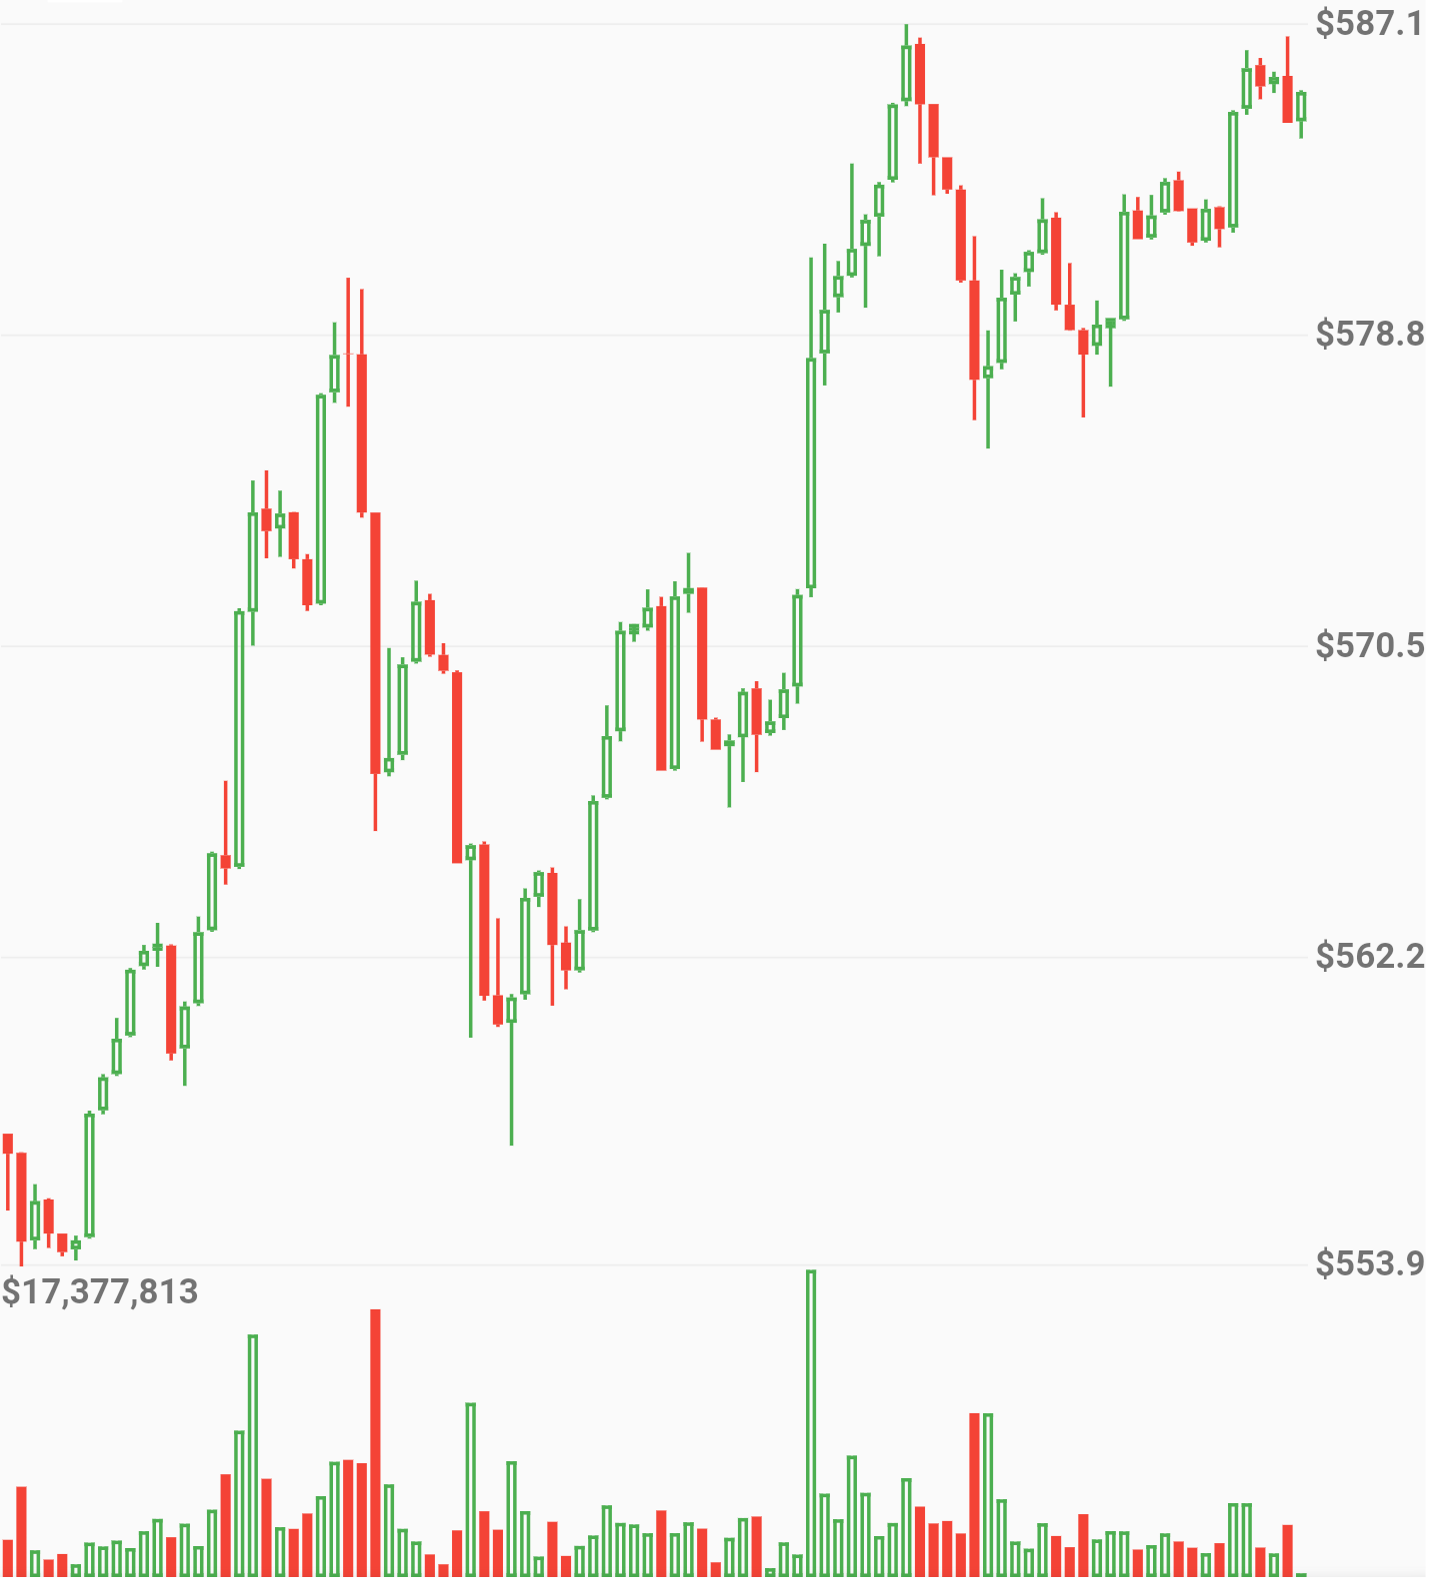
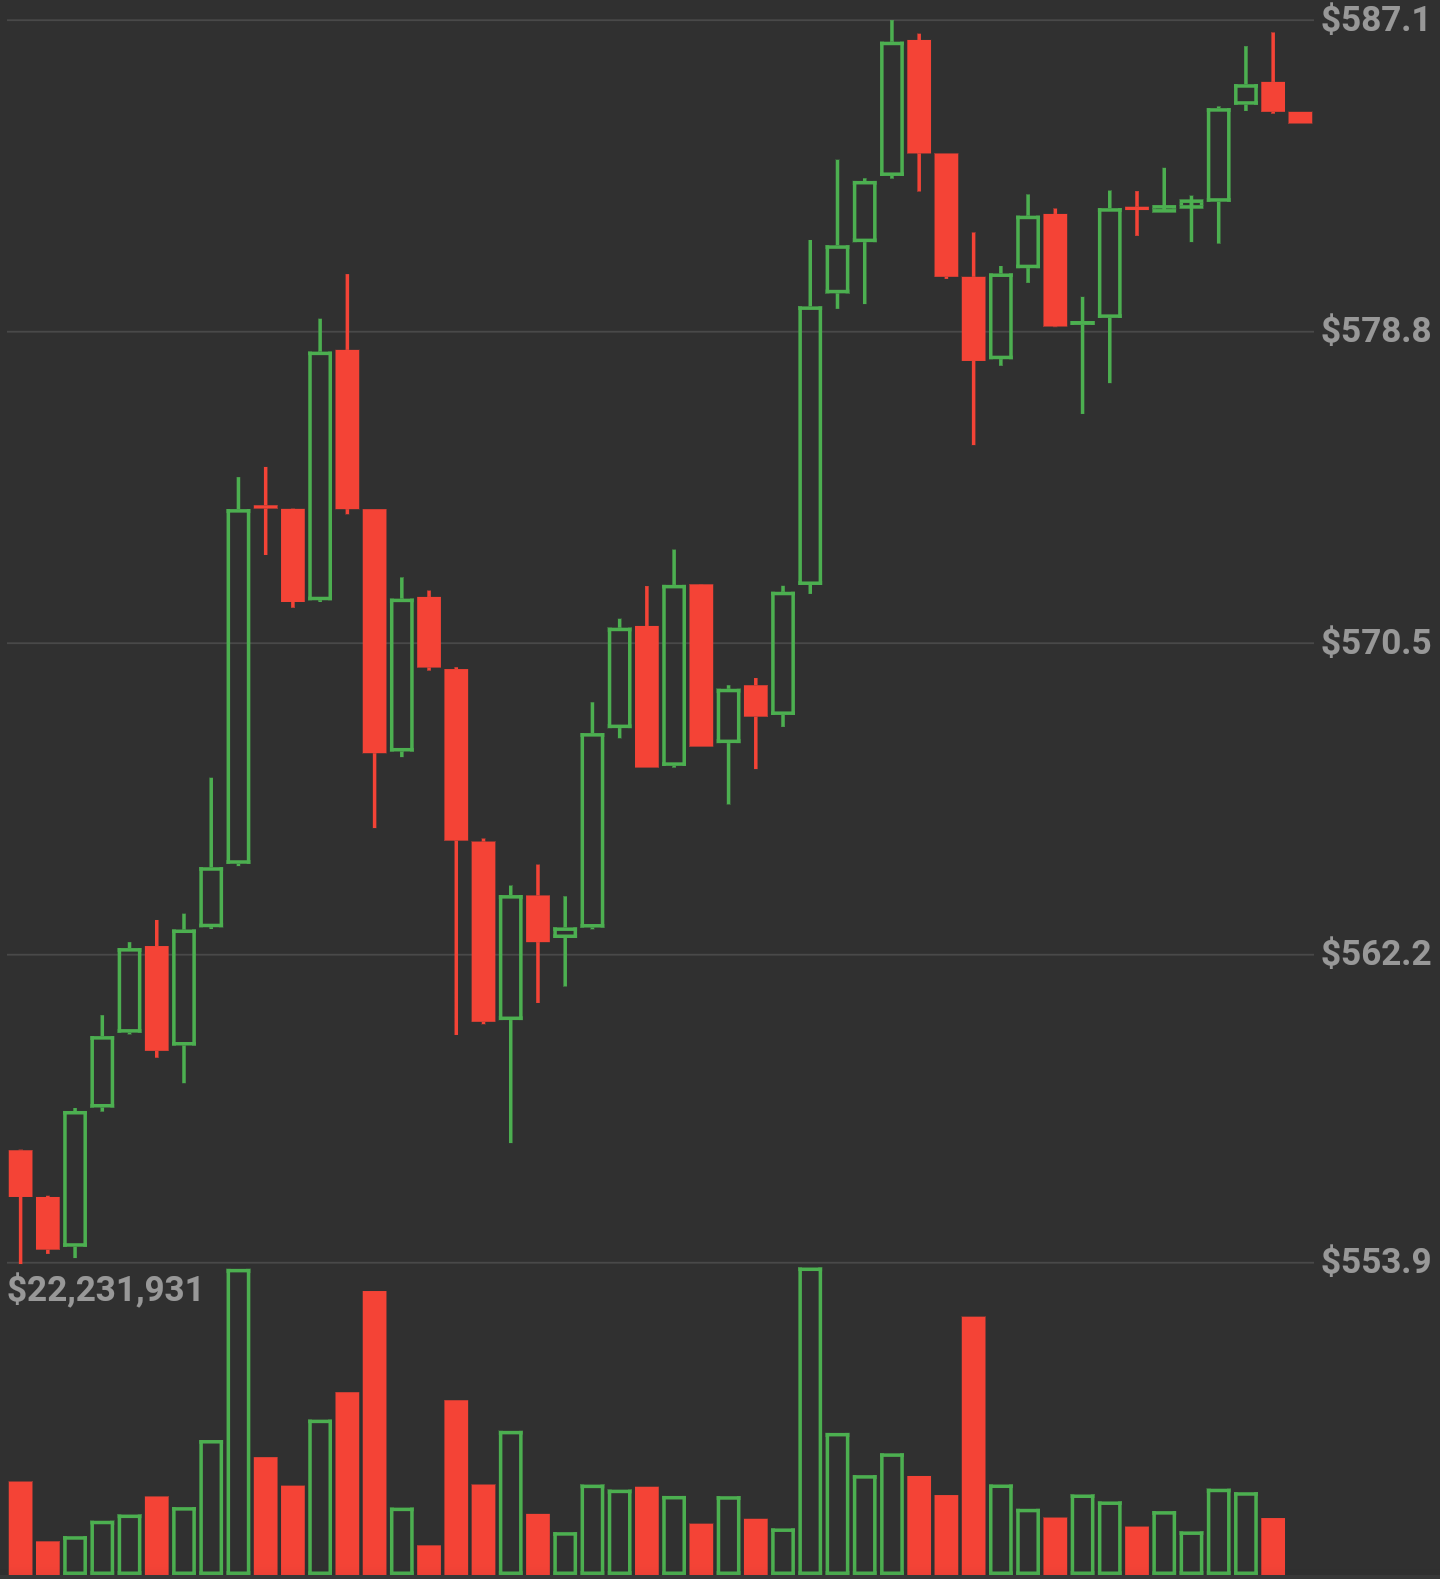
Elegant OHLC Candlestick and Trade Volume charts for Flutter
Install for Flutter with pub.
| Property | Description |
|---|---|
| data | Required. List of maps containing open, high, low, close and volumeto |
| enableGridLines | Required. Enable or disable grid lines |
| volumeProp | Required. Proportion of container to be given to volume bars |
| lineWidth | Default 1.0. Width of most lines |
| gridLineAmount | Default 5. Number of grid lines to draw. Labels automatically assigned |
| gridLineWidth | Default 0.5. Width of grid lines |
| gridLineColor | Default Colors.grey. Color of grid lines |
| gridLineLabelColor | Default Colors.grey. Color of grid line labels |
| labelPrefix | Default "$". Prefix before grid line labels. |
| increaseColor | Default Colors.green. Color of increasing candles. |
| decreaseColor | Default Colors.red. Color of decreasing candles. |
new OHLCVGraph(
    data: sampleData,
    enableGridLines: false,
    volumeProp: 0.2
    )
)
Candle size dynamically changes by amount of data
new OHLCVGraph(
    data: sampleData,
    enableGridLines: true,
    volumeProp: 0.2,
    gridLineAmount: 5,
    gridLineColor: Colors.grey[300],
    gridLineLabelColor: Colors.grey
    )
)import 'package:flutter/material.dart';
import 'package:flutter_candlesticks/flutter_candlesticks.dart';
void main() {
List sampleData = [
{"open":50.0, "high":100.0, "low":40.0, "close":80, "volumeto":5000.0},
{"open":80.0, "high":90.0, "low":55.0, "close":65, "volumeto":4000.0},
{"open":65.0, "high":120.0, "low":60.0, "close":90, "volumeto":7000.0},
{"open":90.0, "high":95.0, "low":85.0, "close":80, "volumeto":2000.0},
{"open":80.0, "high":85.0, "low":40.0, "close":50, "volumeto":3000.0},
];
runApp(
new MaterialApp(
home: new Scaffold(
body: new Center(
child: new Container(
height: 500.0,
child: new OHLCVGraph(
data: sampleData,
enableGridLines: false,
volumeProp: 0.2
),
),
),
)
)
);
}
