-
Mac OS, or Linux machine (untested on windows)
-
A line_profiler fork is needed to run this extension.
pip install https://github.com/iddl/line_profiler/zipball/master
- Make sure you're using the right environment. This is done by modifying the 'Shell command' option in the settings.
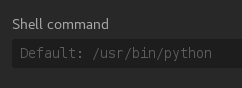
The default, /usr/bin/python, works for small tests.
However it might be the case you're using virtualenvs and/or running code from a virtual machine.
Example setting of running profiler from a virtual environment in a VM:
ssh, vagrant@192.168.34.10, -t, /home/user/project/venv/bin/python
- ALT+SHIFT+P to activate
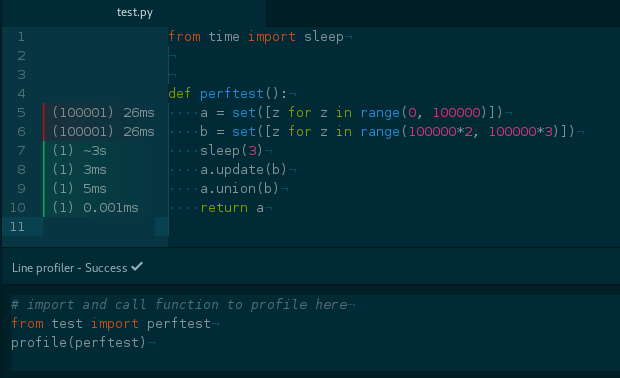
This will show an editor with a Run button.
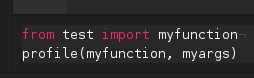
- Import the function to profile first. The profiler is executed from the parent directory of the profiled code (this doesn't matter if you choose a custom shell command).
Use the profile function to run a profile on your code.
The end product should look something like
- Stats will appear in the editor gutter