This is the documentation for HiView classic. Click here for DDRAM documenation
HiView (http://hiview.ucsd.edu/) is a web application for visualizing hierarchical structure and the data that supports this structure. Hierarchical structure is stored and represented by a data structure called an ontology.
Users can upload their own ontologies using the ddot Python package (source code and tutorial) and then view them on HiView.
- 12/4/2018 - v1.5 release
- 6/11/2018 - v1 in beta
- 9/20/2017 - Updated for new version
(TBD)
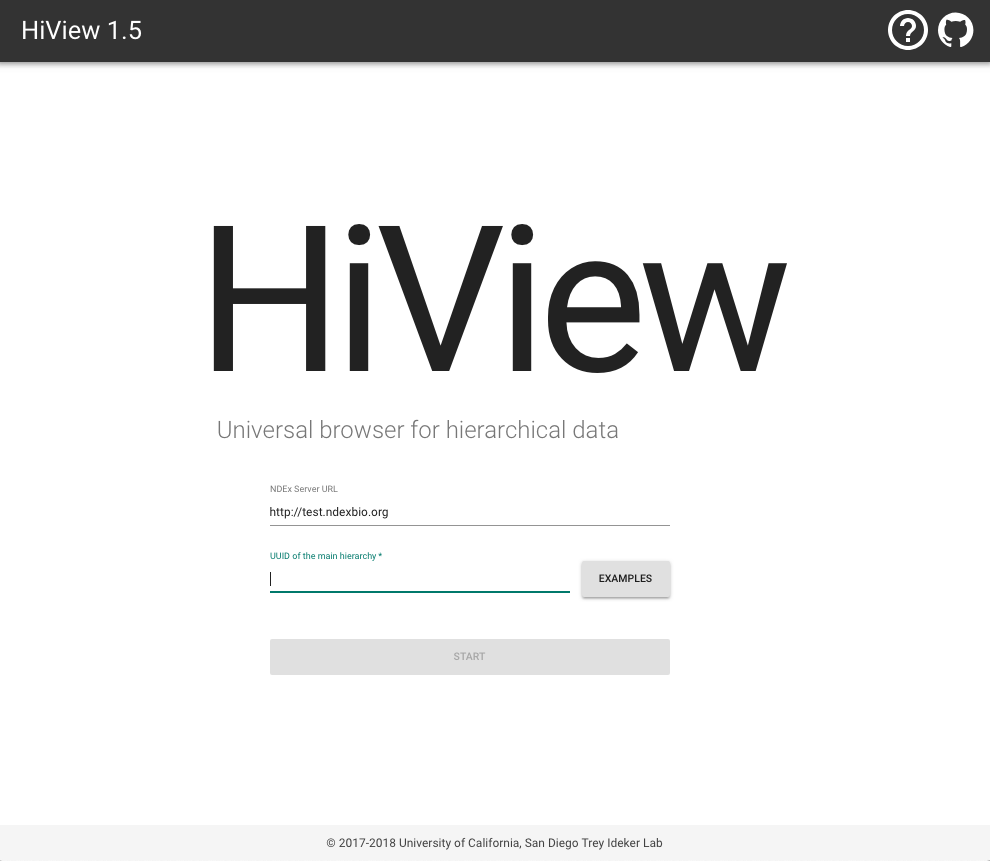
Go to http://hiview.ucsd.edu, and click the EXAMPLES button to select a pre-computed ontology. Press START, and you will be taken to a visualization of that ontology.
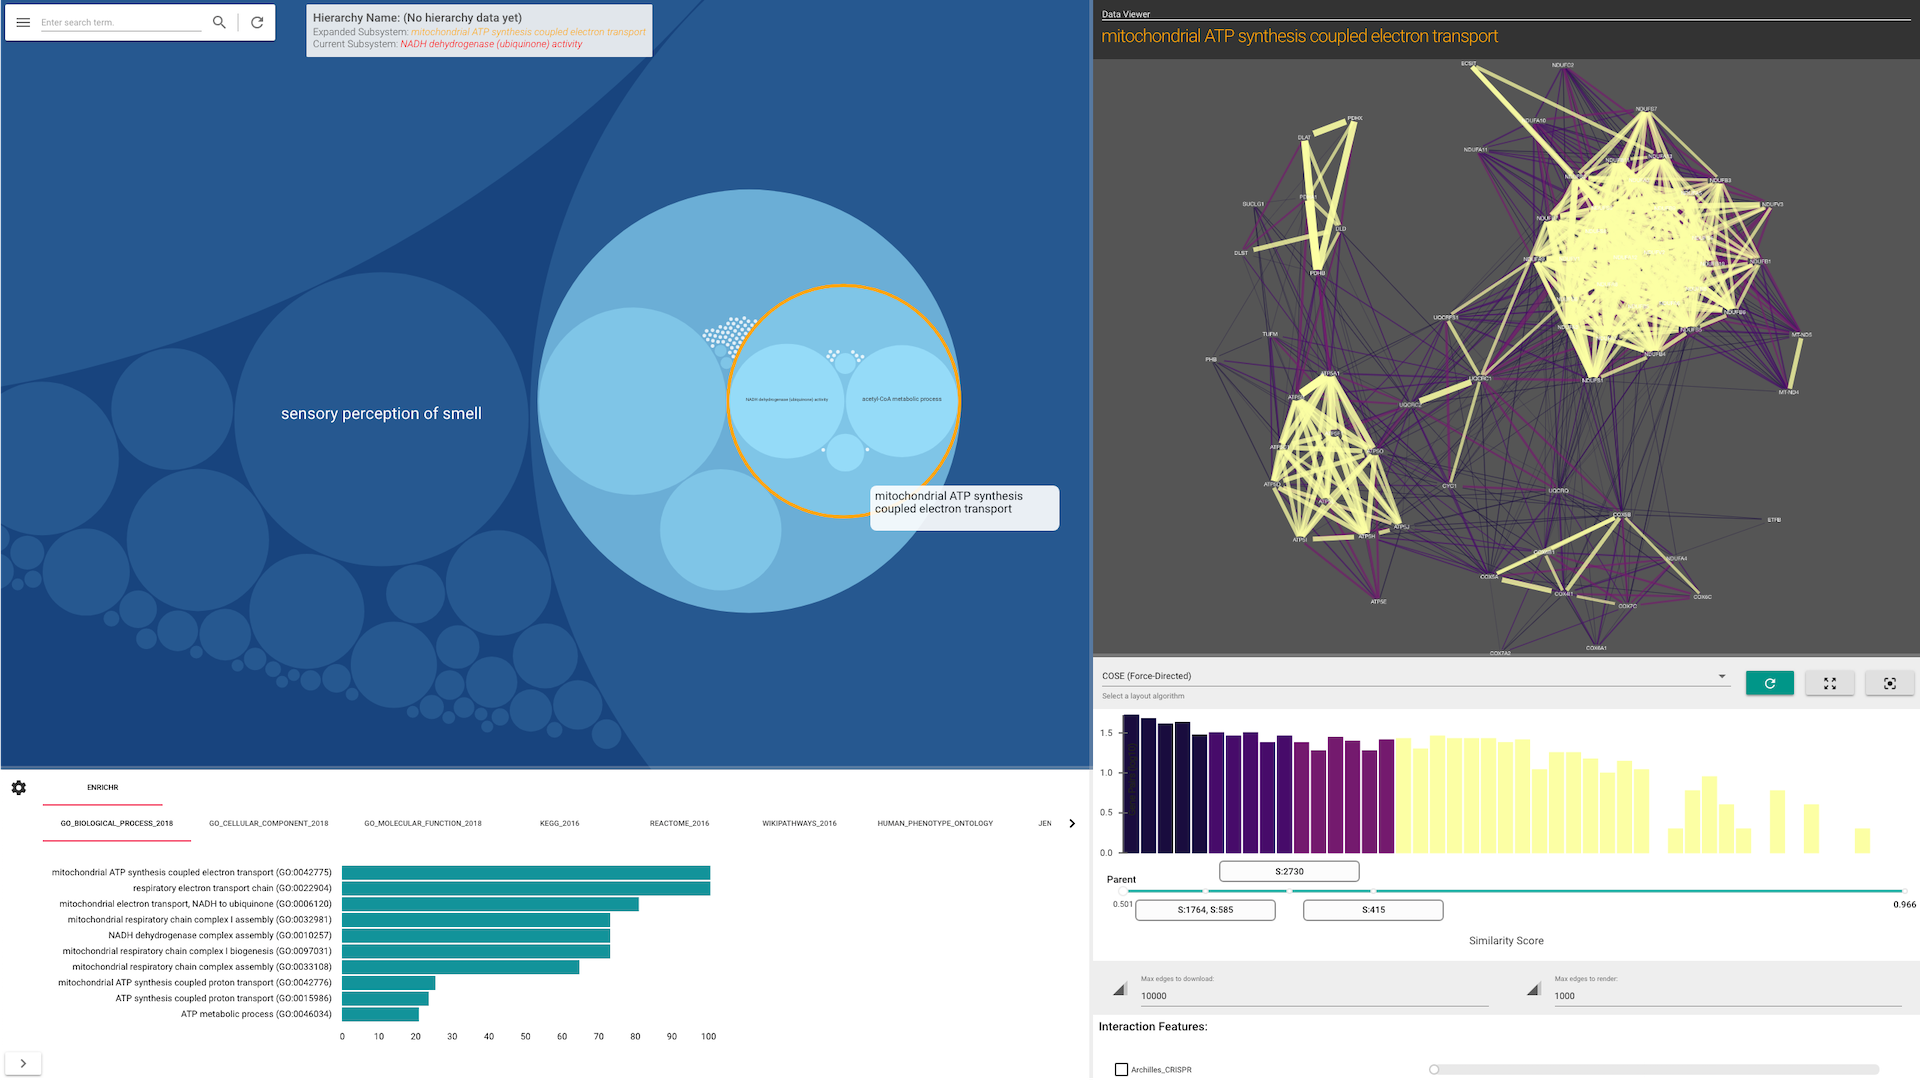
HiView's visualization is separated into two panels (see screenshots below):
-
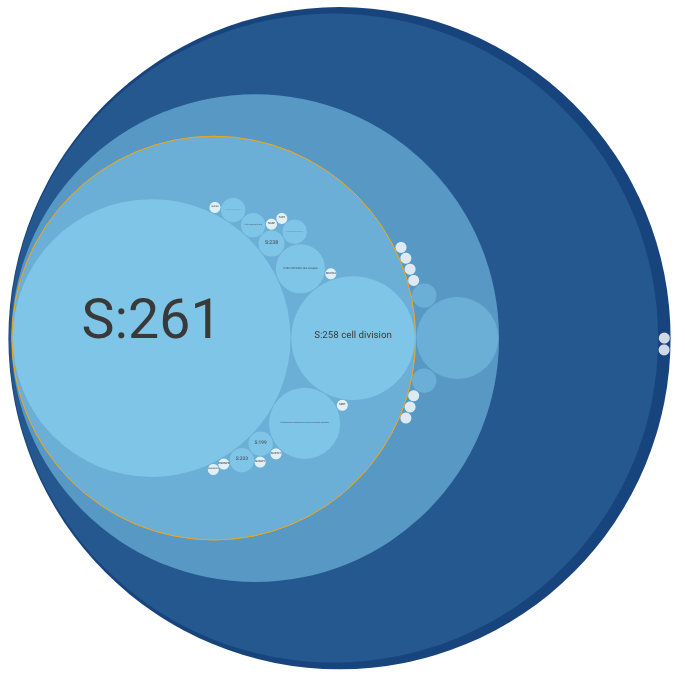
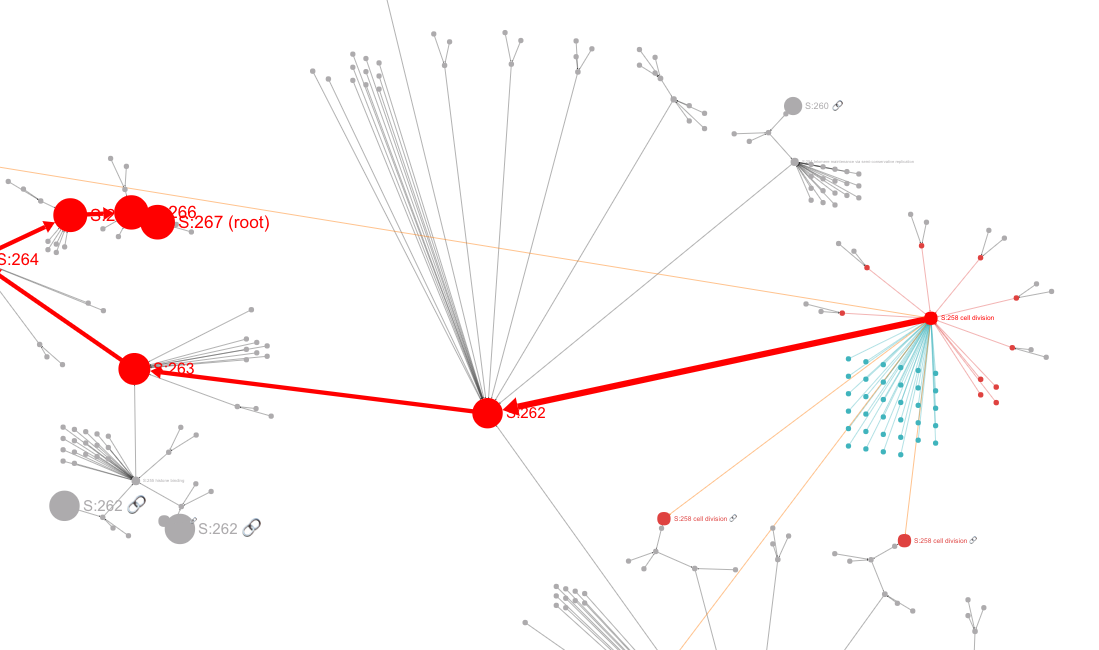
The Main Panel shows the ontology's hierarchical structure. This panel shows either a "circle-packing" diagram (the default) or a node-link diagram. The diagram that is shown can be switched in the Control Panel (see below).
-
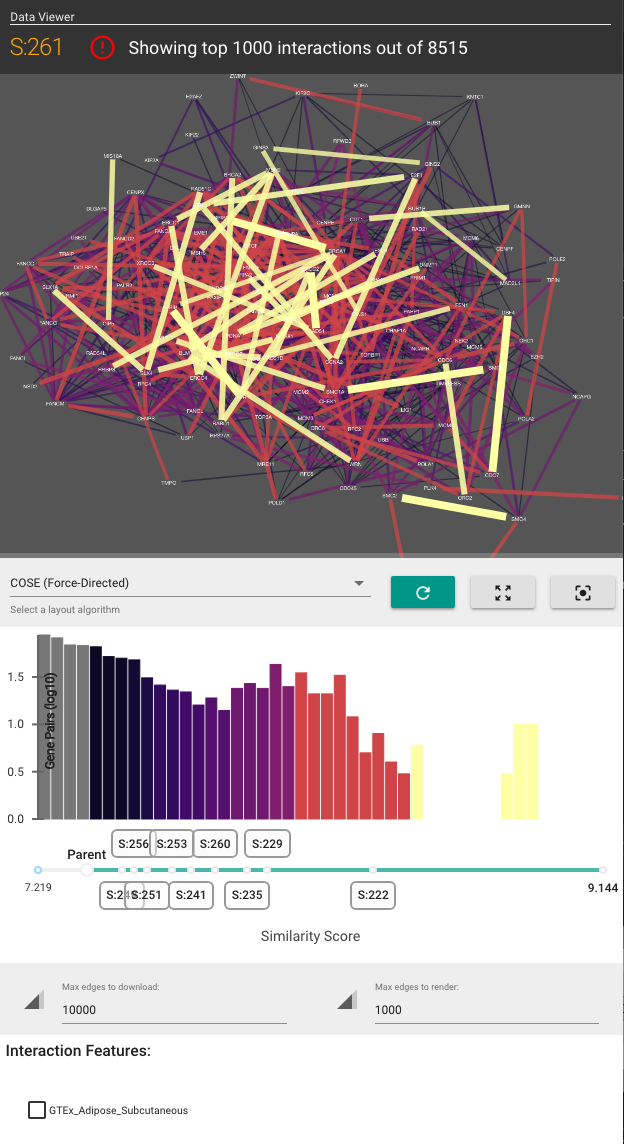
The Side Panel shows the data that supports the hierarchical structure. To activate this panel, double-click on any subsystem node in the Main Panel.
In a circle-packing diagram, hierarchical relations are intuitively represented by drawing small circles nested within larger ones (like physical compartments of the cell).
In a node-link diagram, hierarchical relations are represented by directed edges and drawn compactly with a 2D layout algorithm.
The Side Panel allows you to visualize how data (in the form of gene-gene interaction networks) support the existence of each subsystem and their hierarchical organization. The Side Panel contains several visual components:
- A gene-gene functional similarity network, consisting of genes in the selected subsytem
- A histogram of the gene similarities
- Checkboxes to toggle the visualization of other gene interaction types
- A list of other attributes about the selected subsystem.
To open the Control Panel, double-click on the "hamburger" button at the top-left of the screen (i.e., the icon with three horizontal lines). The Control Panel allows the following configurations:
- Switching between the circle-packing (the default diagram) and the node-link diagram.
- Configuring the color of circles in the circle-packing diagram.
- Configuring node size, label size, and edge thickness in the node-link diagram.
- Enabling gene set enrichment analysis.
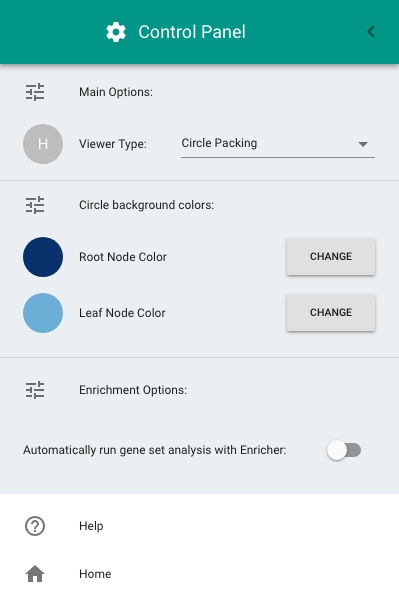
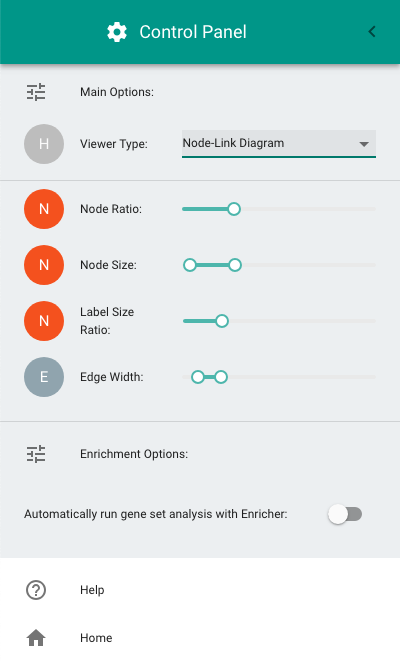
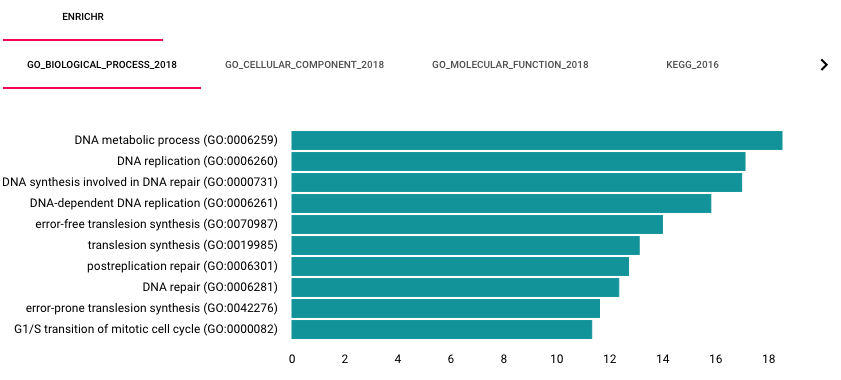
When a user selects a subsystem, HiView can automatically perform gene set enrichment analysis using the Enrichr web service. By default, this option is turned off. To enable this option, turn on the Automatically run gene set analysis with Enricher function in the Control Panel. Enrichment results are displayed on a separate bottom panel.
HiView is implemented using React
- Checkout this repository
- Clone CyViewer module
- yarn install
- yarn link
- In the frontend directory, run
yarn link cy-viewer yarn start
- UX Design
- Architecture Design
- Support for small to medium size data
- Public data only
- Automatic enrichment analysis
- Large data support
- e.g., human dataset
- Private data support (for NDEx)
(TBD)
© 2017 - 2018 UC, San Diego Trey Ideker Lab
HiView Application is designed and implemented by Keiichiro Ono (kono ucsd edu).
Data-Driven Ontology Toolkit (DDOT) is developed by Mike Yu