Tracking and analyzing bird scooter locations across Tel Aviv
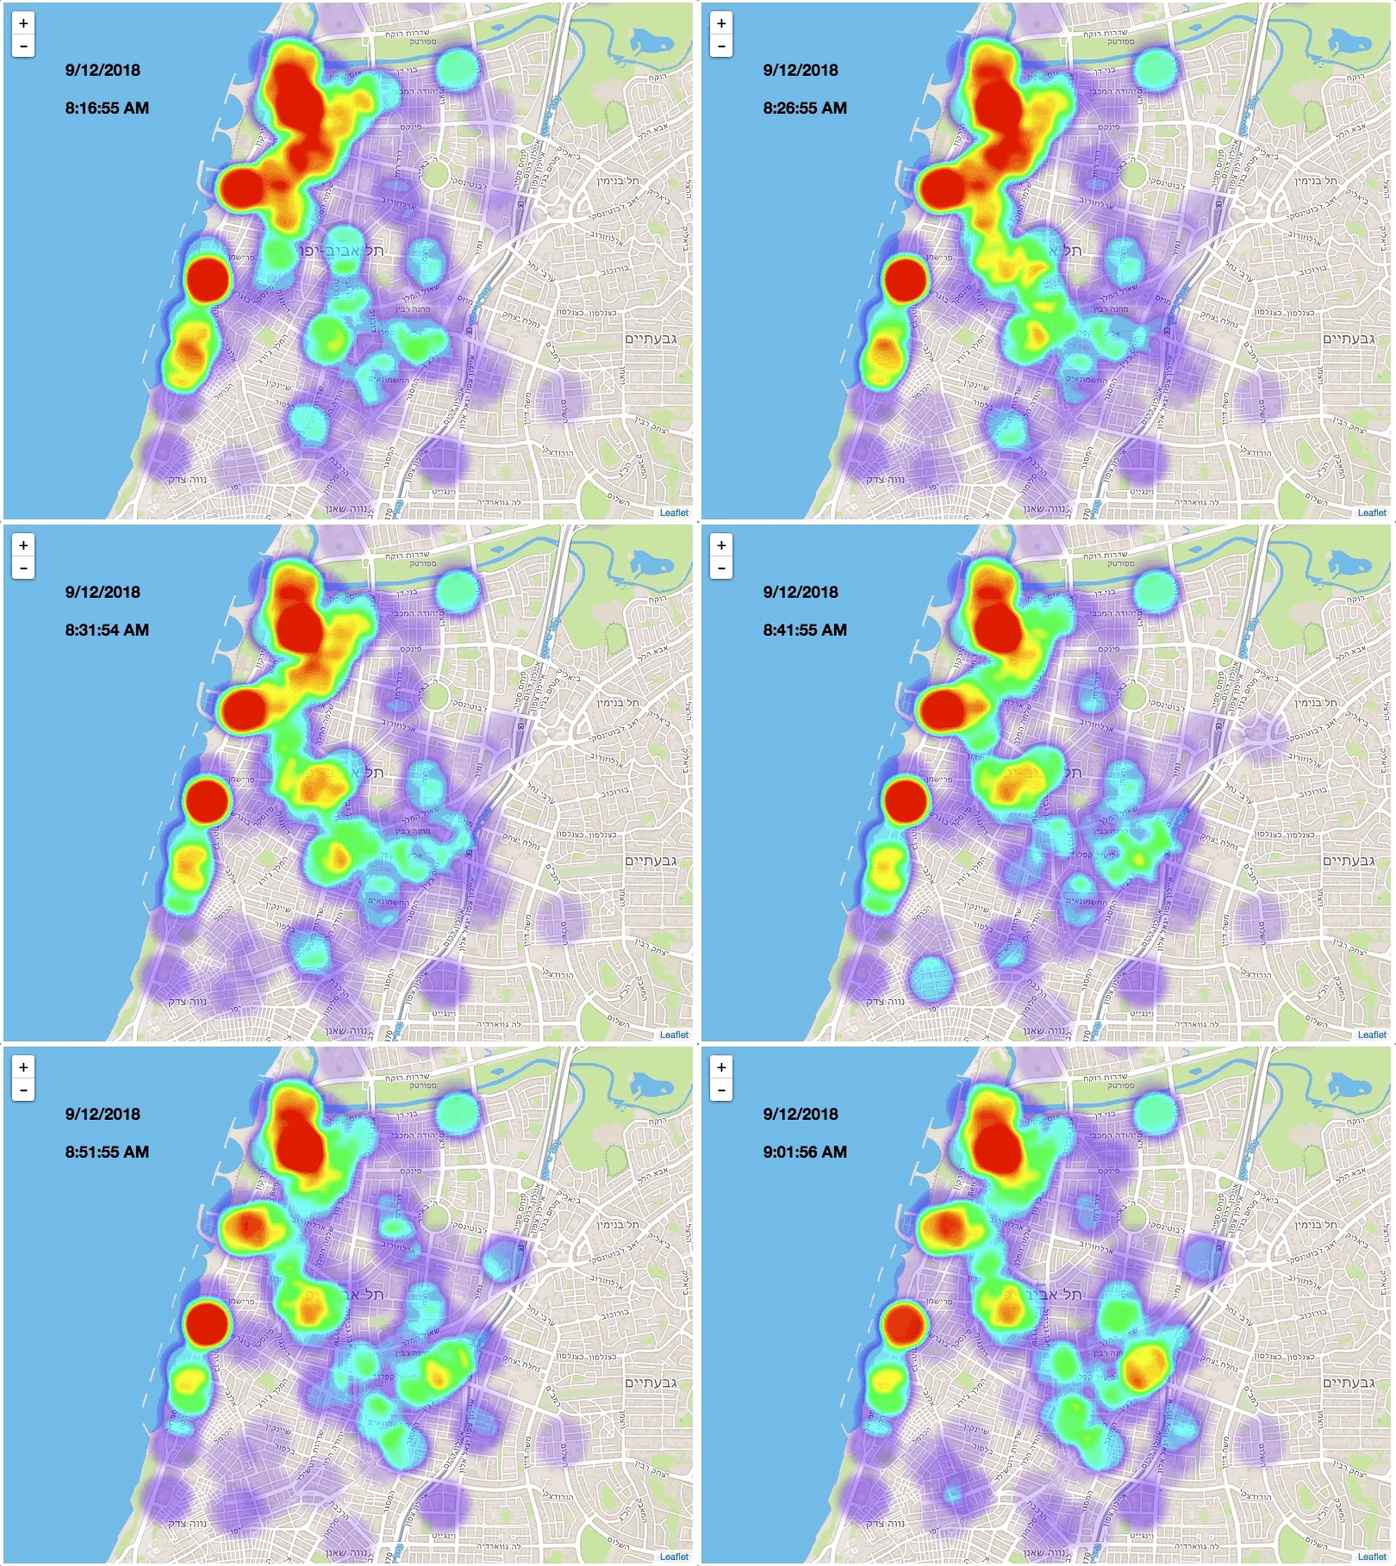
- Heatmap visualization of bird locations during a given day.
- Analyze bird usage durations and patterns.
- Add a date picker to the heatmap demo.
- Predict the chances of finding a bird at a given time and location.
One day of TLV Birds location heatmap - demo

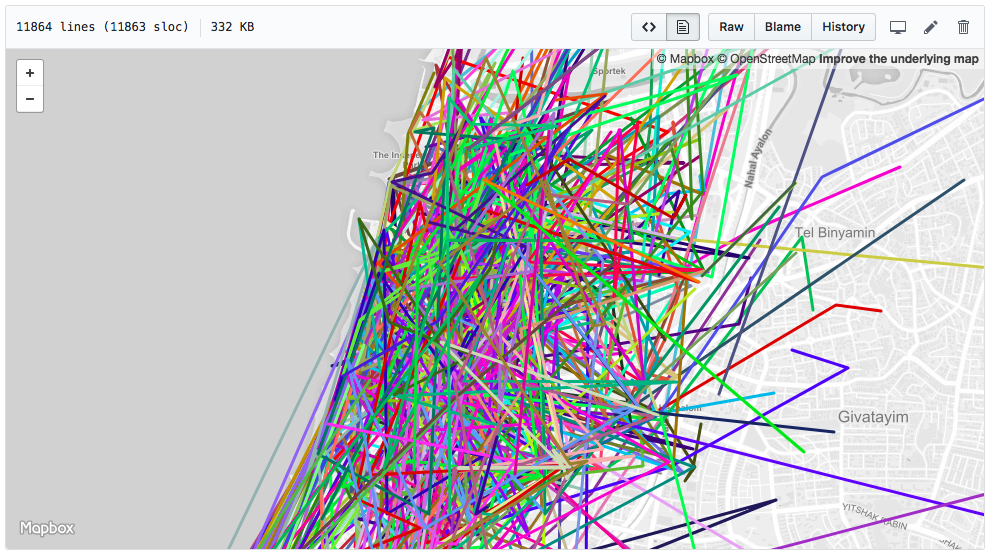
Full timeline GeoJson - link

Key concepts
- Data is collected from publicly available sources. There are already several websites tracking birds locations around the world.
- If you want to track the birds yourself, see my example for using the
bird/nearbyAPI (which is basically the same as refreshing the app and registering locations every 5 minutes). - The collected data is somewhat noisy. Inconsistent GPS signals and maintenance operations might look like bird rides. The data is cleaned by using a few heuristics:
- Minimal bird ride is at least 100 meters long.
- No ride is shorter than 1 minute.
- Rides consume at least 1% of battery power.
Usefull commands
Copy data from s3 - aws s3 cp s3://birds-locations/${date} ./data/${date} --recursive
Generate heatmap data - node heatmap.js ./data/${date} > heatmap_demo/heatmap_data.js
Analyze bird daily usage - node ride-stats.js ./data/${date}
Daily usage report as CSV - node ride-stats.js ./data/ csv
Generate GeoJSON of bird movment - node geojson.js ./data/${date}/ ${birdCode} > test.geojson