Welcome to the Microsoft Fabric end-to-end Real-time Analytics workshop!
In this workshop, we'll start by rapidly generating real-time data and understanding how that data can be processed and visualized in Microsoft Fabric. With the initial reporting in place, multiple modules are available that explore data warehousing, data lakehouse architecture, data activator, data science, and of course, real-time analytics. The modules are designed to be cohesive but flexible -- they all involve the same core scenario, but have limited dependencies so you can consume the modules that make the most sense for you.
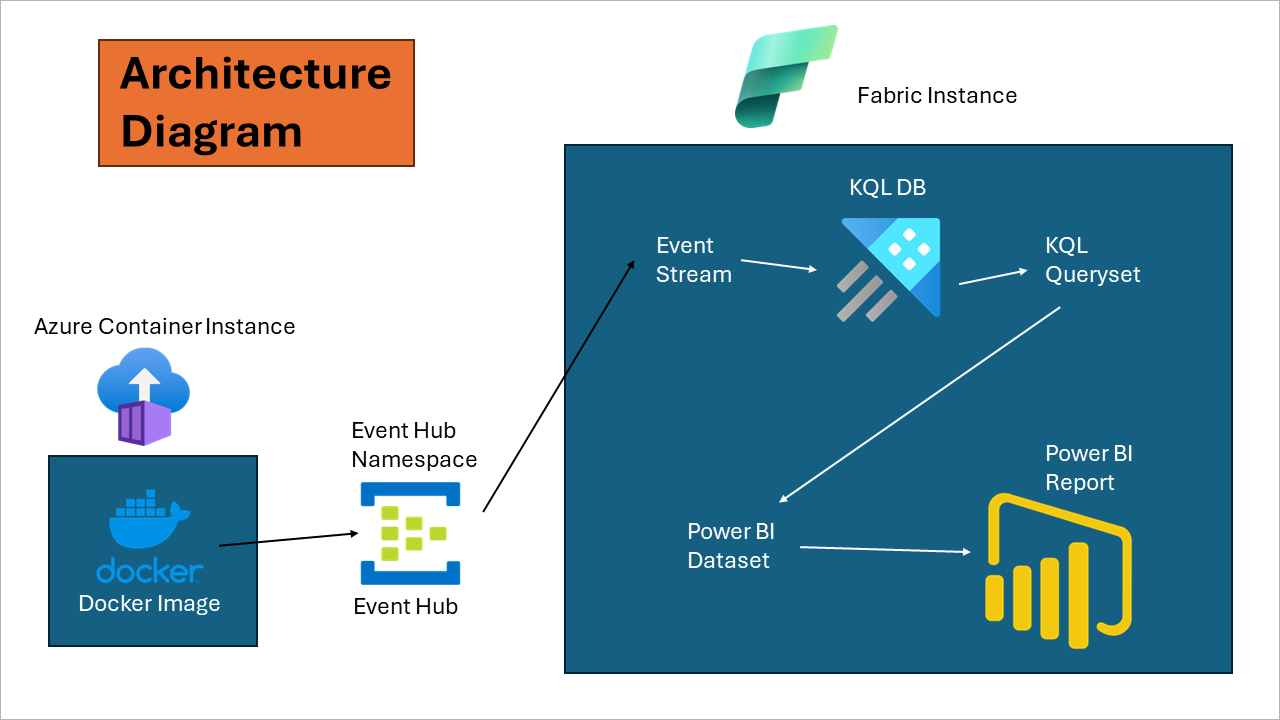
The basic architecture of our solution is illustrated below. The app deployed in the beginning of this workshop (either as a docker container or running in Jupyter notebook) will publish events to our Fabric environment. The data is ingested into a KQL database for real-time reporting in Power BI.
In this workshop, participants will get hands-on with a ficticious financial company "AbboCost." AbboCost would like to set up a stock monitoring platform to monitor price fluctuations and report on historical data. Throughout the workshop, we'll look at how every aspect of Microsoft Fabric can be incorporated as part of a larger solution -- by having everything in an integrated solution, we'll be able to quickly and securely integrate data, build reports, create data warehouses and lakehouses, forecast using ML models, and more.
- An Azure account with an active subscription.
- If you are working through this content as part of a proctored workshop, your proctor may be able to provide you with an Azure Pass or other lab environment.
- If you are a Visual Studio subscriber, you may leverage this benefit to host the data in your account.
- If you don't have access to an Azure subscription, you may be able to sign up for a free account.
- You must have the necessary privileges within your Azure subscription to create resources, create Microsoft Fabric capacity, register resource providers (if required), etc. Note that some organizational accounts may have administrative restrictions on Power BI features, which may limit functionality.
Core Modules for real-time analytics:
Additional modules for end-to-end solution:
- Data Activator
- Data Warehousing: Synapse Data Warehouse and Data Pipelines
- Data Lakehouse: Fabric Lakehouse, Notebooks, and Data Wrangler
- Data Science: Using the Lakehouse and Notebooks to Forecast
Continued Learning & Additional Modules
Extras: Additional Content and Continued Learning
- Ex-01: Advanced KQL
- Ex-02: Additional Real-time Dashboard
- Ex-03: Predicted vs Actual Reporting
- Ex-04: Generate Custom Historical Data
- Ex-05: Delta File Maintenance
Names for the stocks and scenario were inspired by the iconic skit "Who's on First?" by Abbott and Costello. View this skit here: Who's on First by Abbott and Costello (6:35)
