promdump dumps the head and persistent blocks of Prometheus. It supports filtering the persistent blocks by time range.
When debugging Kubernetes clusters, I often find it helpful to get access to the in-cluster Prometheus metrics. Since it is unlikely that the users will grant me direct access to their Prometheus instance, I have to ask them to export the data. To reduce the amount of back-and-forth with the users (due to missing metrics, incorrect labels etc.), it makes sense to ask the users to "get me everything around the time of the incident".
The most common way to achieve this is to use commands like kubectl exec and
kubectl cp to compress and dump Prometheus' entire data directory. On
non-trivial clusters, the resulting compressed file can be very large. To
import the data into a local test instance, I will need at least the same amount
of disk space.
promdump is a tool that can be used to dump Prometheus data blocks. It is
different from the promtool tsdb dump command in such a way that its output
can be re-used in another Prometheus instance. See this
issue for a discussion
on the limitation on the output of promtool tsdb dump. And unlike the
Promethues TSDB snapshot API, promdump doesn't require Prometheus to be
started with the --web.enable-admin-api option. Instead of dumping the entire
TSDB, promdump offers the flexibility to filter persistent blocks by time range.
The promdump kubectl plugin uploads the compressed, embeded promdump to the
targeted Prometheus container, via the pod's exec subresource.
Within the Prometheus container, promdump queries the Prometheus TSDB using the
tsdb package. It
reads and streams the WAL files, head block and persistent blocks to stdout,
which can be redirected to a file on your local file system. To regulate the
size of the dump, persistent blocks can be filtered by time range.
⭐ promdump performs read-only operations on the TSDB.
When the data dump is completed, the promdump binary will be automatically deleted from your Prometheus container.
The restore subcommand can then be used to copy this dump file to another
Prometheus container. When this container is restarted, it will reconstruct its
in-memory index and chunks using the restored on-disk memory-mapped chunks and
WAL.
The --debug option can be used to output more verbose logs for each command.
Install promdump as a kubectl plugin:
kubectl krew update

kubectl krew install promdump

kubectl promdump --version
For demonstration purposes, use kind to create two K8s clusters:
for i in {0..1}; do \
  kind create cluster --name dev-0$i ;\
done
Install Prometheus on both clusters using the community Helm chart:
for i in {0..1}; do \
  helm --kube-context=kind-dev-0$i install prometheus prometheus-community/prometheus ;\
done
Deploy a custom controller to cluster dev-00. This controller is annotated for
metrics scraping:
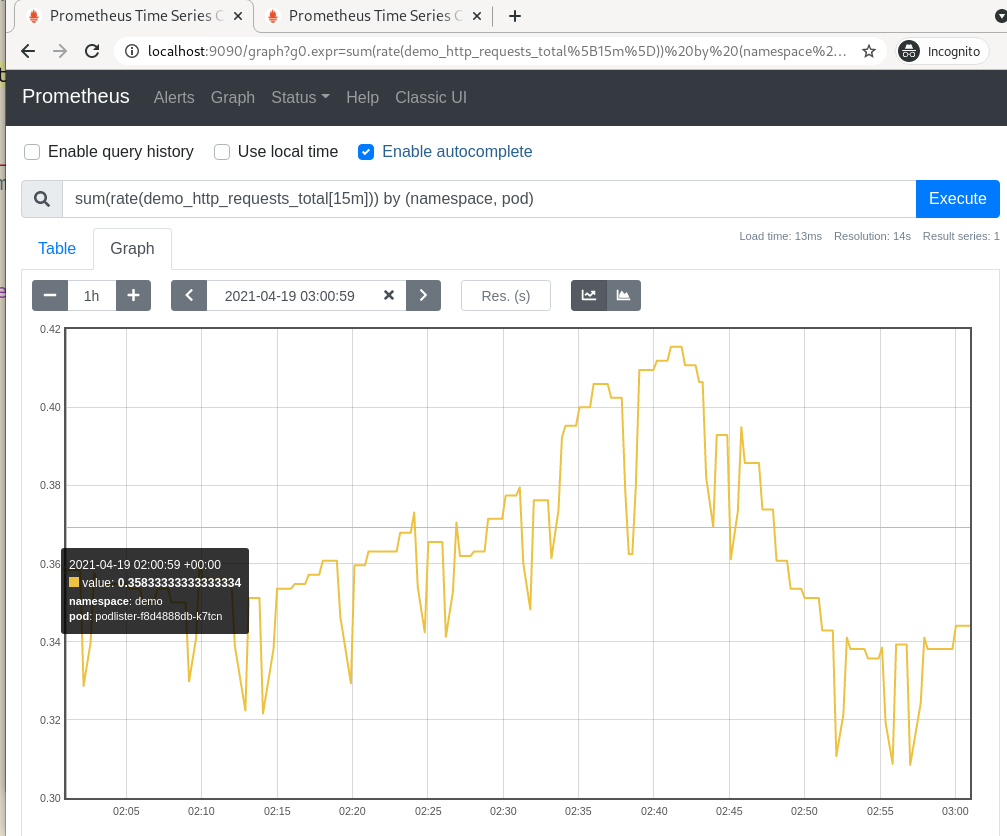
kubectl --context=kind-dev-00 apply -f https://raw.githubusercontent.com/ihcsim/controllers/master/podlister/deployment.yamlPort-forward to the Prometheus pod to find the custom demo_http_requests_total
metric.
📝 Later, we will use promdump to copy the samples of this metric over to the
dev-01 cluster.
CONTEXT="kind-dev-00"
POD_NAME=$(kubectl --context "${CONTEXT}" get pods --namespace default -l "app=prometheus,component=server" -o jsonpath="{.items[0].metadata.name}")
kubectl --context="${CONTEXT}" port-forward "${POD_NAME}" 9090
📝 In subsequent commands, the -c and -d options can be used to change
the container name and data directoy.
Dump the data from the first cluster:
# check the tsdb metadata.
# if it's reported that there are no persistent blocks yet, then no data dump
# will be captured, until Prometheus persists the data.
kubectl promdump meta --context=$CONTEXT -p $POD_NAME
Head Block Metadata
------------------------
Minimum time (UTC): | 2021-04-18 18:00:03
Maximum time (UTC): | 2021-04-18 20:34:48
Number of series    | 18453

Persistent Blocks Metadata
----------------------------
Minimum time (UTC):     | 2021-04-15 03:19:10
Maximum time (UTC):     | 2021-04-18 18:00:00
Total number of blocks  | 9
Total number of samples | 92561234
Total number of series  | 181304
Total size              | 139272005

# capture the data dump
TARFILE="dump-`date +%s`.tar.gz"
kubectl promdump \
  --context "${CONTEXT}" \
  -p "${POD_NAME}" \
  --min-time "2021-04-15 03:19:10" \
  --max-time "2021-04-18 20:34:48"  > "${TARFILE}"

# view the content of the tar file. expect to see the 'chunk_heads', 'wal' and
# persistent blocks directories.
$ tar -tf "${TARFILE}"
Restore the data dump to the Prometheus pod on the dev-01 cluster, where we
don't have the custom controller:
CONTEXT="kind-dev-01"
POD_NAME=$(kubectl --context "${CONTEXT}" get pods --namespace default -l "app=prometheus,component=server" -o jsonpath="{.items[0].metadata.name}")

# check the tsdb metadata
kubectl promdump meta --context "${CONTEXT}" -p "${POD_NAME}"
Head Block Metadata
------------------------
Minimum time (UTC): | 2021-04-18 20:39:21
Maximum time (UTC): | 2021-04-18 20:47:30
Number of series    | 20390

No persistent blocks found

# restore the data dump found at ${TARFILE}
kubectl promdump restore \
  --context="${CONTEXT}" \
  -p "${POD_NAME}" \
  -t "${TARFILE}"

# check the metadata again. it should match that of the dev-00 cluster
kubectl promdump meta --context "${CONTEXT}" -p "${POD_NAME}"
Head Block Metadata
------------------------
Minimum time (UTC): | 2021-04-18 18:00:03
Maximum time (UTC): | 2021-04-18 20:35:48
Number of series    | 18453

Persistent Blocks Metadata
----------------------------
Minimum time (UTC):     | 2021-04-15 03:19:10
Maximum time (UTC):     | 2021-04-18 18:00:00
Total number of blocks  | 9
Total number of samples | 92561234
Total number of series  | 181304
Total size              | 139272005

# confirm that the WAL, head and persistent blocks are copied to the targeted
# Prometheus server
kubectl --context="${CONTEXT}" exec "${POD_NAME}" -c prometheus-server -- ls -al /data
Restart the Prometheus pod:
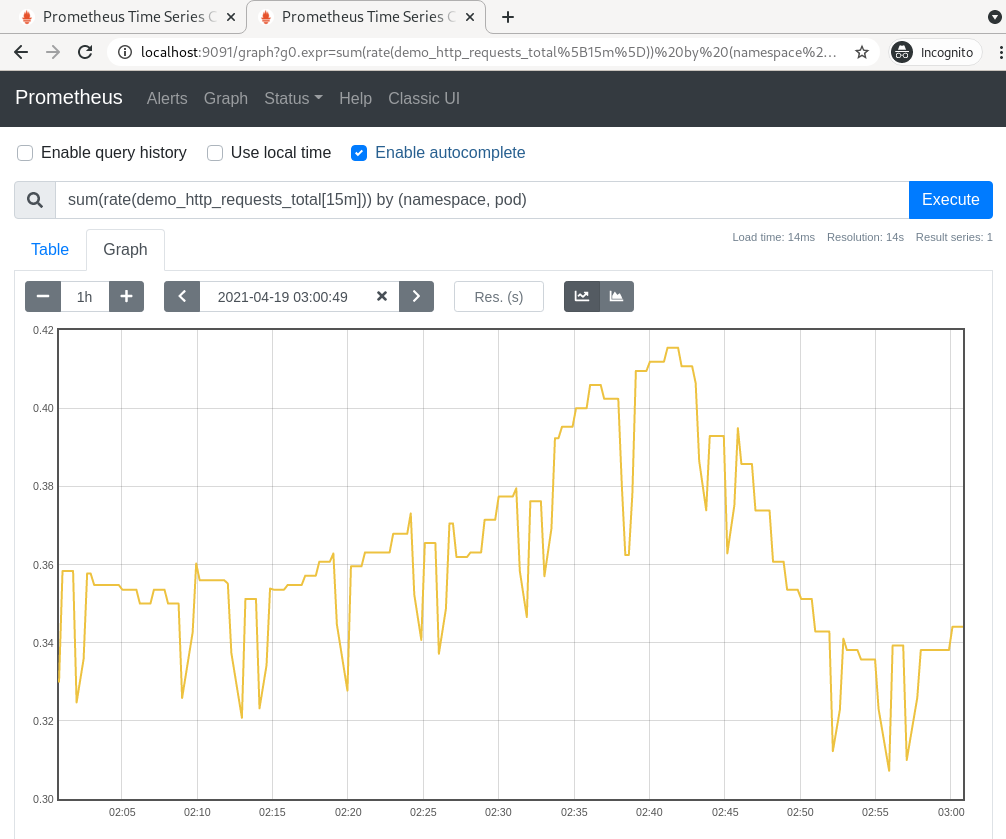
kubectl --context="${CONTEXT}" delete po "${POD_NAME}"Port-forward to the pod to confirm that the samples of
the demo_http_requests_total metric have been copied over:
kubectl --context="${CONTEXT}" port-forward "${POD_NAME}" 9091:9090Make sure that time frame of your query matches that of the restored data.
Q: The promdump meta subcommand shows that the time range of the restored
persistent data blocks is different from the ones I specified.
A: There isn't a way to fetch partial data blocks from the TSDB. If the time range you specified spans across multiple data blocks, then all of them need to be retrieved. The amount of excessive data retrieved is dependent on the span of the data blocks.
The time range reported by the promdump meta subcommand should cover the one
you specified.
Q: I am not seeing the restored data
A: There are a few things you can check:
- When generating the dump, make sure the start and end date times are specified in the UTC time zone.
- If using the Prometheus console, make sure the time filter falls within the
time range of your data dump. You can confirm your restored data time range
using the
promdump metasubcommand. - Compare the TSDB metadata of the target Prometheus with the source Prometheus
to see if their time range match, using the
promdump metasubcommand. The head block metadata may deviate slightly depending on how old your data dump is. - Use the
kubectl execcommand to run commands likesls -al <data_dir>andcat <data_dir>/<data_block>/meta.jsonto confirm the data range of a particular data block. - Try restarting the target Prometheus pod after the restoration to let Prometheus replay the restored WALs. The restored data must be persisted to survive a restart.
- Check Prometheus logs to see if there are any errors due to corrupted data blocks, and report any issues.
- Run the
promdump restoresubcommand with the--debugflag to see if it provides more hints.
Q: The promdump meta and promdump restore subcommands are failing with this
error:
found unsequential head chunk filesA: This happens when there are out-of-sequence files in the chunk_heads folder
of the source Prometheus instance.
The promdump command can still be used to generate the dump .tar.gz file
because it doesn't parse the folder content, using the tsdb API. It simply
adds the the entire chunk_heads folder to the dump .tar.gz file.
E.g, a dump file with 2 out-of-sequence head files may look like this:
$ tar -tf dump.tar.gz
./
./chunks_head/
./chunks_head/000027 # out-of-sequence
./chunks_head/000029 # out-of-sequence
./chunks_head/000033
./chunks_head/000034
./01F5ETH5T4MKTXJ1PEHQ71758P/
./01F5ETH5T4MKTXJ1PEHQ71758P/index
./01F5ETH5T4MKTXJ1PEHQ71758P/chunks/
./01F5ETH5T4MKTXJ1PEHQ71758P/chunks/000001
./01F5ETH5T4MKTXJ1PEHQ71758P/meta.json
./01F5ETH5T4MKTXJ1PEHQ71758P/tombstones
...
Any attempts to restore this dump file will crash the target Prometheus with the
above error, complaining that files 000027 and 000028 are out-of-sequence.
To fix this dump file, we will have to manually delete those offending files:
mkdir temp

tar -xvfz dump.tar.gz -C temp

rm temp/chunks_head/000027 chunks_head/000029

tar -C temp -czvf restored.tar.gz .
Now you can restore the restored.tar.gz file to your target Prometheus with:
kubectl promdump restore -p $POD_NAME -t restored.tar.gz
Note that deleting those head files may cause some head data to be lost.
promdump is still in its experimental phase. SREs can use it to copy data blocks from one Prometheus instance to another development instance, while debugging cluster issues.
Before restoring the data dump, promdump will erase the content of the data folder in the target Prometheus instance, to avoid corrupting the data blocks due to conflicting segment error such as:
opening storage failed: get segment range: segments are not sequentialRestoring a data dump containing out-of-sequence head blocks will crash the target Prometheus. See FAQ on how to fix the data dump.
promdump not suitable for production backup/restore operation.
Like kubectl cp, promdump requires the tar binary to be installed in the
Prometheus container.
To run linters and unit test:
make lint testTo produce local builds:
# the promdump core
make core

# the kubectl CLI plugin
make cli
To test the kubectl plugin locally, the plugin manifest at
plugins/promdump.yaml must be updated with the new checksums. Then run:
kubectl krew install --manifest=plugins/promdump.yaml --archive=target/releases/<release>/plugins/kubectl-promdump-linux-amd64-<release>.tar.gzAll the binaries can be found in the local target/bin folder.
To install Prometheus via Helm:
make hack/prometheusTo create a release candidate:
make release VERSION=<rc-name>To do a release:
git tag -a v$version

make release
All the release artifacts can be found in the local target/releases folder.
Note that the GitHub Actions pipeline uses the same make release targets.
Licensed under the Apache License, Version 2.0 (the "License"); you may not use these files except in compliance with the License. You may obtain a copy of the License at:
http://www.apache.org/licenses/LICENSE-2.0
Unless required by applicable law or agreed to in writing, software distributed under the License is distributed on an "AS IS" BASIS, WITHOUT WARRANTIES OR CONDITIONS OF ANY KIND, either express or implied. See the License for the specific language governing permissions and limitations under the License.

