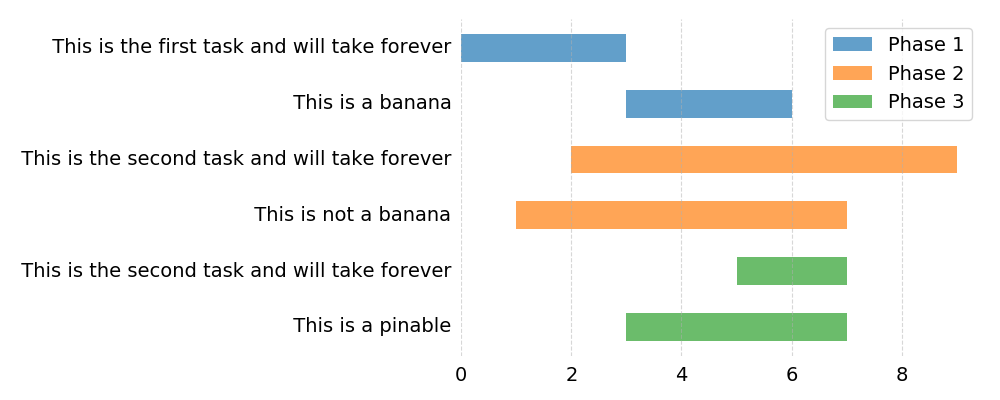
A simple matplotlib-based gantt chart maker.
pygantt [-h] [-c] [-o OUTPUT] [--width WIDTH] [--height HEIGHT] file

positional arguments:
  file                  Path to sectioned CSV file.

optional arguments:
  -h, --help            show this help message and exit
  -c, --continuous      Whether to keep the program alive and look for file
                        changes every second.
  -o OUTPUT, --output OUTPUT
                        Output filename.
  --width WIDTH         Width of output in inches.
  --height HEIGHT       Height of output in inches.
Write a simple sectioned CSV file:
*Phase 1
0, 3, This is the first task and will take forever
3, 6, This is a banana

*Phase 2
2, 9, This is the second task and will take forever
1, 7, This is not a banana

*Phase 3
5, 7, This is the second task and will take forever
3, 7, This is a pinable
Call pygantt on it:
python pygant.py test.csvThe output is saved to gantt.png by default (change it with the --output option):
