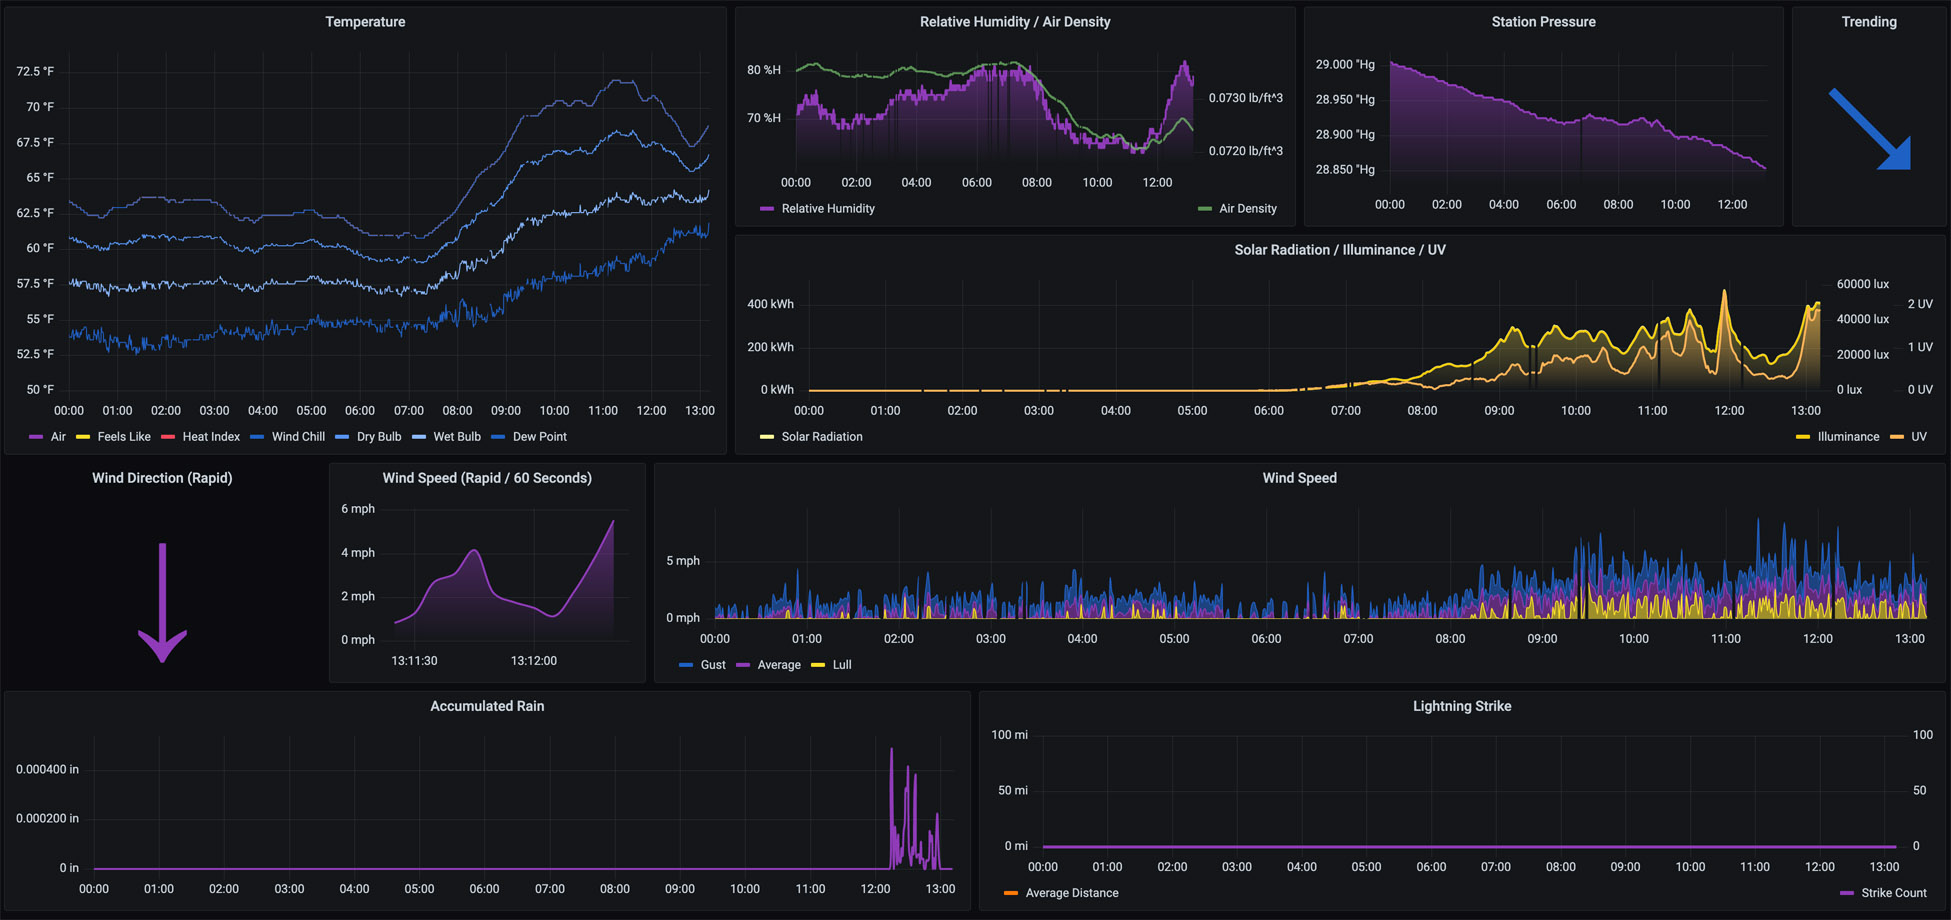
weatherflow-collector is a set of scripts deployed with Docker that provide multiple ways of collecting data from the WeatherFlow Tempest weather system. Once deployed, this collection of Grafana dashboards will help you start visualizing that data. If you're just getting started with Grafana, InfluxDB, and WeatherFlow Tempest - you may want to check out my WeatherFlow Dashboards AIO (All In One) project.
A live set of dashboards using this collector are available for you to try out.
The project builds a pre-configured Docker container that takes different configurations based on how you want to collect and where you want to store the data.
Like all projects - weatherflow-collector is always in a flux state based on trying out new things and seeing what works and what doesn't work. It started as a fun exercise to visualize "what's possible," and I'm experimenting with different collectors and backends. Please expect breaking changes along the way.
Use the following Docker container:
lux4rd0/weatherflow-collector:3.5.1
lux4rd0/weatherflow-collector:latest

lux4rd0/weatherflow-collector:3.5.1-arm64
lux4rd0/weatherflow-collector:latest-arm64

lux4rd0/weatherflow-collector:3.5.1-arm
lux4rd0/weatherflow-collector:latest-arm
Correct environmental variables are required for the container to function. The following script may be used:
generate_docker-compose.sh
The script takes the following details about your InfluxDB and your WeatherFlow token as environmental variables:
WEATHERFLOW_COLLECTOR_IMPORT_DAYS #optional
WEATHERFLOW_COLLECTOR_INFLUXDB_PASSWORD
WEATHERFLOW_COLLECTOR_INFLUXDB_URL
WEATHERFLOW_COLLECTOR_INFLUXDB_USERNAME
WEATHERFLOW_COLLECTOR_LOKI_CLIENT_URL #optional
WEATHERFLOW_COLLECTOR_PERF_INTERVAL #option
WEATHERFLOW_COLLECTOR_THREADS #optional
WEATHERFLOW_COLLECTOR_TOKEN
An example command line would be (be sure to use your own personal access token):
WEATHERFLOW_COLLECTOR_IMPORT_DAYS="365" \
WEATHERFLOW_COLLECTOR_INFLUXDB_PASSWORD="4L851Jtjaasdset7AJoFasdoFYR3di5Zniew28" \
WEATHERFLOW_COLLECTOR_INFLUXDB_URL="http://influxdb01.com:8086/write?db=weatherflow" \
WEATHERFLOW_COLLECTOR_INFLUXDB_USERNAME="influxdb" \
WEATHERFLOW_COLLECTOR_PERF_INTERVAL="60" \
WEATHERFLOW_COLLECTOR_THREADS="4" \
WEATHERFLOW_COLLECTOR_TOKEN="a22afsa7-0dcc-4918-9f9a-923dfd339f41c" \
bash ./generate_docker-compose.sh
The following files will be generated for you:
Running docker-compose up -d' will spin up several containers for each of the types of data collectors (listed below). If you have more than one hub on your account - please edit the docker-compose.yml` file to only have your hub local to your network. If you have more than one device, those will also be added and can remain.
This script will spin up a docker container to import all of the observed metrics from the WeatherFlow cloud. Having an import function may be helpful if you're starting with this WeatherFlow Collector or if you've reset your InfluxDB database. This script essentially loads whatever is in the WeatherFlow cloud and imports it as your locally collected UDP data. If you have more than one device, a separate import file will be generated for each.
If you want to export your data from the WeatherFlow cloud, run this Docker command substituting your own token:
docker run --rm \
  --name=weatherflow-collector-remote-export \
  -e WEATHERFLOW_COLLECTOR_COLLECTOR_TYPE=remote-export \
  -e WEATHERFLOW_COLLECTOR_FUNCTION=export \
  -e WEATHERFLOW_COLLECTOR_TOKEN=127d99f7-3s88-4d7d-bd73-0ba962d181ec \
  -e WEATHERFLOW_COLLECTOR_EXPORT_DAYS=20 \
  -v $(pwd):/weatherflow-collector/export \
  lux4rd0/weatherflow-collector:latest
Files will be created in your current working directory the look something like this:
weatherflow-collector_export-station_351-device_26040.csv weatherflow-collector_export-station_351-device_16029.csv
WEATHERFLOW_COLLECTOR_BACKEND_TYPE
- influxdb (supports local-udp, remote-rest (forecasts), and remote-socket (observations)
- loki (supports local-udp and remote-socket (observations) (Currently disabled)
WEATHERFLOW_COLLECTOR_COLLECTOR_TYPE
- local-udp
- remote-forecast
- remote-rest
- remote-socket
- remote-export
- remote-import
- host-performance
WEATHERFLOW_COLLECTOR_DEBUG
- false
- true
WEATHERFLOW_COLLECTOR_DEVICE_ID
The Device ID of your Tempest
WEATHERFLOW_COLLECTOR_FORECAST_INTERVAL
How often (in seconds) forecast data is collected from WeatherFlow. Defaults to 60 seconds if not set.
WEATHERFLOW_COLLECTOR_FUNCTION
- collector
- import
- export
WEATHERFLOW_COLLECTOR_DOCKER_HEALTHCHECK_ENABLED
- false
- true
A Docker health check function that runs every 60 seconds. If no data has been collected or persisted to InfluxDB and this parameter is set to true, the docker container will be marked as Unhealthy and terminate. Setting this to false will always return a healthy response to the Docker health check. The health check is included because there may be times where the local UDP listener or remote-socket connection goes silent, and recycling of the container is the only way to get it listening again. You may also find the remote-forecast container takes longer than 60 seconds to complete its hourly forecast transformation. A future update will change the 60 seconds to be a multiple of the interval rate rather than a fixed 60 seconds.
WEATHERFLOW_COLLECTOR_EXPORT_DAYS
The number of days you want to export to a file from either the WeatherFlow cloud or Grafana Loki.
WEATHERFLOW_COLLECTOR_HOST_HOSTNAME
This value represents the hostname that is running the Docker containers. Docker creates a unique hostname each time a docker container is recycled. This entry is used in the management dashboards to know where your collectors are running. It's also helpful if you run the collector across multiple hosts. This value is populated when the generate_docker-compose.sh script generates the docker-compose.yml file.
WEATHERFLOW_COLLECTOR_HUB_SN
The WeatherFlow Hub serial number.
WEATHERFLOW_COLLECTOR_IMPORT_DAYS
The number of days you want to import from either the WeatherFlow cloud or Grafana Loki.
WEATHERFLOW_COLLECTOR_INFLUXDB_PASSWORD
The password for your InfluxDB
WEATHERFLOW_COLLECTOR_INFLUXDB_URL
The URL connection string for your InfluxDB. For example: http://influxdb:8086/write?db=weatherflow
WEATHERFLOW_COLLECTOR_INFLUXDB_USERNAME
The username of your InfluxDB
WEATHERFLOW_COLLECTOR_LATITUDE
The latitude of your WeatherFlow device.
WEATHERFLOW_COLLECTOR_LOGCLI_URL
The URL for your Grafana Loki instance. This parameter is used for importing back from Loki. For example: http://loki.3100/
WEATHERFLOW_COLLECTOR_LOKI_CLIENT_URL
The URL connection string for your Grafana Loki endpoint. For example: http://loki:3100/loki/api/v1/push
WEATHERFLOW_COLLECTOR_PERF_INTERVAL
How often (in seconds) the host-performance container polls your host for performance metrics. Defaults to 60 seconds if not set.
WEATHERFLOW_COLLECTOR_REST_INTERVAL
How often (in seconds) observation data is collected from WeatherFlow. Defaults to 60 seconds if not set.
WEATHERFLOW_COLLECTOR_STATION_ID
The Station ID of your Tempest
WEATHERFLOW_COLLECTOR_STATION_NAME
The Station Name of your WeatherFlow device.
WEATHERFLOW_COLLECTOR_THREADS
The number of threads used when populating the Forecast Hourly details or importing WeatherFlow Cloud or Grafana Loki logs. Defaults to 4 threads if not set. This likely should align with the number of CPUs that you have.
WEATHERFLOW_COLLECTOR_TOKEN
The WeatherFlow Personal Access Token.
Note - If a change is made to the location details of your WeatherFlow device (such as station name, public name, longitude, latitude, etc.) - please rerun the generate_docker-compose.sh script or manually update the environmental variables to match.
You can obtain this by signing in to the Tempest Web App at tempestwx.com, then go to Settings -> Data Authorizations -> Create Token.
This setting grabs all of the metrics from your Tempest and all of the derived metrics, accomplished with WeatherFlow backend AI systems. The metrics don't have the same metrics resolution as the local-udp collector but supports lightning suppression and sea level pressure adjustments along with additional events such as online and offline status.
This setting is similar to the remote-socket for obtaining Weatherflow observations but only pulls data once a minute from a REST call. A few additional metrics are available on this collector, such as sea level pressure. Still working out which metrics make sense and the right kind of polling mechanism to put in place - so I'm trying out both!
This setting provides a listener on UDP port 50222 for messages coming from your Tempest hub. It provides all of the raw observation details and details on the Hub and Tempest, such as RSSI Wifi details, uptime, sensor details, and device battery voltage. The observation metrics have a slightly higher resolution of data than the REST/Socket API calls provide. However, it does not give any of the derived metrics available with the REST/Socket API calls.
This setting populates the WeatherFlow Forecast dashboards by polling the daily and hourly forecasts for your location and stores them in InfluxDB. The forecasting process runs on startup and every quarter-hour - 00, 15, 30, and 45 minutes
This setting populates the WeatherFlow local-udp metrics from the WeatherFlow Cloud or logs stored in Grafana Loki.
This optional container populates a few metrics about the performance of the host (or hosts). Metrics for CPU percentage, process queue, and memory are shown in the System Stats dashboard.
Collecting data is only half the fun. Now it's time to provision some Grafana Dashboards to visualize all of your great WeatherFlow data. You'll find a folder of dashboards with collectors and backends split out. You can also use the links/numbers next to each dashboard title to load the dashboards in directly from Grafana.
Coming soon - a set of Grafana alerts to let you know of deviations in expected collector performance or weather metrics change.
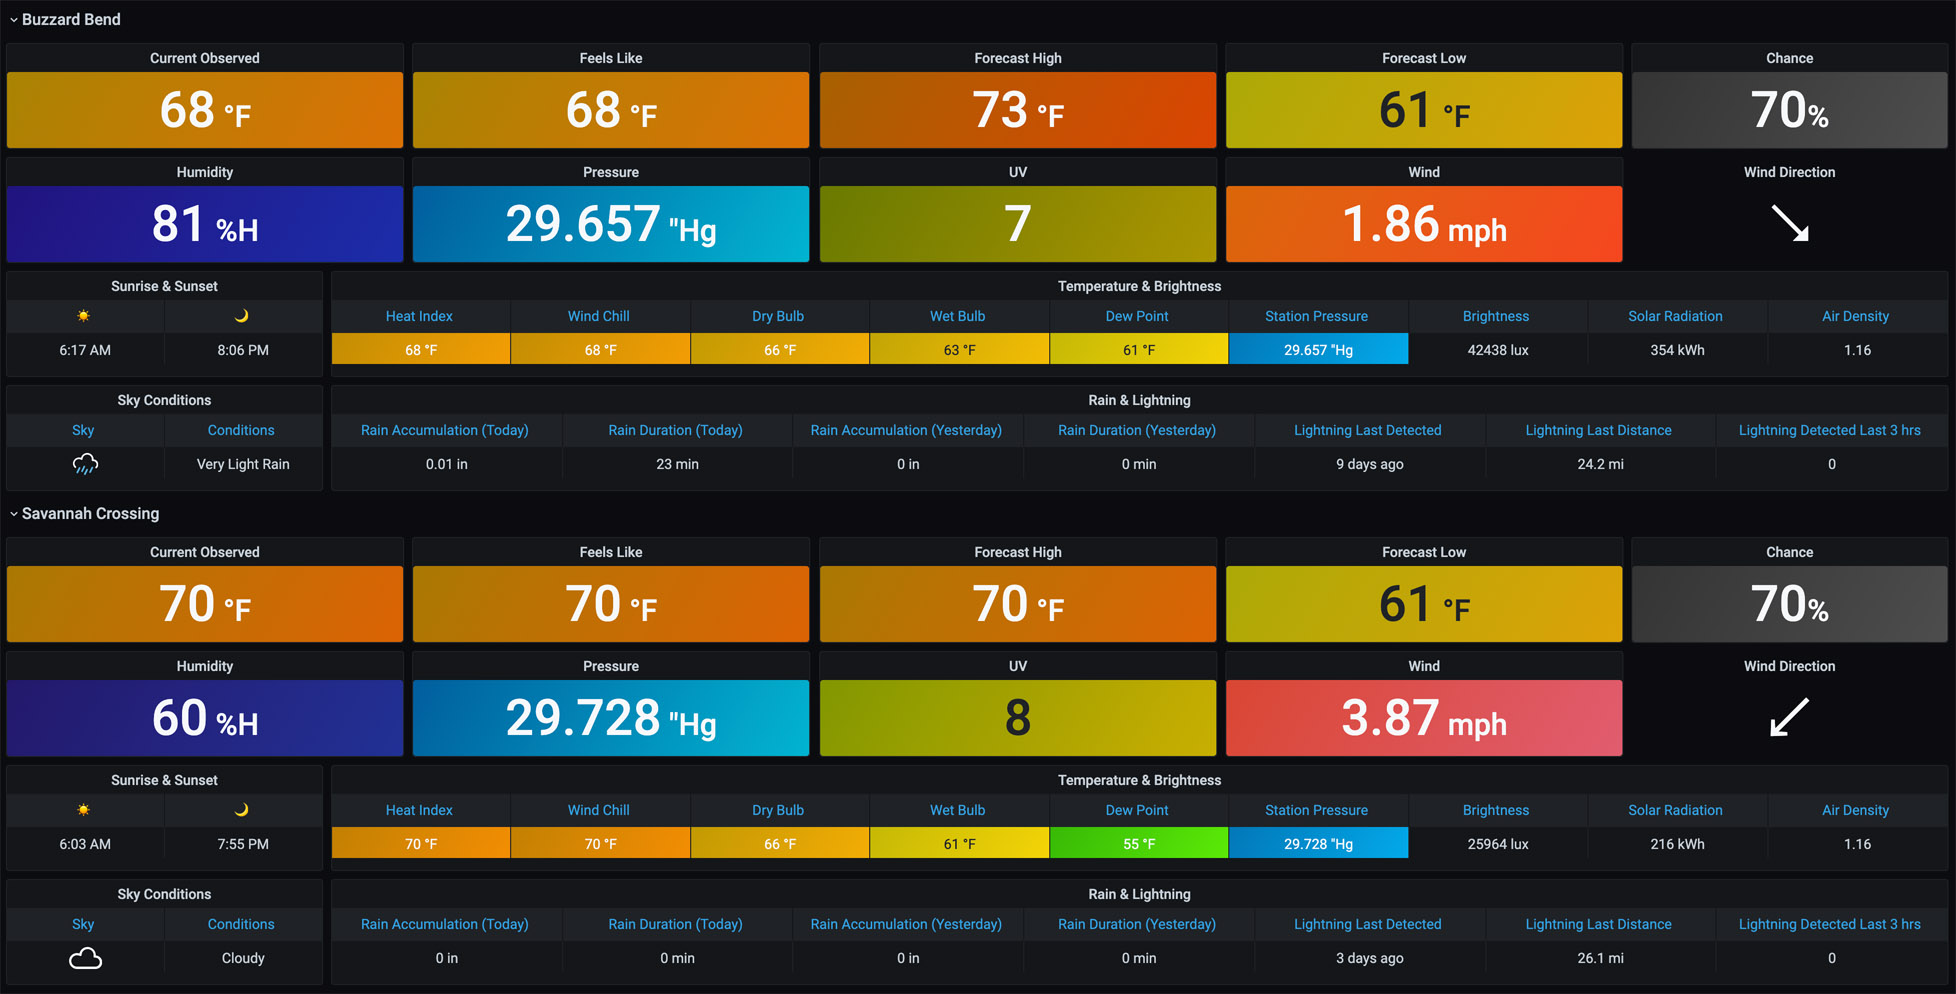
Current Conditions - 14376
This dashboard provides a comprehensive overview of your station location, combining all "at-a-glance" metrics from your WeatherFlow device. The current conditions dashboard is divided up into:
-
Temperature & Wind: observed, feels like, forecast high and low, the chance of precipitation, humidity, sea level pressure, UV, wind speed, and direction.)
-
Sunrise & Sunset and Sky Conditions
-
Temperature & Brightness: Heat index, wind chill, dry bulb, wet bulb, dew point, station pressure, brightness, solar radiation, and air density.
-
Rain & Lightning: Rain accumulation (today and yesterday), rain duration (today and yesterday), lightning last detected, last distance, and the number of lightning detections during the previous 3 hours.
Device Details - 14378
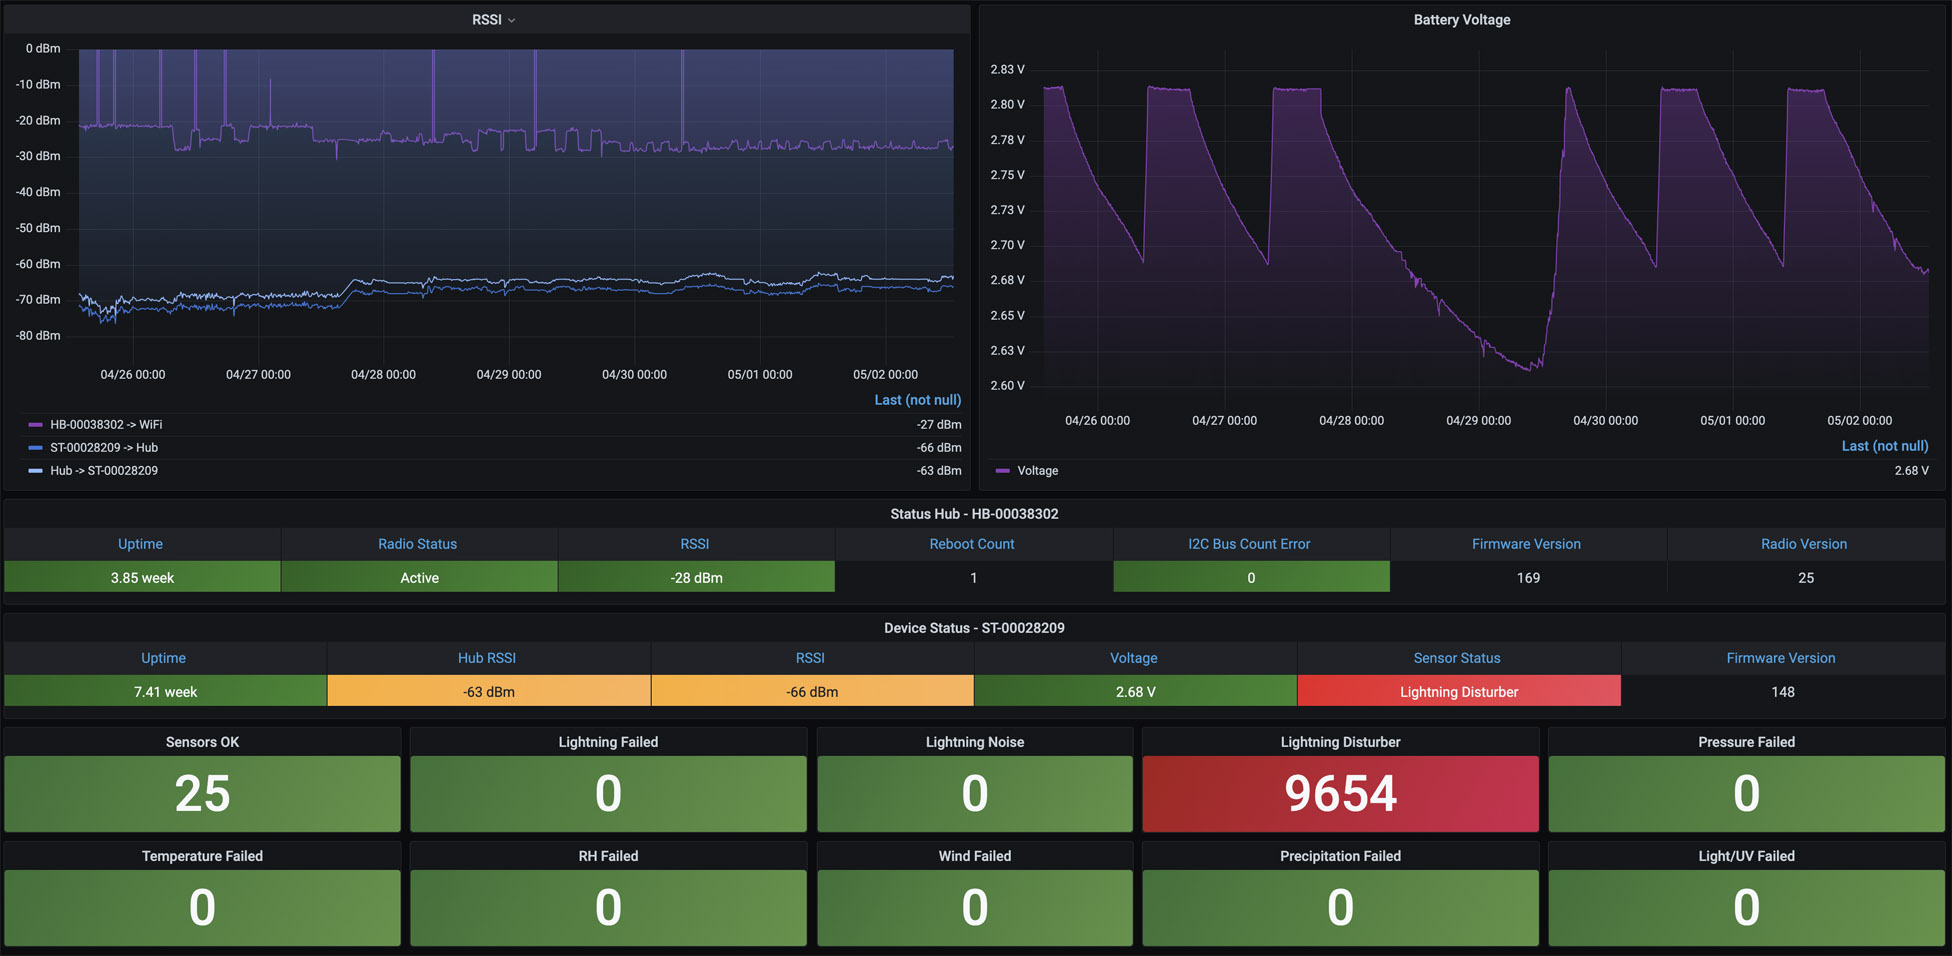
This dashboard provides the current status for both the Tempest and your WeatherFlow hub, such as Uptime, Radio Status, RSSI, Reboot Count, I2C Bus Count Error, Radio Version, Network ID, Firmware Version, and Voltage.
RSSI and Battery Voltage over time defaulted to the last seven days are shown at the top of the dashboard, while current device details are shown below.
Sensor Status measurements are shown with a number related to each per minute collection from the device. Either "Sensors OK" is down or any failures, which sensor had the error. Note that if you have the Lightning Disturber enabled, you may see a high number of failures as electromagnetic interference is being suppressed.
Forecast - 14380
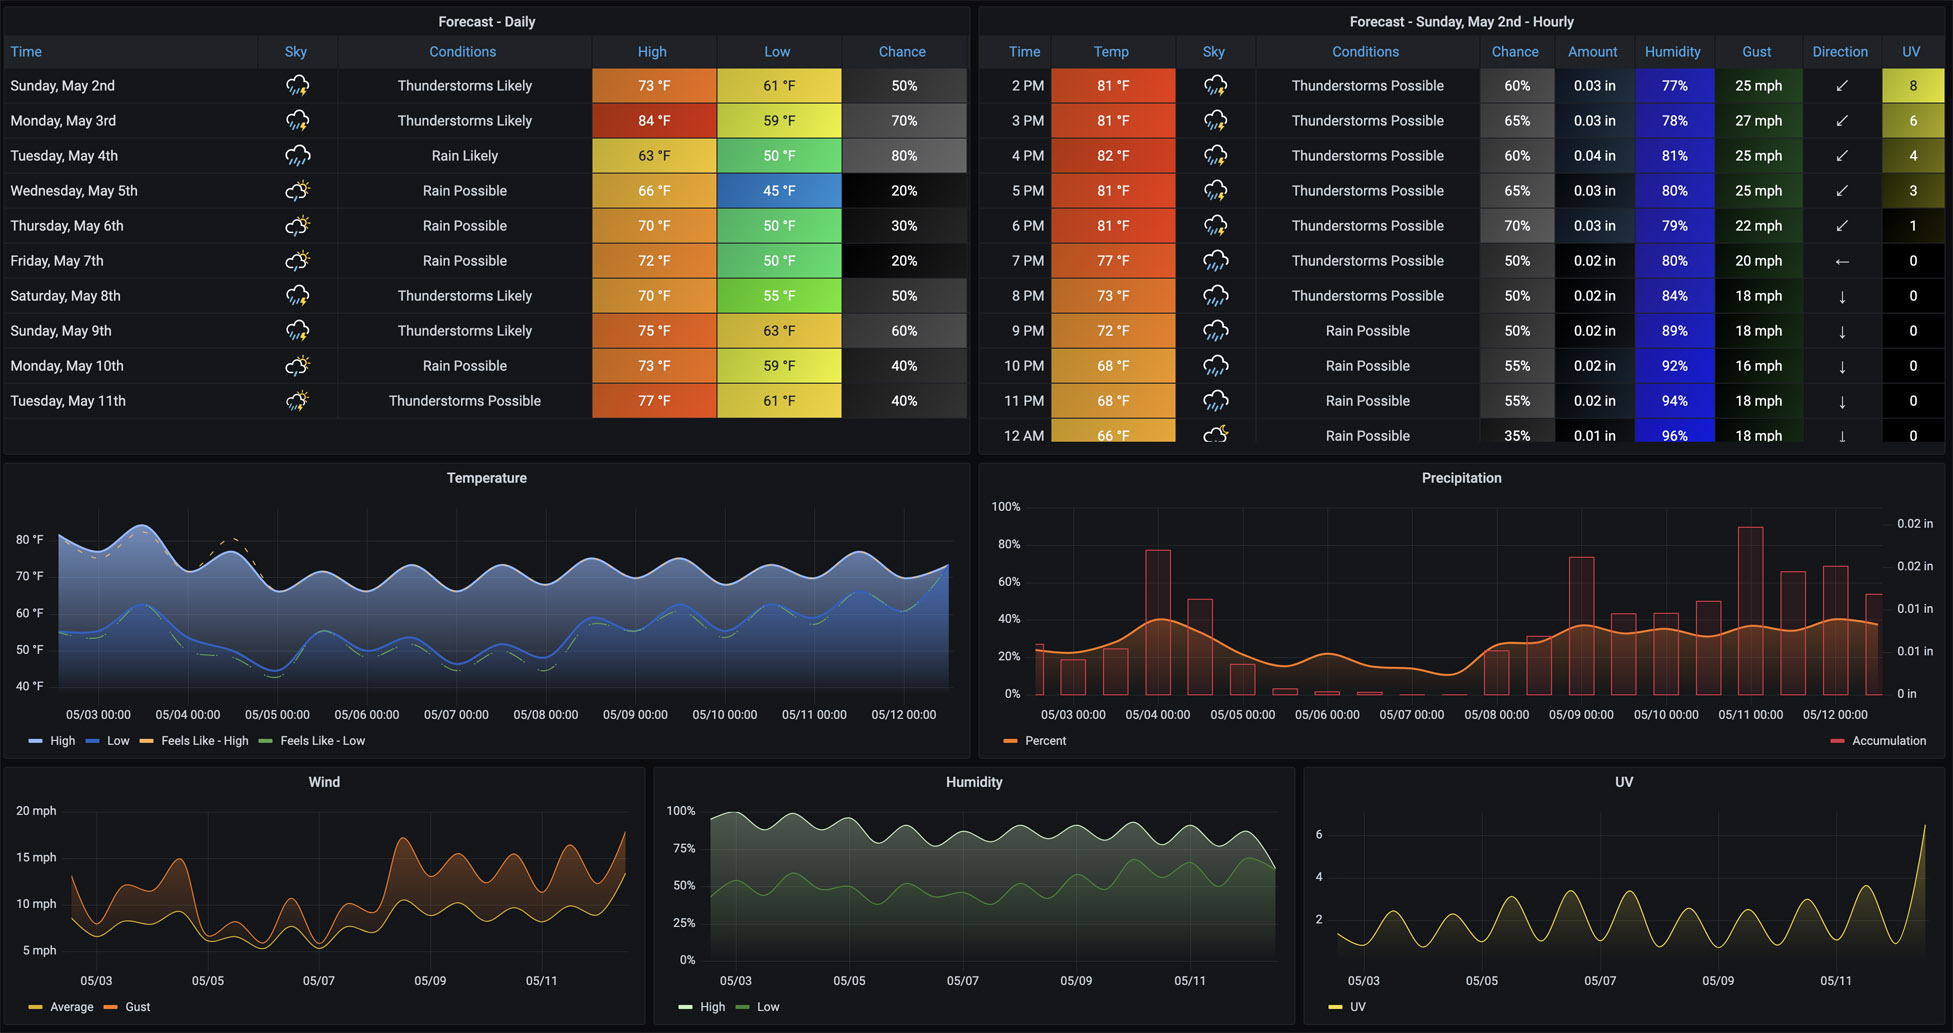
Provides both a daily and hourly forecast in table format with charts below them. The default time range includes the current day plus the next nine upcoming days. The interval drop-down at the top defaults to 12 hours to provide for highs and lows forecasts. Clicking on any of the dates in the "Forecast - Daily" table will refresh the Forecast hourly table to that day's hourly forecasts. This can also be done from the top "Forecast Day" drop-down menu.
Forecast Vs. Observed - 14379
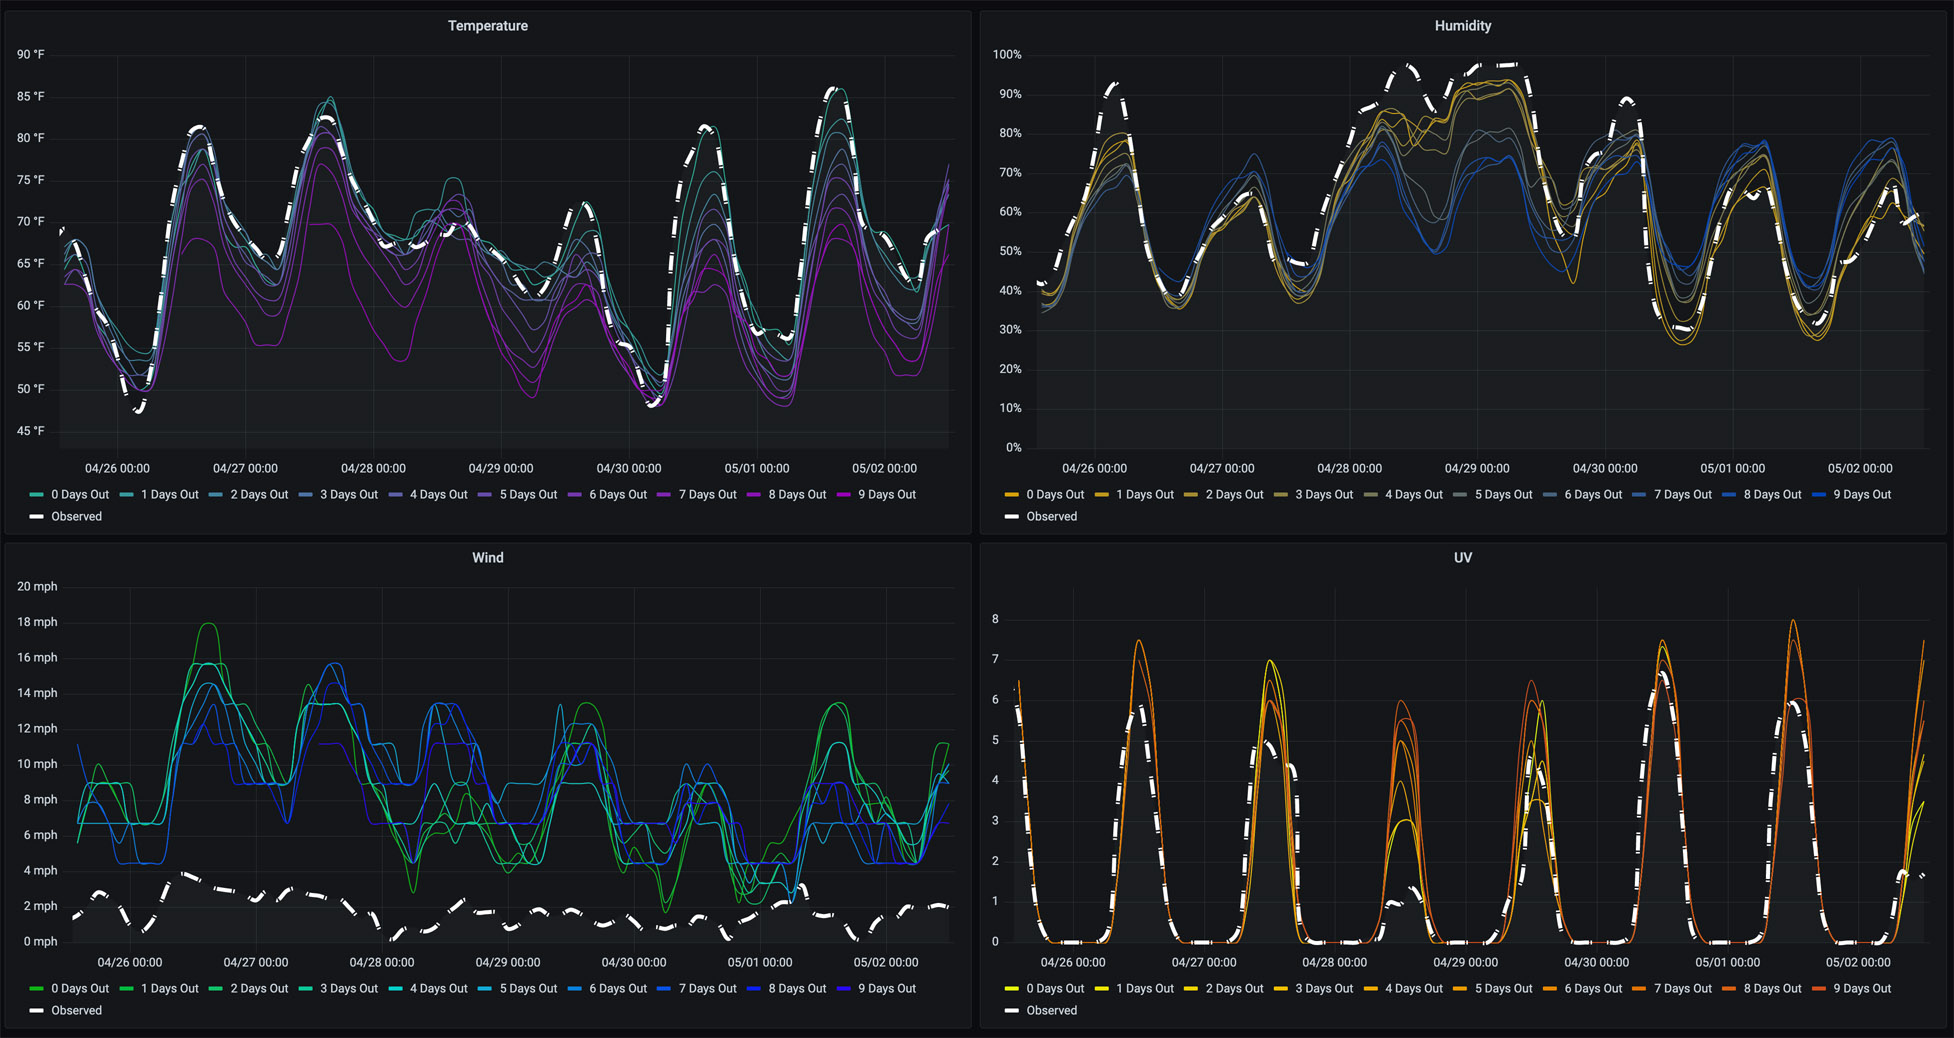
As forecast data is collected, this dashboard may be used to compare what was forecasted (by how many days out) versus the observed metric from your WeatherFlow device. Temperature, Humidity, Wind, and UV measurements are covered here. By default, "All" available forecast days are overlayed over the observed metric. You can choose different "Days Out" from the top drop-down menu to compare individual forecasts.
Historical (local-udp) - 14381
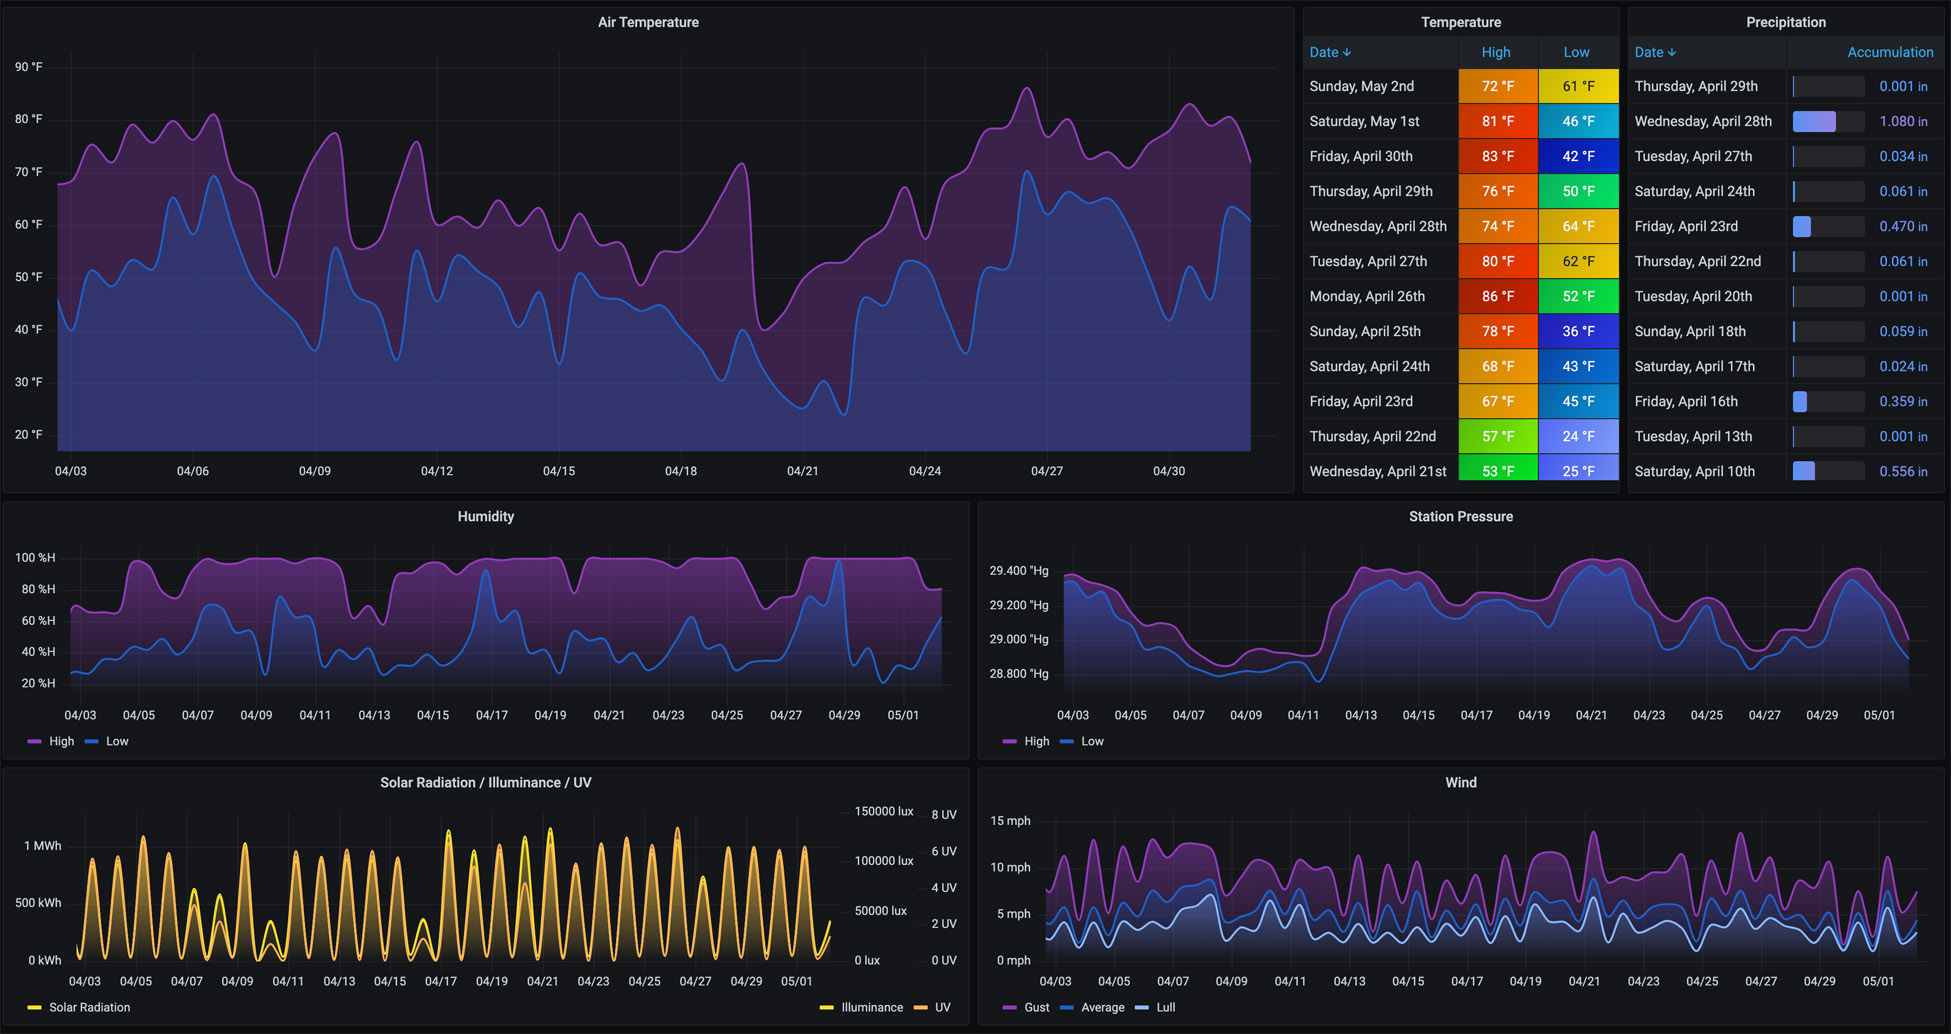
Provides a place to view weather details over longer periods of time. It defaults to 30 days with a 12-hour interval to show highs and lows for each of the Air Temperature, Humidity, Station Pressure, Solar, and Wind metrics. Precipitation Accumulation is displayed for any days that precipitation is detected.
Historical (remote) - 14382
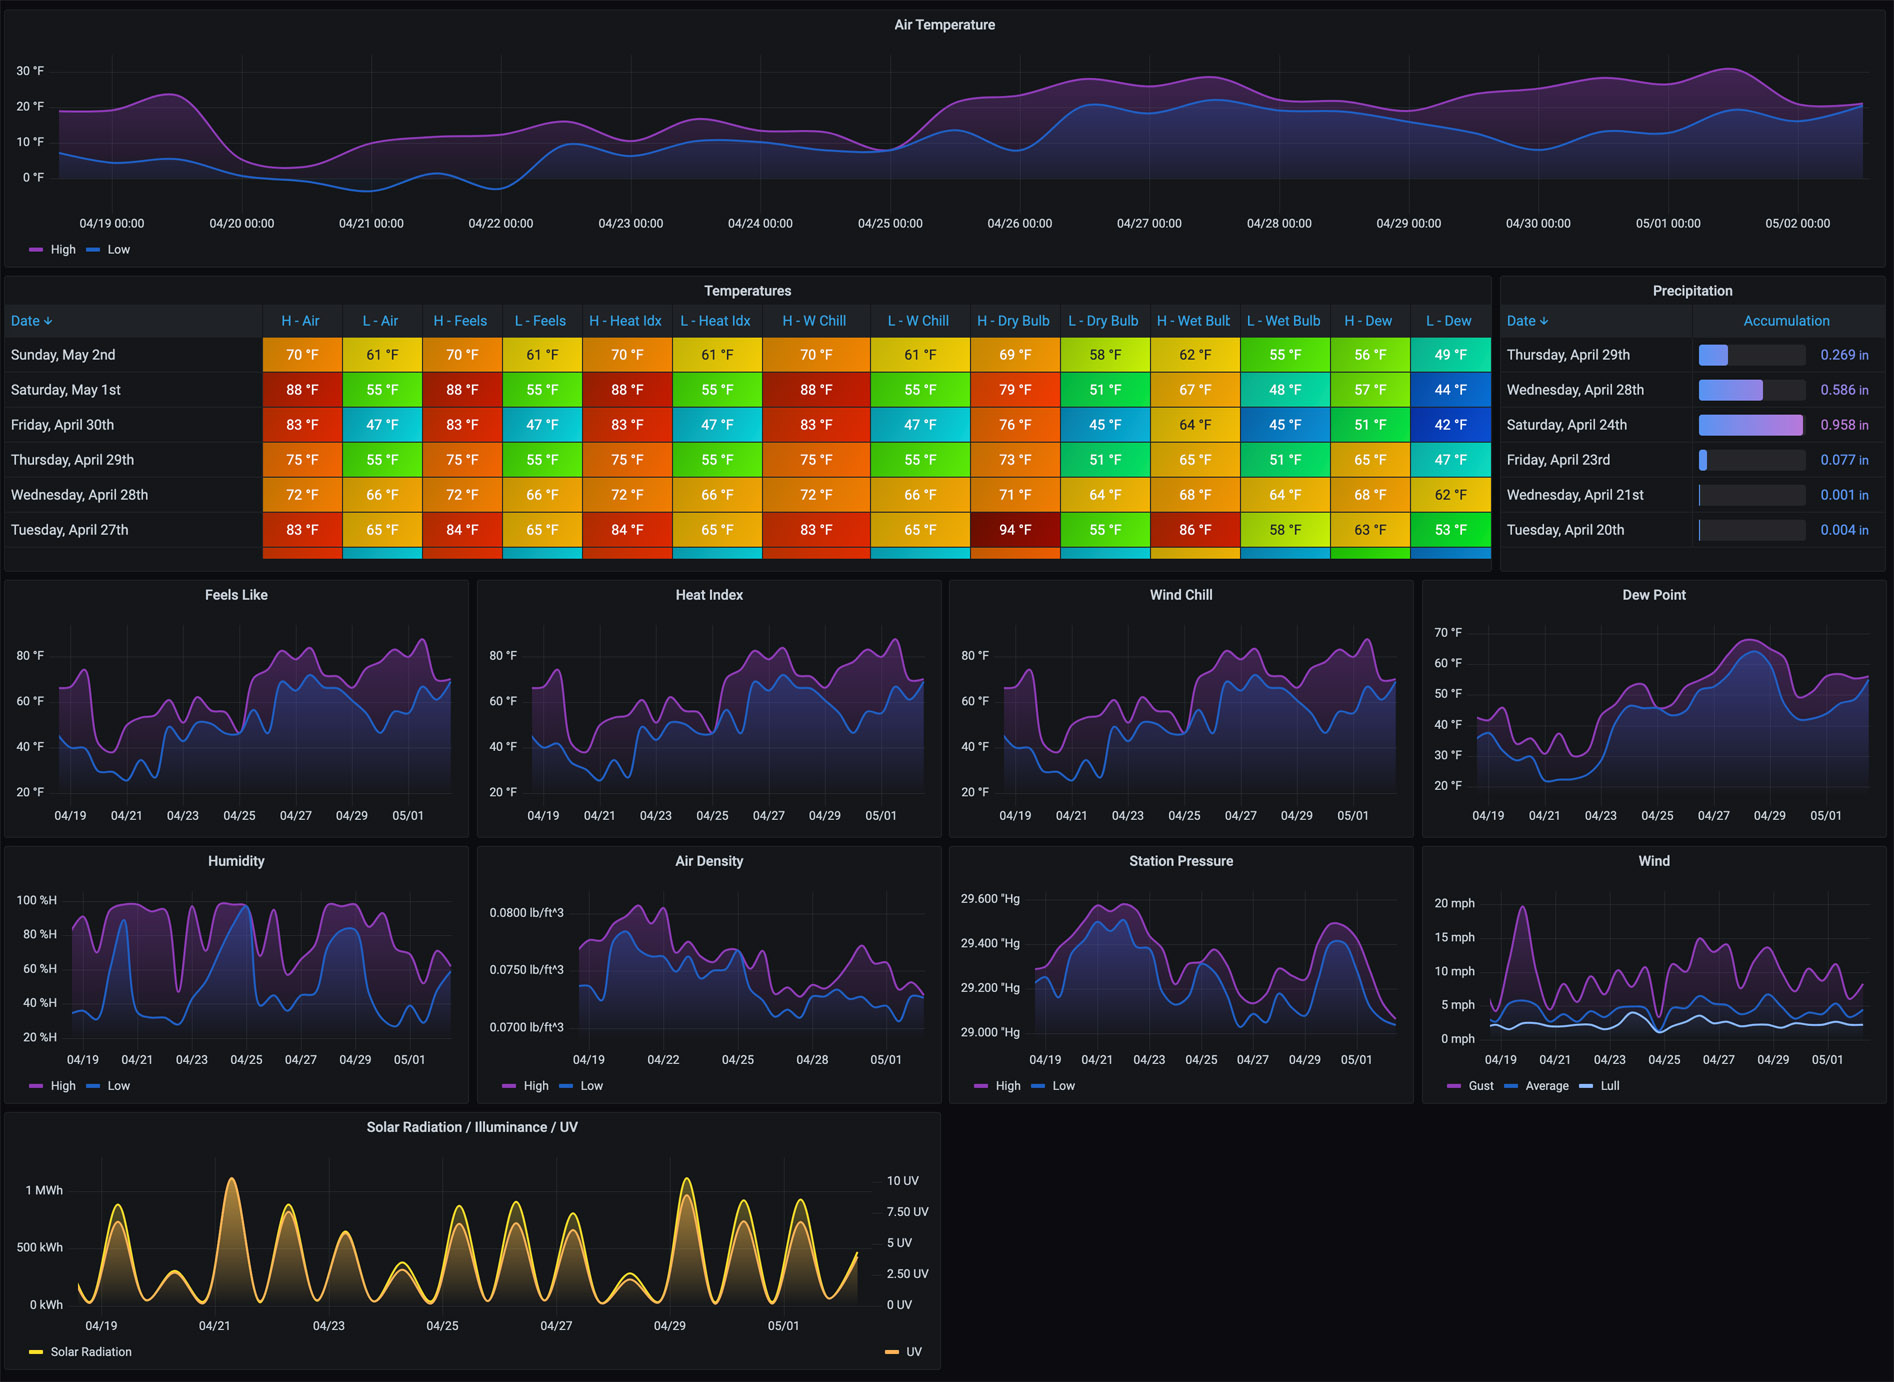
Provides a place to view weather details over longer periods of time. It defaults to 30 days with a 12-hour interval to show highs and lows for each of the Air Temperature, Humidity, Station Pressure, Solar, and Wind metrics. Includes derived metrics as well such as Feels Like, Heat Index, Wind Chill, Dry Bulb, Wet Bulb, and Dew Point. Precipitation Accumulation is displayed for any days that precipitation is detected.
Overview - 14383
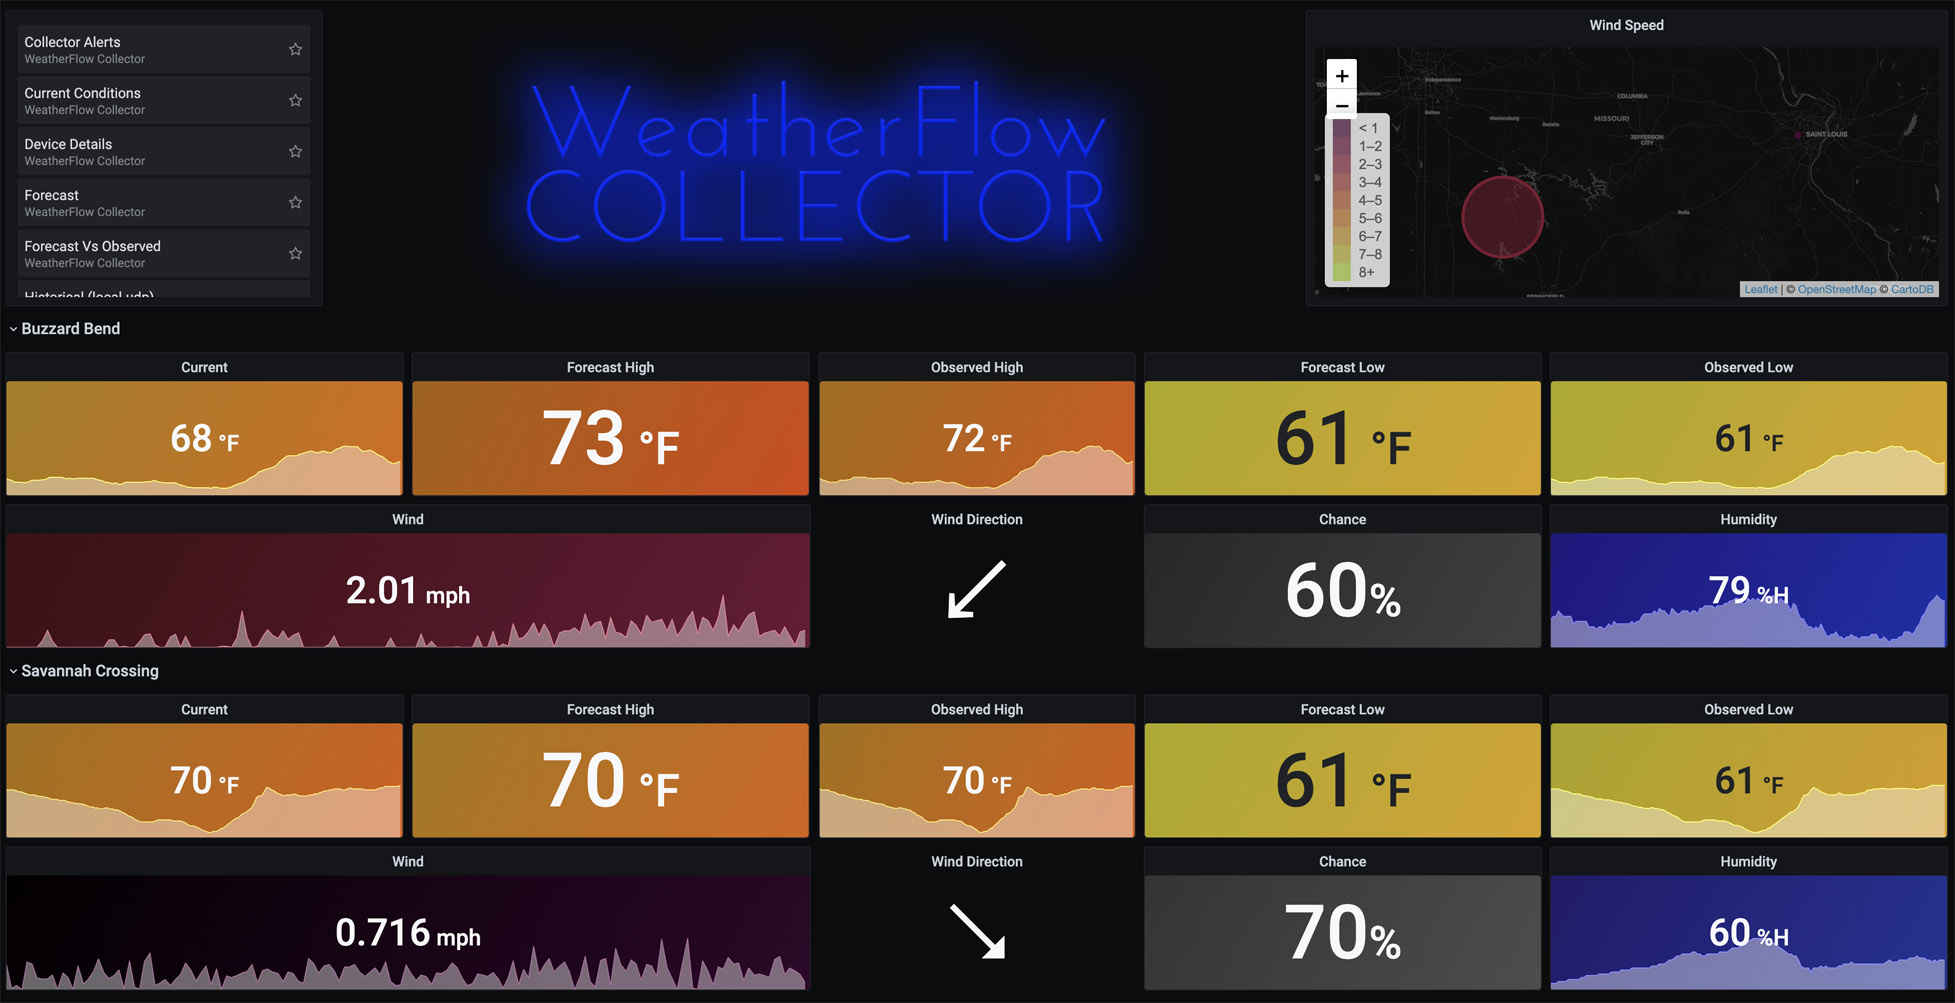
Overview is the default landing page for the WeatherFlow Collector AIO. It provides an overview of current weather metrics and live updates for Wind and direction. From here, you can choose other dashboards from the top right-hand dashboard panel or the top left-hand side drop-downs under "WeatherFlow Collector Dashboards."
Rain and Lightning - 14384
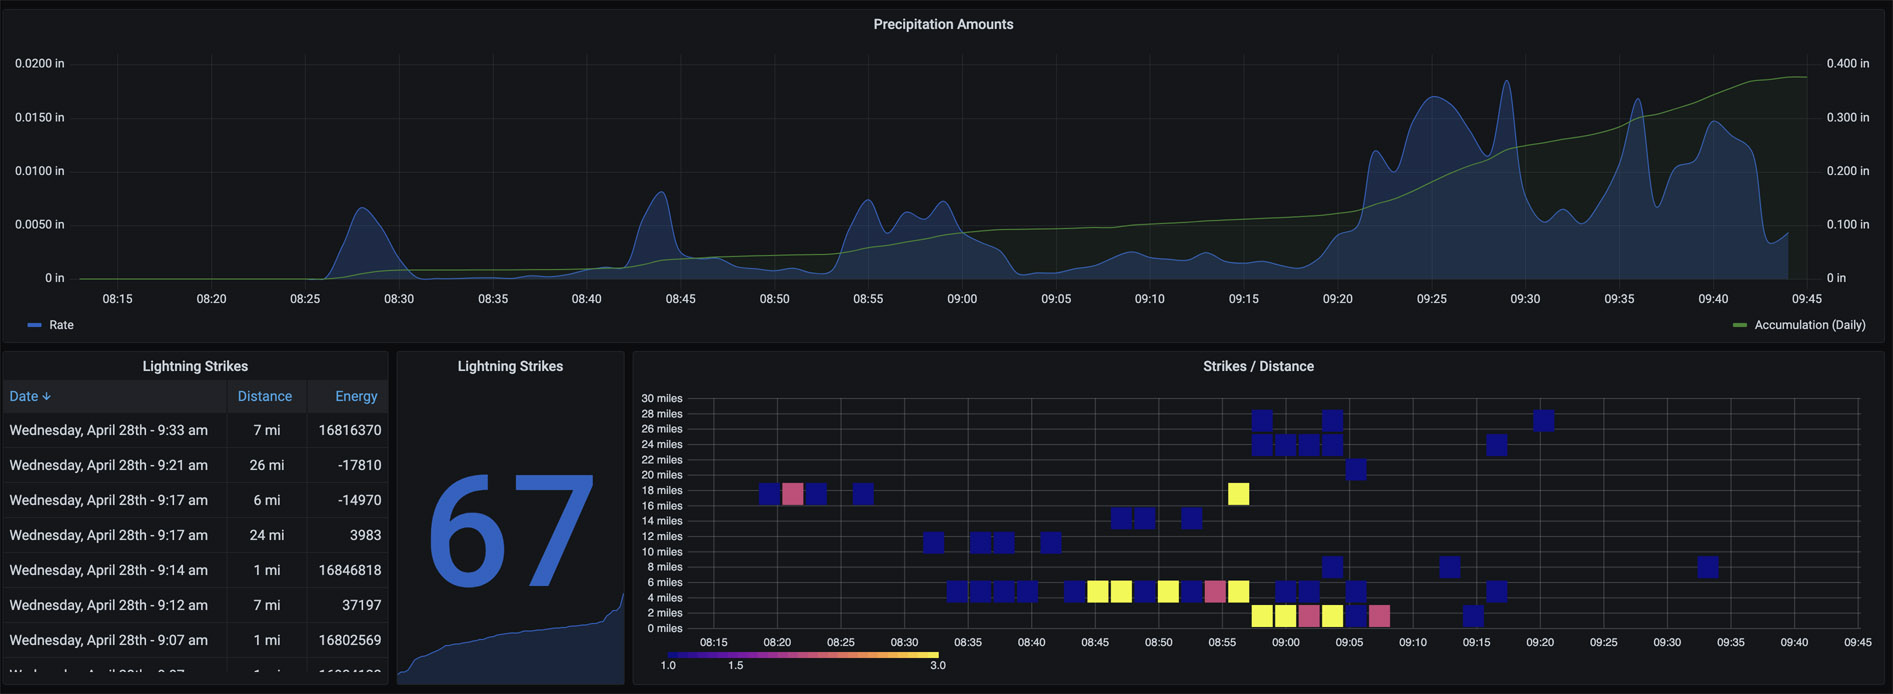
A historical view (defaulted to seven days) shows both the precipitation rate alongside the daily accumulation. As you zoom into the specific precipitation events, change the Interval drop-down to smaller increments (up to 1-minute collections) for finer rates.
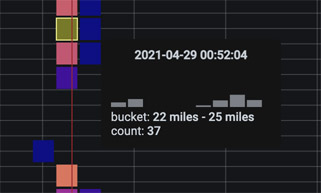
For Lightning, Strikes and Distance show on a heatmap visualization. Time is across the x-axis while the number of detected lightning strikes is bucketed by color (dark blue to yellow). The Y-axis shows the bucketed distances (up to 40 miles away). Hover over each of the squares to see a histogram of each strike/distance count.
System Stats - 14385
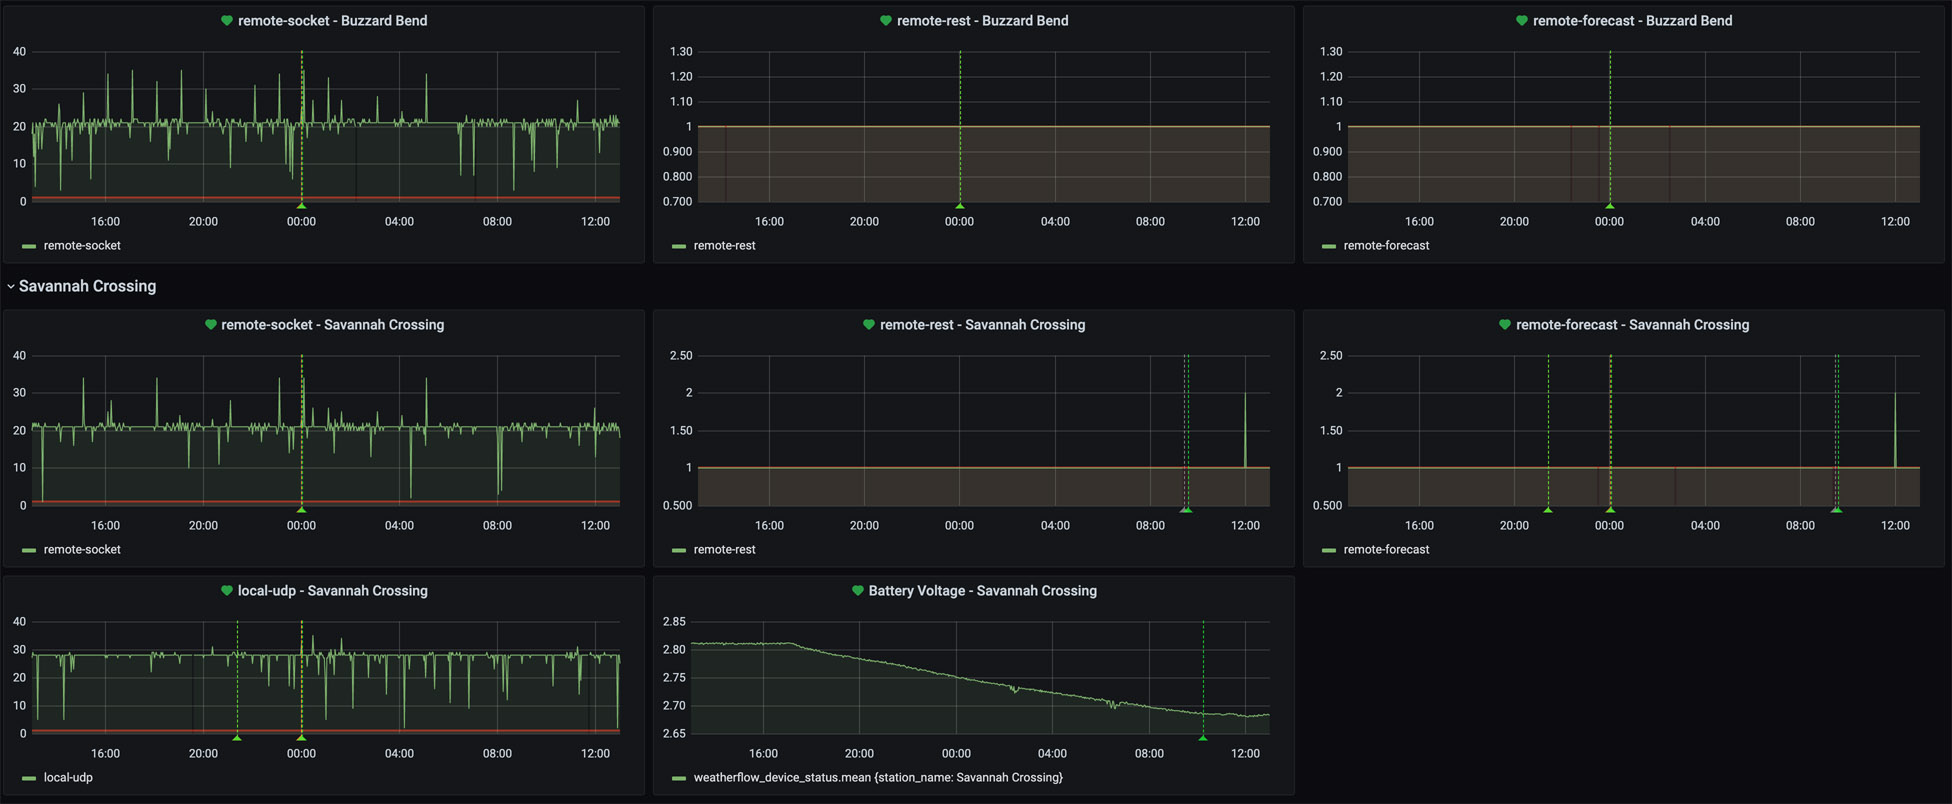
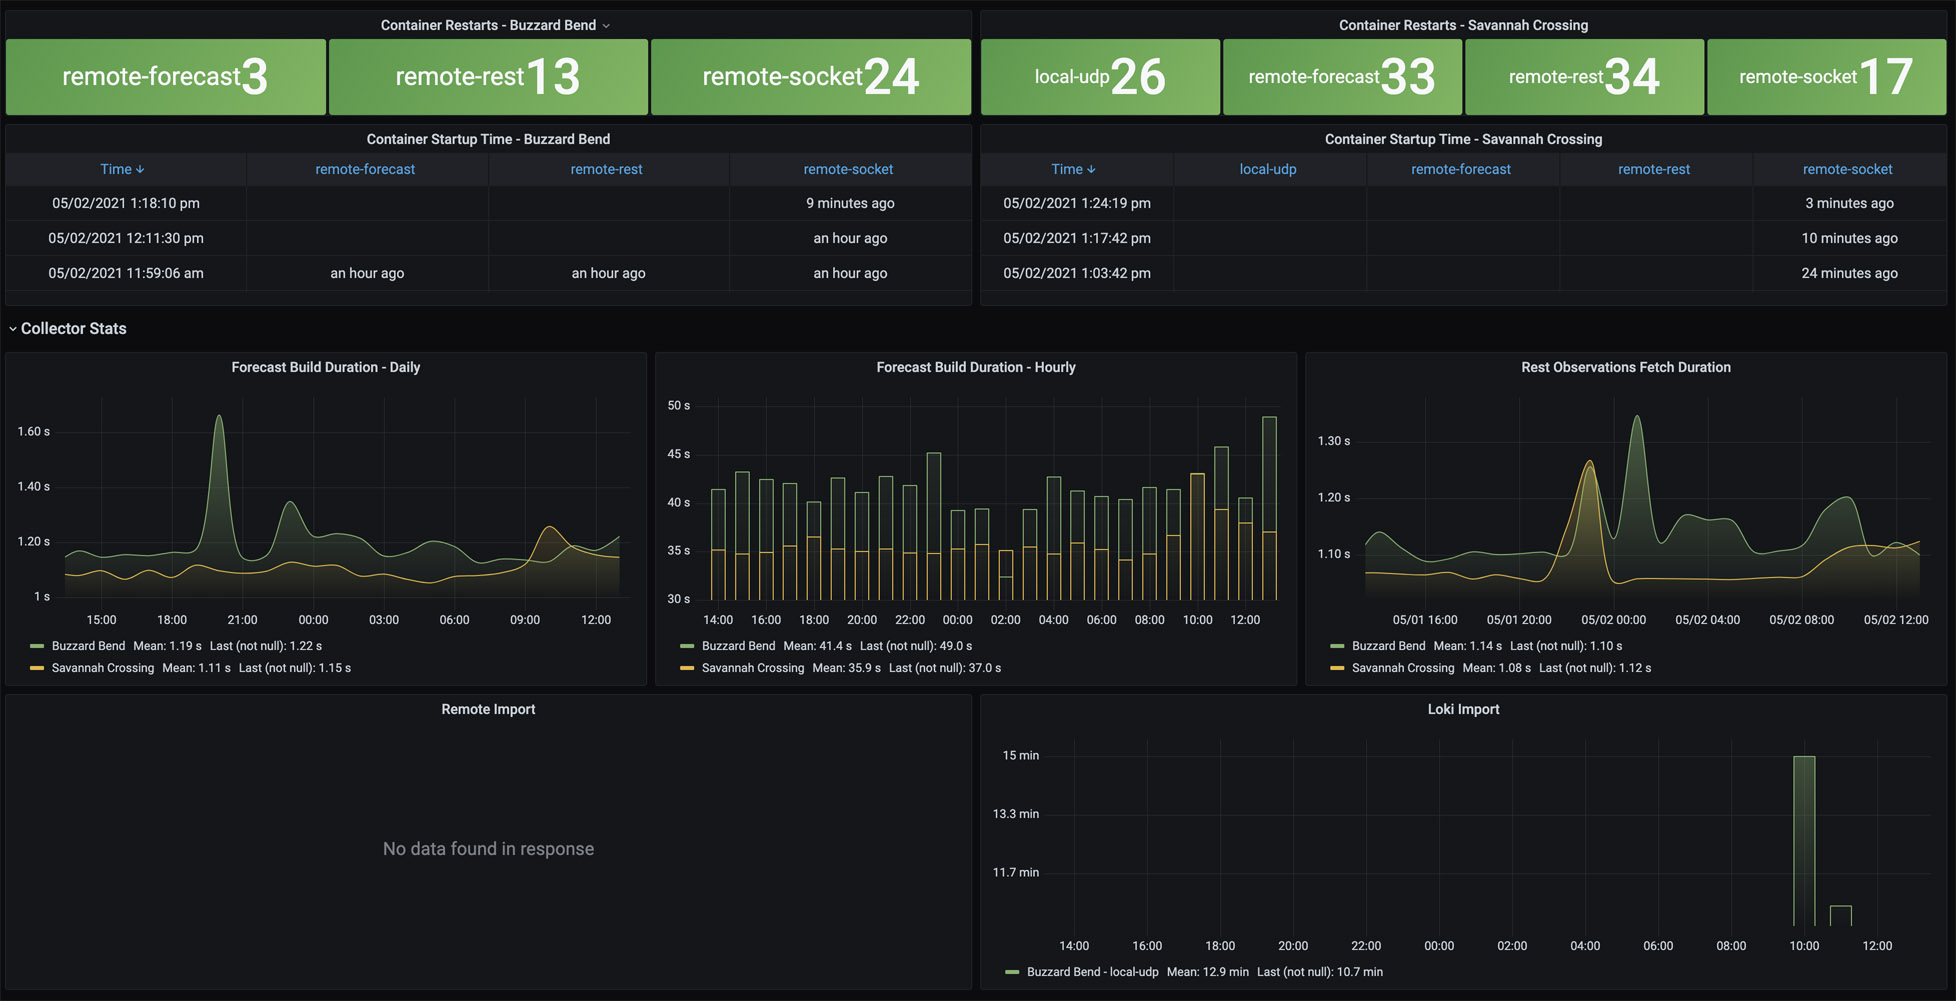
Provides for two different system metrics to understand the health of your weatherflow-collector. At the top shows which container is running and each of the times that it last started. A default Docker health check is enabled for each container that requires some data to be received and persisted every 60 seconds, or the container is marked unhealthy. This check happens every 5 seconds and will restart the container after three failed checks.
The second section shows how long it's taking to receive and persist forecasts and observations.
- Forecast Build Duration - Daily - between 1 and 2 seconds
- Forecast Build Duration - Hourly - between 30 and 45 seconds (note - if this takes longer than 60 seconds, the Docker Health Check will currently recycle the container. A future update will change this to take a longer build duration into account. For now - set the "WEATHERFLOW_COLLECTOR_DOCKER_HEALTHCHECK_ENABLED" environmental variable to "false".
- Rest Observations - between 1 and 2 seconds
Today So Far (local-udp) - 14386
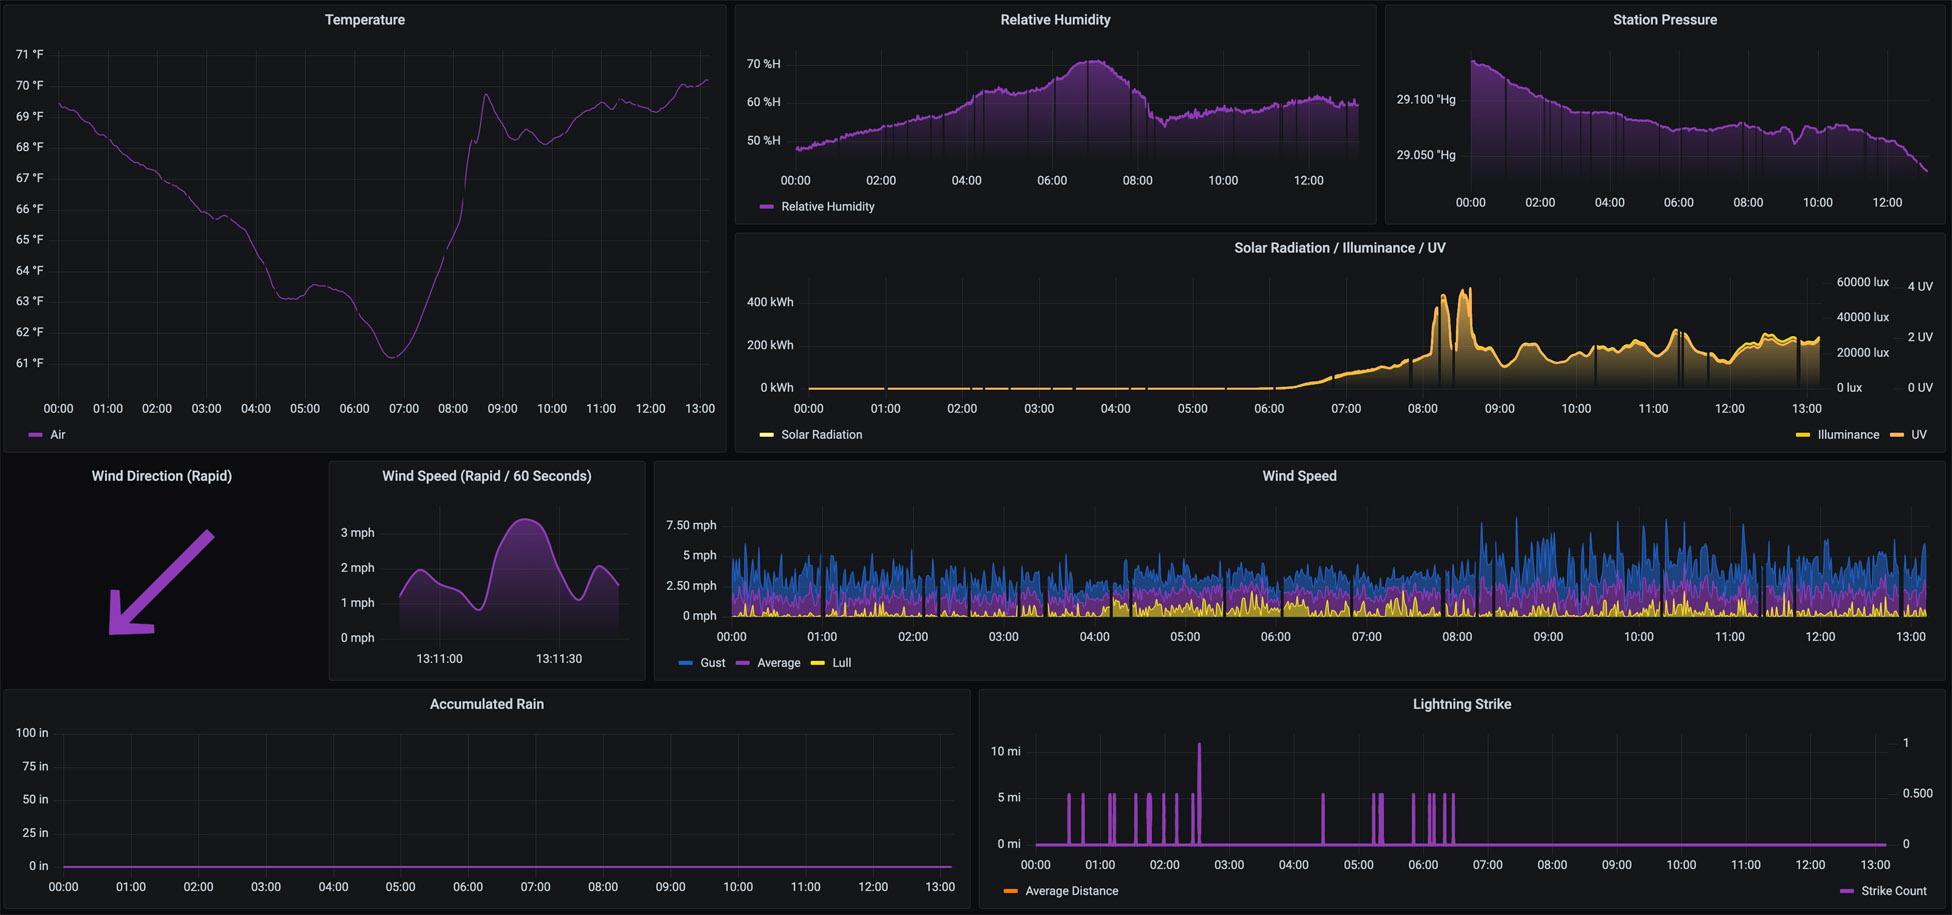
The dashboard provides for Temperature, Relative Humidity, Station Pressure, Accumulated Rain, Solar Radiation, Illuminance, UV, Lightning Strike, and Wind Speed from midnight to the current time. These reflect the direct measurements from the local-udp collector (or imported from WeatherFlow).
Today So Far (remote) - 14387
This dashboard provides for the Temperature (Air, Feels Like, Heat Index, Wind Chill, Dry Bulb, Wet Bulb, and Dew Point), Relative Humidity, Air Density, Station Pressure (with Trending), Accumulated Rain, Solar Radiation, Illuminance, UV, Lightning Strike, and Wind Speed from midnight to the current time. These reflect the WeatherFlow measurements from data sent to WeatherFlow and include derived metrics in the response.
The data collector and dashboards support multiple WeatherFlow Tempest devices.
A TZ variable is required when running the Docker containers. (It's populated automatically from the generate_docker-compose.sh scripts)
TZ is specific to each hub/device location and is required as part of the InluxDB query to identify day breaks and other 12/24 hour interval groups. For dashboards with multiple devices in different time zones, you may need to switch the time zones from the top drop-down to correctly group midnight/noon periods.
See the open issues for a list of proposed features (and known issues).
Dave Schmid: @lux4rd0 - dave@pulpfree.org
Project Link: https://github.com/lux4rd0/weatherflow-collector
- Grafana Labs - https://grafana.com/
- Grafana - https://grafana.com/oss/grafana/
- Grafana Dashboard Community - https://grafana.com/grafana/dashboards/

