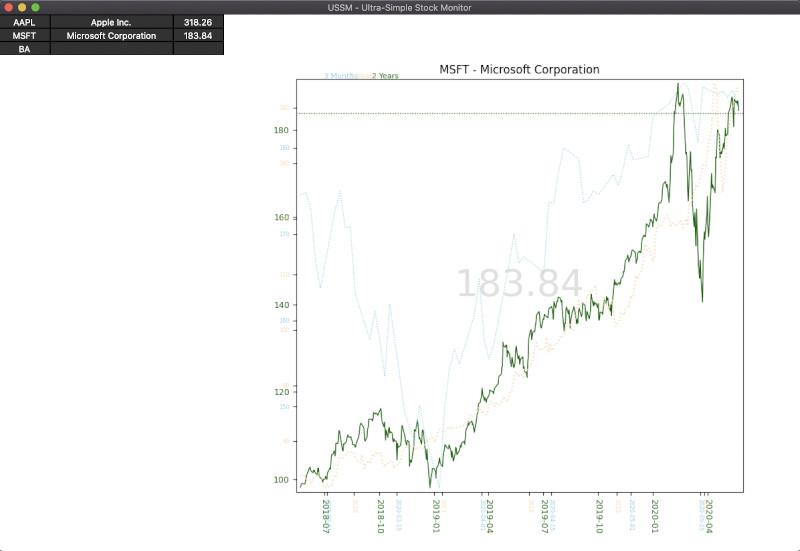
Small'n fancy afternoon'ish-project Python script that monitors a list of stock quotes. Focus is on long-term behaviour and not short term-fluctuations.
Displays 5y,2y and 3mo price history, auto-circles over all quotes every 15 seconds, downloads the data from YAHOO every hour. Click on the symbol in the left-handle table displays this plot. Clicking in the plot suspends the auto-advance for a minute.
Configuration at the top of the script itself. Tickers loaded from text file passed to the script, one ticker per line.
Uses the tkinter (Tk interface), Matplotlib and the yahooquery package, which have to be installed.
