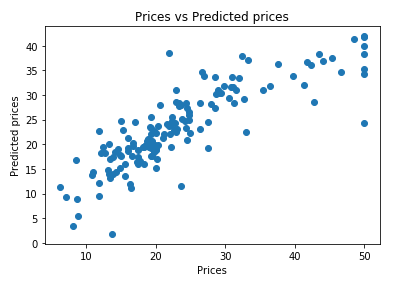
This project applies basic machine learning concepts on data collected for housing prices in the Boston, Massachusetts area to predict the selling price of a new home.
The dataset used in this project comes from the UCI Machine Learning Repository. This data was collected in 1978 and each of the 506 entries represents aggregate information about 14 features of homes from various suburbs located in Boston. The features can be summarized as follows:
- CRIM: This is the per capita crime rate by town
- ZN: This is the proportion of residential land zoned for lots larger than 25,000 sq.ft.
- INDUS: This is the proportion of non-retail business acres per town.
- CHAS: This is the Charles River dummy variable (this is equal to 1 if tract bounds river; 0 otherwise)
- NOX: This is the nitric oxides concentration (parts per 10 million)
- RM: This is the average number of rooms per dwelling
- AGE: This is the proportion of owner-occupied units built prior to 1940
- DIS: This is the weighted distances to five Boston employment centers
- RAD: This is the index of accessibility to radial highways
- TAX: This is the full-value property-tax rate per $10,000
- PTRATIO: This is the pupil-teacher ratio by town
- B: This is calculated as 1000(Bk — 0.63)², where Bk is the proportion of people of African American descent by town
- LSTAT: This is the percentage lower status of the population
- MEDV: This is the median value of owner-occupied homes in $1000s
- Linear Regression
- Decision Tree
