Contributor:
- Raul Eulogio
I created this repo as a way to get better acquainted with Python (Specifically 3.5.2) as a language and as a tool for data analysis. But it eventually became in exercise in utilizing various programming languages for machine learning applications.
I employed four Machine Learning techniques:
- Kth Nearest Neighbor
- Random Forest
- Neural Networks
If you would like to see a walk through of the analysis on inertia7 includes running code as well as explanations for algorithms and processes.
The repository includes the scripts folder which contains scripts for these programming languages (in order of most detailed):
- Python
- R
- PySpark
This repo is primarily concerned with the python iteration.
The multiple python script is broken into 5 sections (done by creating a scipt for each section) in the following order:
- Exploratory Analysis
- Kth Nearest Neighbors
- Random Forest
- Neural Networks
- Comparing Models
NOTE: The helper_functions.py script automates a lot of the processes and is used heavily in the other scripts. So if you want to see how my user made functions work, definitely check it out.
It goes without saying that a virtualenv is needed where you will download the necessary packages from the requirements.txt using:
pip3 install -r requirements.txt
Once this is done you can run the scripts using the usual terminal command:
$ python3 exploratory_analysis.py
NOTE: You can also run it by making script executable as such:
$ chmod +x exploratory_analysis.py
Remember: You must have a shebang for this to run i.e. this must be at the very beginning of your script:
#!/usr/bin/env python3
then you would simply just run it (I'll use Random Forest as an example)
$ ./random_forest.py
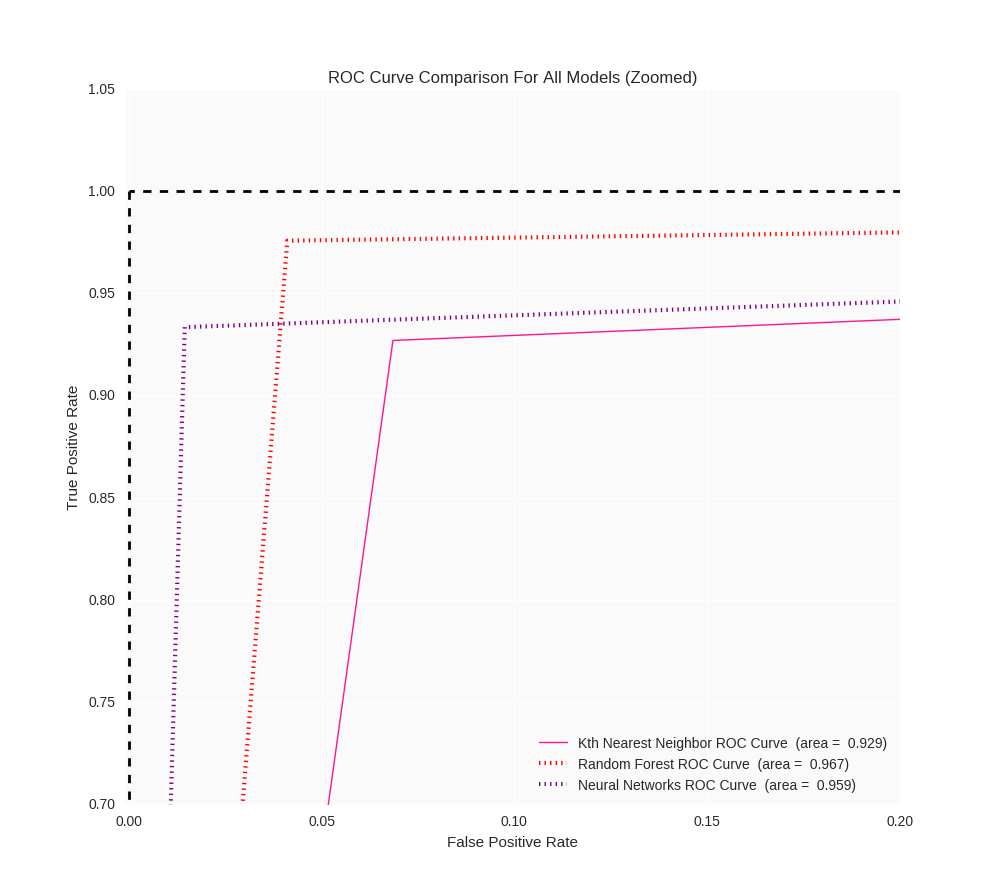
Once I employed all these methods, we can get a better feel for the data. Each model provided useful features that are useful in real world applications. Random forest helps us see what variables were the most important when predicting the diagnoses, which is useful to help researchers know what variables are important and ultimately feature engineering. Kth Nearest Neighbor provides the best predictive power in terms of cross validation, which is our strongest metric when evaluating models. And Neural Networks provides the least false negatives which is important in this respective case study since a false negative can result in death.
| Model/Algorithm | Test Error Rate | False Negative for Test Set | Area under the Curve for ROC | Cross Validation Score | Hyperparameter Optimization |
|---|---|---|---|---|---|
| Kth Nearest Neighbor | 0.07 | 5 | 0.929 | Accuracy: 0.925 (+/- 0.025) | Optimal K is 3 |
| Random Forest | 0.035 | 3 | 0.967 | Accuracy: 0.963 (+/- 0.013) | {'bootstrap': True, 'criterion': 'entropy', 'max_depth': 4} |
| Neural Networks | 0.035 | 1 | 0.959 | Accuracy: 0.967 (+/- 0.011) | {'hidden_layer_sizes': 12, 'activation': 'tanh', 'learning_rate_init': 0.05} |
The ROC Curves are more telling of Random Forest being a better model for predicting.
Any feedback is welcomed!
Things to do:
- Create new Jupter Notebook to reflect changes made since newest iteration (7/14/2017)
- Add unit testing if appropriate after research
- Update inertia7 project
- More detailed conclusion

