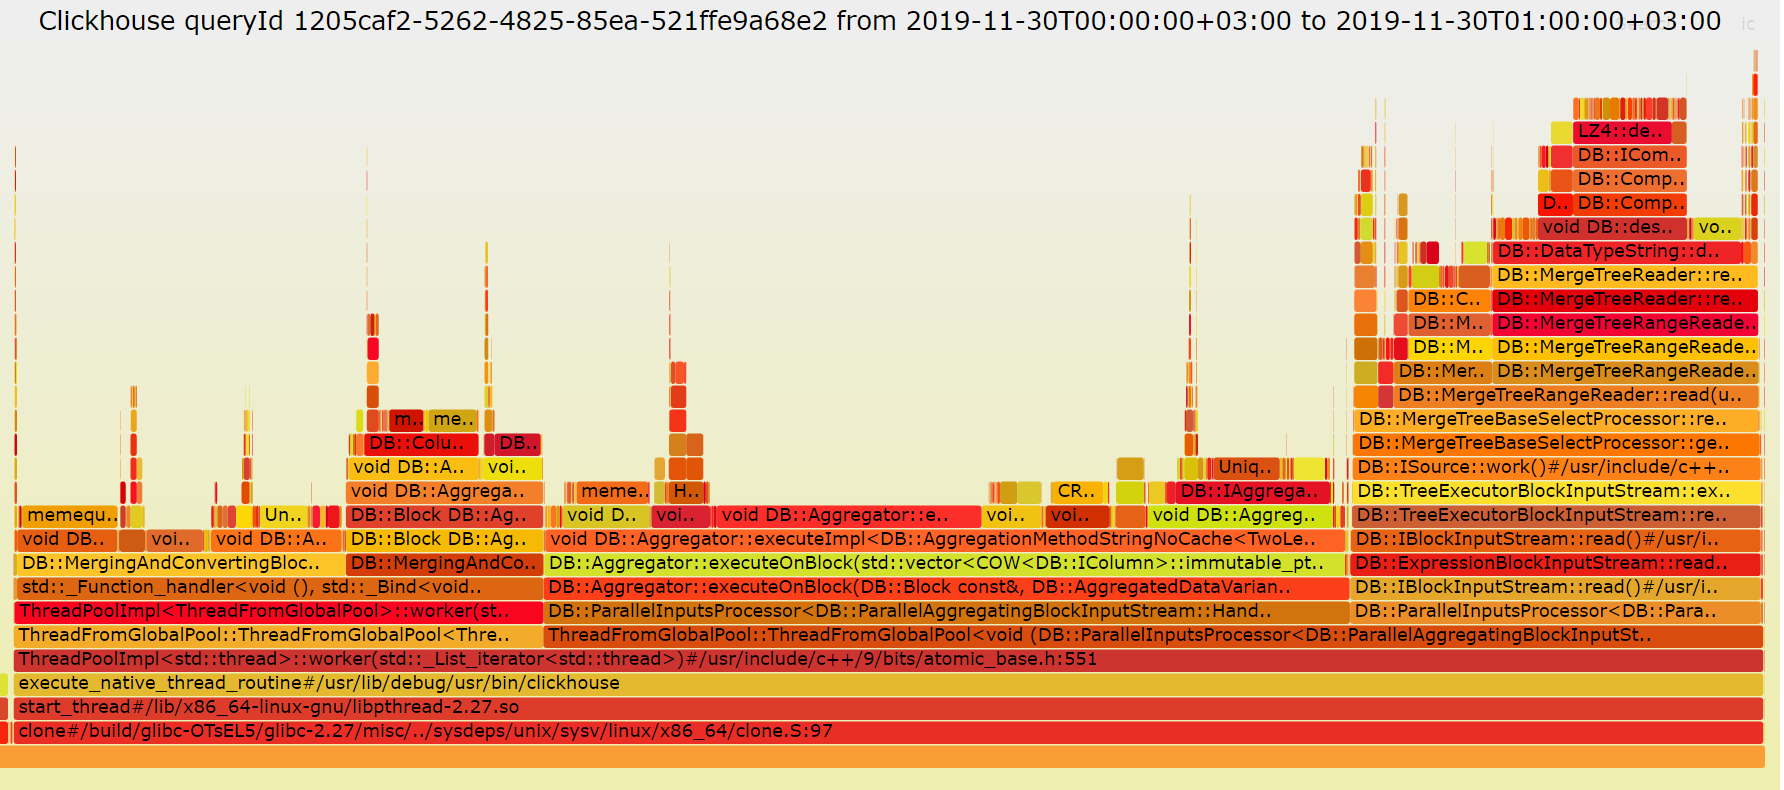
command line utility for visualizing clickhouse system.trace_log as flamegraph, thanks https://gist.github.com/alexey-milovidov/92758583dd41c24c360fdb8d6a4da194 for original idea
- install
clickhouse-serverpackage version 20.6 or higher how described in documentation - enable query_log and sampling profiling in settings on each server in your cluster for example add following files:
<yandex>
    <!-- Simple server-wide memory profiler. Collect a stack trace at every peak allocation step (in bytes).
         Data will be stored in system.trace_log table with query_id = empty string.
         Zero means disabled. Minimal effective value is 4 MiB.
         Data will dump with 'Memory' trace_type
      -->
    <total_memory_profiler_step>4194304</total_memory_profiler_step>
    <!-- Collect random allocations and deallocations and write them into system.trace_log with 'MemorySample' trace_type.
            The probability is for every alloc/free regardless to the size of the allocation.
            Note that sampling happens only when the amount of untracked memory exceeds the untracked memory limit,
             which is 4 MiB by default but can be lowered if 'total_memory_profiler_step' is lowered.
            You may want to set 'total_memory_profiler_step' to 1 for extra fine grained sampling.
         -->
    <total_memory_tracker_sample_probability>0.01</total_memory_tracker_sample_probability>
</yandex>
create /etc/clickhouse-server/users.d/profiling.xml (config reloaded every 1sec or via SYSTEM CONFIG RELOAD)
<yandex>
    <profiles>
        <default>
            <log_queries>1</log_queries>
            <allow_introspection_functions>1</allow_introspection_functions>
            <!-- 25 times per second sampling profiler -->
            <query_profiler_real_time_period_ns>40000000</query_profiler_real_time_period_ns>
            <query_profiler_cpu_time_period_ns>40000000</query_profiler_cpu_time_period_ns>

            <!-- memory profiling for each query, dump stack trace when 1MiB allocation with query_id not empty
            Whenever query memory usage becomes larger than every next step in number of bytes the memory profiler
            will collect the allocating stack trace.
            Zero means disabled memory profiler.
            Values lower than a few megabytes will slow down query processing.
            -->
            <memory_profiler_step>1048576</memory_profiler_step>
            <!-- Small allocations and deallocations are grouped in thread local variable and tracked or profiled only
                when amount (in absolute value) becomes larger than specified value.
                If the value is higher than 'memory_profiler_step' it will be effectively lowered to 'memory_profiler_step'.
            -->
            <max_untracked_memory>1048576</max_untracked_memory>
            <!-- Collect random allocations and deallocations and write them into system.trace_log with 'MemorySample' trace_type.
                 The probability is for every alloc/free regardless to the size of the allocation.
                 Note that sampling happens only when the amount of untracked memory exceeds 'max_untracked_memory'.
                 You may want to set 'max_untracked_memory' to 0 for extra fine grained sampling. -->
            <memory_profiler_sample_probability>0.01</memory_profiler_sample_probability>

        </default>
    </profiles>
</yandex>currently clickhouse-flamegraph required perl and flamegraph.pl for correct work, you can just download latest packages from https://github.com/Slach/clickhouse-flamegraph/releases
curl -sL https://raw.githubusercontent.com/Slach/clickhouse-flamegraph/master/install.sh | sudo bashPKG_MANAGER=$(command -v dpkg || command -v rpm)
PKG_EXT=$(if [[ "${PKG_MANAGER}" == "/usr/bin/dpkg" ]]; then echo "deb"; else echo "rpm"; fi)
cd $TEMP
echo "$(curl -sL https://github.com/Slach/clickhouse-flamegraph/releases/latest | grep href | grep -E "\\.rpm|\\.deb|\\.txt" | cut -d '"' -f 2)" | sed -e "s/^\\/Slach/https:\\/\\/github.com\\/Slach/" | wget -nv -c -i -
grep $PKG_EXT clickhouse-flamegraph_checksums.txt | sha256sum
${PKG_MANAGER} -i clickhouse-flamegraph*.${PKG_EXT}brew install wget
cd $TEMP
echo "$(curl -sL https://github.com/Slach/clickhouse-flamegraph/releases/latest | grep href | grep -E "darwin_amd64\\.tar\\.gz|\\.txt" | cut -d '"' -f 2)" | sed -e "s/^\\/Slach/https:\\/\\/github.com\\/Slach/" | wget -nv -c -i -
grep darwin_amd64.tar.gz clickhouse-flamegraph_checksums.txt | sha256sum
tar -xvfz -C /usr/bin clickhouse-flamegraph*darwin_amd64.tar.gzinstall CYGWIN https://cygwin.com/install.html from setup.exe install following packages:
- wget
- sha256sum
- bash run following script
cd $TEMP
echo "$(curl -sL https://github.com/Slach/clickhouse-flamegraph/releases/latest | grep href | grep -E "windows_amd64\\.tar\\.gz|\\.txt" | cut -d '"' -f 2)" | sed -e "s/^\\/Slach/https:\\/\\/github.com\\/Slach/" | wget -nv -c -i -
grep windows_amd64.tar.gz clickhouse-flamegraph_checksums.txt | sha256sum
tar -xvfz -C /usr/bin clickhouse-flamegraph*windows_amd64.tar.gzUSAGE:
clickhouse-flamegraph [global options] command [command options] [arguments...]
GLOBAL OPTIONS:
--width value width of image (default 1200) (default: 1200)
--height value height of each frame (default 16) (default: 16)
--flamegraph-script value path of flamegraph.pl. if not given, find the script from $PATH [%CH_FLAME_FLAMEGRAPH_SCRIPT%]
--output-dir value, -o value destination path of generated flamegraphs files (default: "./clickhouse-flamegraphs/") [%CH_FLAME_OUTPUT_DIR%]
--date-from value, --from value filter system.trace_log from date in any parsable format, see https://github.com/araddon/dateparse (default: "2020-10-13 09:55:00 +0500") [%CH_FLAME_DATE_FROM%]
--date-to value, --to value filter system.trace_log to date in any parsable format, see https://github.com/araddon/dateparse (default: "2020-10-13 10:00:00 +0500") [%CH_FLAME_DATE_TO%]
--query-filter value, --query-regexp value filter system.query_log by any regexp, see https://github.com/google/re2/wiki/Syntax [%CH_FLAME_QUERY_FILTER%]
--query-ids value, --query-id value filter system.query_log by query_id field, comma separated list [%CH_FLAME_QUERY_IDS%]
--trace-types value, --trace-type value filter system.trace_log by trace_type field, comma separated list (default: "Real", "CPU", "Memory", "MemorySample") [%CH_FLAME_TRACE_TYPES%]
--clickhouse-dsn value, --dsn value clickhouse connection string, see https://github.com/mailru/go-clickhouse#dsn (default: "http://localhost:8123/default") [%CH_FLAME_CLICKHOUSE_DSN%]
--clickhouse-cluster value, --cluster value clickhouse cluster name from system.clusters, all flame graphs will get from cluster() function, see https://clickhouse.com/docs/en/sql-reference/table-functions/cluster [%CH_FLAME_CLICKHOUSE_CLUSTER%]
--tls-certificate value X509 *.cer, *.crt or *.pem file for https connection, use only if tls_config exists in --dsn, see https://clickhouse.com/docs/en/operations/server-configuration-parameters/settings/#server_configuration_parameters-openssl for details [%CH_FLAME_TLS_CERT%]
--tls-key value X509 *.key file for https connection, use only if tls_config exists in --dsn [%CH_FLAME_TLS_KEY%]
--tls-ca value X509 *.cer, *.crt or *.pem file used with https connection for self-signed certificate, use only if tls_config exists in --dsn, see https://clickhouse.com/docs/en/operations/server-configuration-parameters/settings/#server_configuration_parameters-openssl for details [%CH_FLAME_TLS_CA%]
--output-format value, --format value accept values: svg, txt (see https://github.com/brendangregg/FlameGraph#2-fold-stacks), json (see https://github.com/spiermar/d3-flame-graph/#input-format, (default: "svg") [%CH_FLAME_OUTPUT_FORMAT%]
--normalize-query, --normalize group stack by normalized queries, instead of query_id, see https://clickhouse.com/docs/en/sql-reference/functions/string-functions/#normalized-query (default: false) [%CH_FLAME_NORMALIZE_QUERY%]
--debug, --verbose show debug log (default: false) [%CH_FLAME_DEBUG%]
--console output logs to console format instead of json (default: false) [%CH_FLAME_LOG_TO_CONSOLE%]
--help, -h show help (default: false)
--version, -v print the version (default: false)
- When you can't change
/etc/clickhouse-server/*.xmlfiles on server, just addSETTINGS query_profiler_real_time_period_ns=40000000, query_profiler_cpu_time_period_ns=40000000to end of your SQL query. And run following command
clickhouse-flamegraph --dsn=tcp://clickhouse-server:9000/?pool_size=1
- For check all settings in server set properly run following SQL query on your ClickHouse server
SELECT * FROM system.settings WHERE match(name,'introspection|log_queries|profiler|sample') FORMAT Vertical- implement json format and webhooks
- try implement interactive dashboard with http://dash.plot.ly
- try integrate with https://github.com/samber/grafana-flamegraph-panel
