IPython magics for rendering diagrams from simple scripts in Jupyter notebooks using various JavaScript diagram generators.
Simple magics for rendering diagrams from line and cell magics using the following JavaScript diagram generators:
- Mermaid.js: a wide variety of diagram types, including flowcharts, sequence diagrams, entity relationship diagrams
- flowchart.js: flowchart generator
- wavedrom: timing diagram generator
- waversurfer.js: audio waveform visualisation
Install from PyPi as: pip install --upgrade nb-js-diagrammers
Install direct from this repository as:
pip install --upgrade git+https://github.com/innovationOUtside/nb_js_diagrammers.git
or:
pip install --upgrade https://github.com/innovationOUtside/nb_js_diagrammers/archive/main.zip
Load the magics into a notebook using:
%load_ext nb_js_diagrammers
All magics support a -o / --outfile that can be used to specify the name of a generated html file that is then embedded in the notebook via an iframe. If no filename is specified, a filename with a randomly generated UID based will be created.
You can then generate diagrams using the appropriate diagram syntax and block magic.
The flowchart_magic, mermaid_magic and wavedrom_magic also act as line magics. Put the diagram script into a variable (my_script) then call as %mermaid_magic --src my_script -h 1000 etc.
Note that for block magics, the code cell MUST start the %% - even blank lines and comment lines preceding the the block magic will raise an error.
%%flowchart_magic -h 100 -o flowchart.html

st=>start: Start
e=>end: End
op1=>operation: Generate
op2=>parallel: Evaluate
st(right)->op1(right)->op2
op2(path1, top)->op1
op2(path2, right)->e
%%wavedrom_magic -h 100

{ signal : [
  { name: "clk",  wave: "p......" },
  { name: "bus",  wave: "x.34.5x",   data: "head body tail" },
  { name: "wire", wave: "0.1..0." },
]}
%%mermaid_magic -h 500

flowchart TD
    A[Start] --> B{Is it?};
    B -->|Yes| C[OK];
    C --> D[Rethink];
    D --> B;
    B ---->|No| E[End];
%%mermaid_magic -h 250

graph TD;
    A-->B;
    A-->C;
    B-->D;
    C-->D;
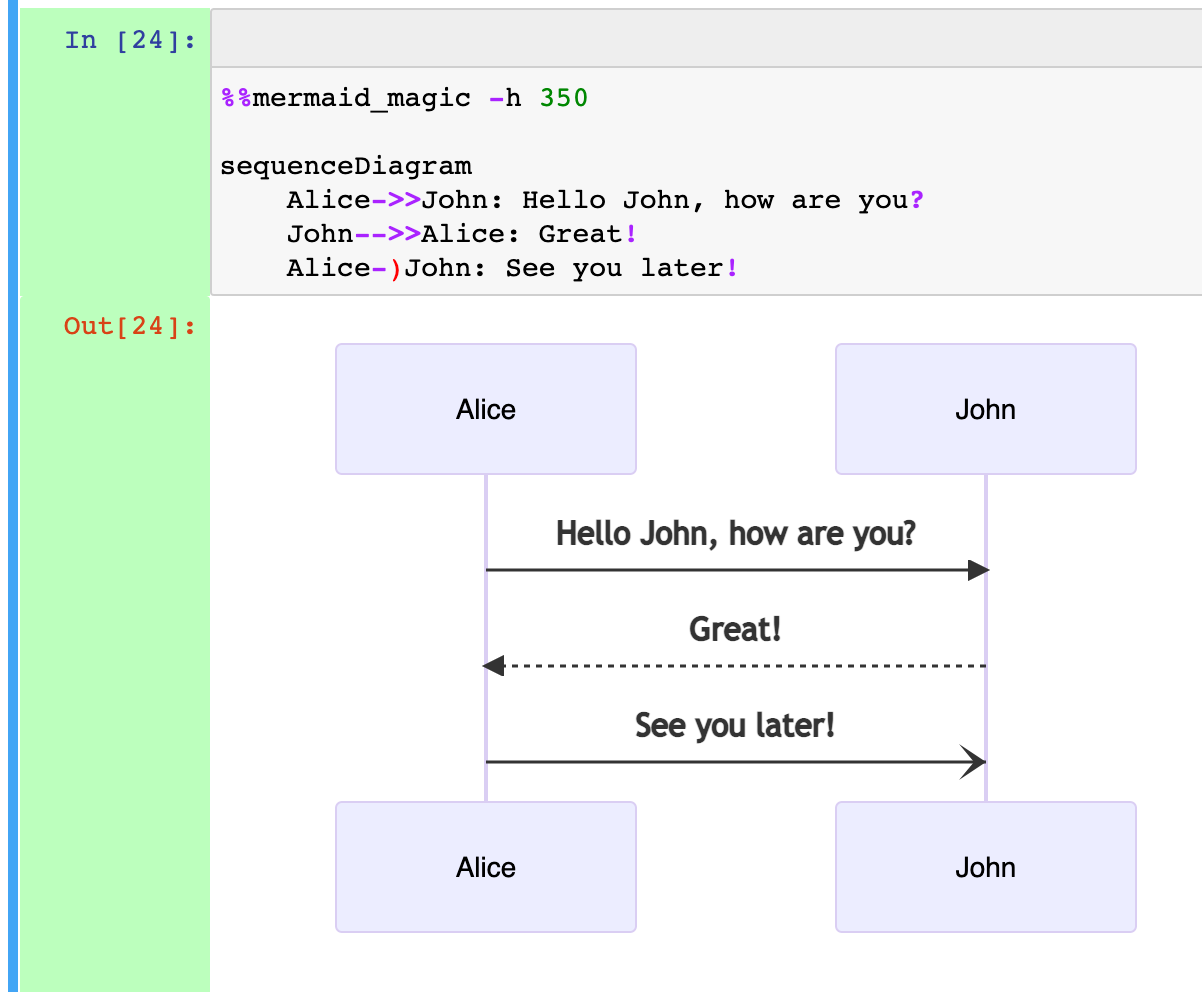
%%mermaid_magic -h 350

sequenceDiagram
    Alice->>John: Hello John, how are you?
    John-->>Alice: Great!
    Alice-)John: See you later!
%%mermaid_magic -h 330

erDiagram
    CUSTOMER ||--o{ ORDER : places
    CUSTOMER {
        string name
        string custNumber
        string sector
    }
    ORDER {
        int orderNumber
        string deliveryAddress
    }
%wavesurfer_magic -f https://ia802606.us.archive.org/35/items/shortpoetry_047_librivox/abou_ben_adhem_hunt_mlb.mp3
An additional magic is provided that uses the pyflowchart package to generate a flowchart describing Python code cell in an appropriately magicked code cell:
%%pyflowchart_magic -h 800
import time

def demo(msg='demo'):
    for i in range(10):
        print(f'{msg} loopcount is {i}')
        time.sleep(i)
The -x / --execute flag will execute the code in the current notebook scope. Without the flag, the code is not executed.
More clunkily, we can also grab and chart code from an executed code cell using the following recipe (this captures cell content from the previously executed cell):
%%capture code
# This gets the content of the previous cell
# and stores it in the variable: code
%history -l 1
We can then render a flowchart from the captured code cell content:
from pyflowchart import Flowchart

from nb_js_diagrammers.flowchartjs import TEMPLATE_FLOWCHARTJS
from nb_js_diagrammers.magics import js_ui

# Generate a flowchart from the grabbed code
fc = Flowchart.from_code(code.stdout)

# Render the flowchart via an external, IFrame embedded HTML page - DEPRECATED
# (Code in package but commented out)
#js_ui({"src":fc.flowchart()}, TEMPLATE_FLOWCHARTJS, height=800)

# Render flowchart via repr_html IFrame with html in srcdoc
diagram = JSDiagram(fc.flowchart()}, TEMPLATE_FLOWCHARTJS, height=200)
diagram
We can also save the HTML to a file:
diagram.save_html("myfile.html")To generate static image files using mermaid.js, see: https://github.com/mermaid-js/mermaid-cli
The wavedrom images have a save as png or SVG option (right click over diagram)
A Simple Pattern for Embedding Third Party Javascript Generated Graphics in Jupyter Notebooks
Previewing Sphinx and Jupyter Book Rendered Mermaid and Wavedrom Diagrams in VS Code


