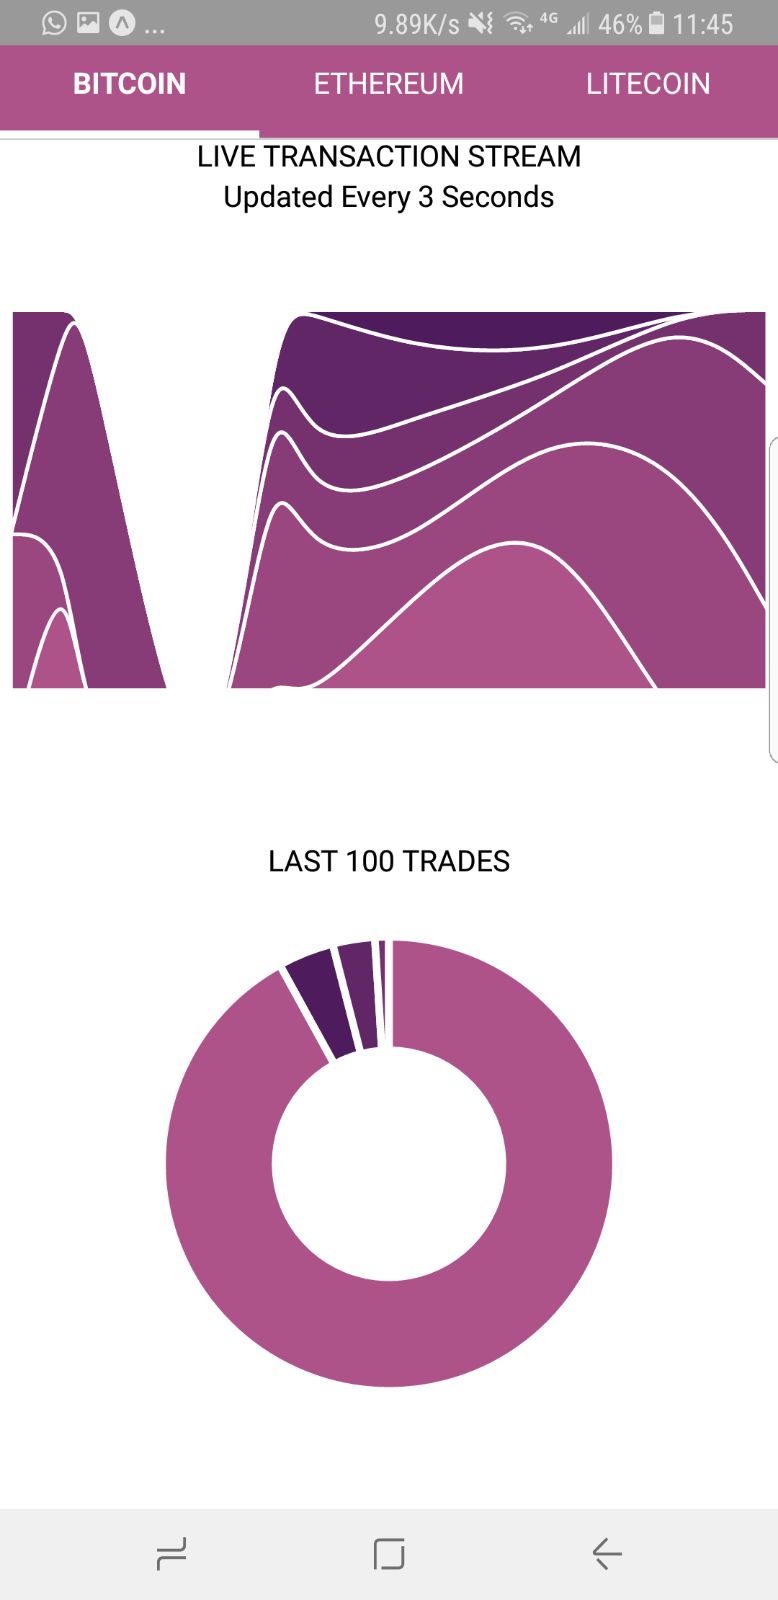
This project uses crypto transaction data from gdax and visualises it in two seperate graphs using D3 and react native ART for SVG.
Upper Graph: stack chart
Lower Graph: donut chart The lower graph animates between values using the Morph.Tween method of ART
To run on pc you must have react-native and android-studio installed. More info on react native page https://facebook.github.io/react-native/docs/getting-started.html
In terminal
- npm i
- react-native run-android
On your Smartphone
- download app-release.apk in the root directory to run on your phone!
Initially I used Morph.Tween to animate the upper stack chart. However, due to it being very non performant I removed this functionality.
In the future I would consider using Animated + Native Driver + Transforms as described in: https://engineering.salesforce.com/experiments-with-high-performance-animation-in-react-native-80a0cb7052b0
Further animation reading: https://medium.com/react-native-training/react-native-animations-using-the-animated-api-ebe8e0669fae
