Add performance instrumentation to ongoing metrics
jessicaschilling opened this issue · 15 comments
Per @atopal request, we need to add some form of site performance instrumentation to (at minimum) the primary IPFS websites going forward:
- New blog.ipfs.io
- Existing blog.ipfs.io (this may simply be some sort of baseline measurement, considering we are so close to relaunch)
- Existing ipfs.io (for comparison purposes)
- Replatformed ipfs.io
- docs.ipfs.io
Kicking this work off in this repo, since we're already doing a lot of pre-launch work on the blog.
@zebateira: Can you please research potential approaches? Some notes:
- @atopal is partial to SpeedCurve, but it's a commercial service with whom we don't currently have an account, so we should evaluate the larger landscape
- This is likely to scale to all PL websites, so a larger scope may be a cost consideration if we utilize a commercial service
- Data would be repurposed in our reporting dashboards, so bonus points for a programmatic way of getting it into Observable
@atopal: Please edit this comment or add additional comments for any other specs or notes. I'm tentatively labeling this as P2, on the assumption that it's acceptable to work on this post-blog-launch as long as payload problems in #41 are resolved for launch — but please revise if you feel this is needed sooner.
cc @terichadbourne @johnnymatthews @yusefnapora @johndmulhausen for context and/or discussion.
Thank you for this @jessicaschilling 🙏
Will comment with a proposal next week.
I’m not the best one to advise on the best providers in this space, but just wanted to call out that Countly does offer performance metrics as part of our existing enterprise edition contract: https://support.count.ly/hc/en-us/articles/900000819806-Performance-Monitoring
I’m not the best one to advise on the best providers in this space, but just wanted to call out that Countly does offer performance metrics as part of our existing enterprise edition contract: https://support.count.ly/hc/en-us/articles/900000819806-Performance-Monitoring
That is indeed a good point.
It provides us with basic performance indicators with the downside of not providing any immediate insight into specific changes of code (PR build checks), meaning we'd have to keep an eye on Countly stats (we could include it in the weekly email) and then debug accordingly if any performance issue surfaced.
Waiting to see results at a point after it's impacted the user isn't ideal.
After searching for a bit I realized most services (including SpeedCurve) actually use Google's Lighthouse under the hood, so I propose using lighthouse directly using a Github Action: https://github.com/GoogleChrome/lighthouse-ci
It will not provide historical data (unless we setup a server to store the data), but it flags when specific metrics go over a threshold and we can access the full lighthouse report which is what we need.
This integration could be applied to all the projects and we can run it once on the projects to deprecate so we can compare the results.
Example of how it would work can be see here: https://github.com/GoogleChrome/lighthouse-ci#features


I will address another important performance issue next: images.
UPDATE: by using Github Actions here and not running lighthouse directly on fleek will avoid increasing the preview deployment time, even though we will be building the app twice (once on fleek and another on github actions).
@zebateira @terichadbourne This sounds like a great starting point to help us evaluate how we want to use this info in the longer term - even if we don't have access to the historical data, we have an idea of how an individual PR might negatively impact performance.
That said, we need to defer to @atopal and @cwaring to make a decision on whether this is an adequate next step. Can you please weigh in?
The above suggested method for tracking performance of the website is a good starting point, but we can already predict one issue that will likely continue to occur frequently: image sizes.
Thank you @cwaring for the input 🙏
Compressing images
In order to reduce image payloads we should have an automatic process in place to compress and convert all the images when they are added on a blog post. We do have the image cropper which we could use it to also compress the image, but since this is not mandatory to use when creating a post in forestry, it can't be used to tackle this issue completely.
A common solution is to add this compression to the build process, but this is unnecessary processing – no need to keep the original version of the images on the repo.
A better solution might be to hook into the commit and compress the image automatically before they are committed, but I couldn't find any information how to do this with forestry in the docs?
I don't see an easy straightforward solution, but here are some other ideas:
- Create a Github Action that would run on a PR, compress the new images and commit them to the PR = completely automatic
- Make a requirement for content authors to compress the images (we could suggest ImageOptim – probably one of the simplest image compressors to use) before uploading them = not automatic at all
@zebateira I'm afraid requiring content authors to expand their workflow isn't really a viable option. A GitHub action also has the benefit of being able to be reused on other PL sites independent of Forestry, which is appealing. Any estimate of how long creating that might take?
A GitHub action also has the benefit of being able to be reused on other PL sites independent of Forestry, which is appealing. Any estimate of how long creating that might take?
There are some already built so we can probably find a good one and use it (example: Image Actions).
So I'd say it could be done in a day or two (depending if we bump into any permission issues that block configuration completely).
Would be good to try and get it to run before lighthouse so that the performance report would reflect the new compressed images.
I'm fine with the Github actions solution, but what's the problem with keeping the original image version in the repo?
Re performance: using Lighthouse is great, but it doesn't give you Real User Metrics (RUM). I don't have access to the Countly account to check, but when we last asked them, they didn't have basic things like "90th percentile for time to interactive". My recommendation would still be Speedcurve based on the conversation here, but I don't feel strongly about that tool in particular, just something that gives us basic RUM.
@zebateira and I had a quick chat about all this the other day.
A few notes to expand my thoughts:
-
80% improvements: all of our sites are built static-first without external dependencies by design, ensuring that a rouge http request can't block or slow down the rendering of a site, this gives us a huge advantage when it come to performance as the entire app is self-contained and can be loaded over IPFS and cached anywhere along the graph. Meaning that any slowness will stem from inefficiencies in the bundled assets (html, images, js payload etc) so focusing on optimising that first will result in the biggest gain for our users. Lighthouse does a stellar job reporting on this, so big +1 there.
-
20% improvements: The secondary bottleneck will be the gateway that our website is served from, we are moving away from using our internal infrastructure stack for this and using Fleek as they have productised deployment to IPFS and have a better CDN distribution than us (also higher uptime from recent observations).
With this in mind please ensure any client-side metric collection is all non-blocking and passive, so if a user has an ad-blocker enabled (brave) or is viewing the site offline everything still works smoothly.
🖼️ On images:
- It is nice to keep a higher resolution (or original) image around, mostly so that we have flexibility if we decide to change the site design format in the future, then we can re-process the original assets to match the new design formats. This is optional but should be considered.
- I'd prefer this to be a Github action that can be reused across other sites and it should only run when an image file is detected in the current commit range, to ensure we don't slow down rebuilds unnecessarily. Also if it only operates on branches then it keeps our master deploy process agnostic and simple; merge->build->deploy->dnslink->live 🥳
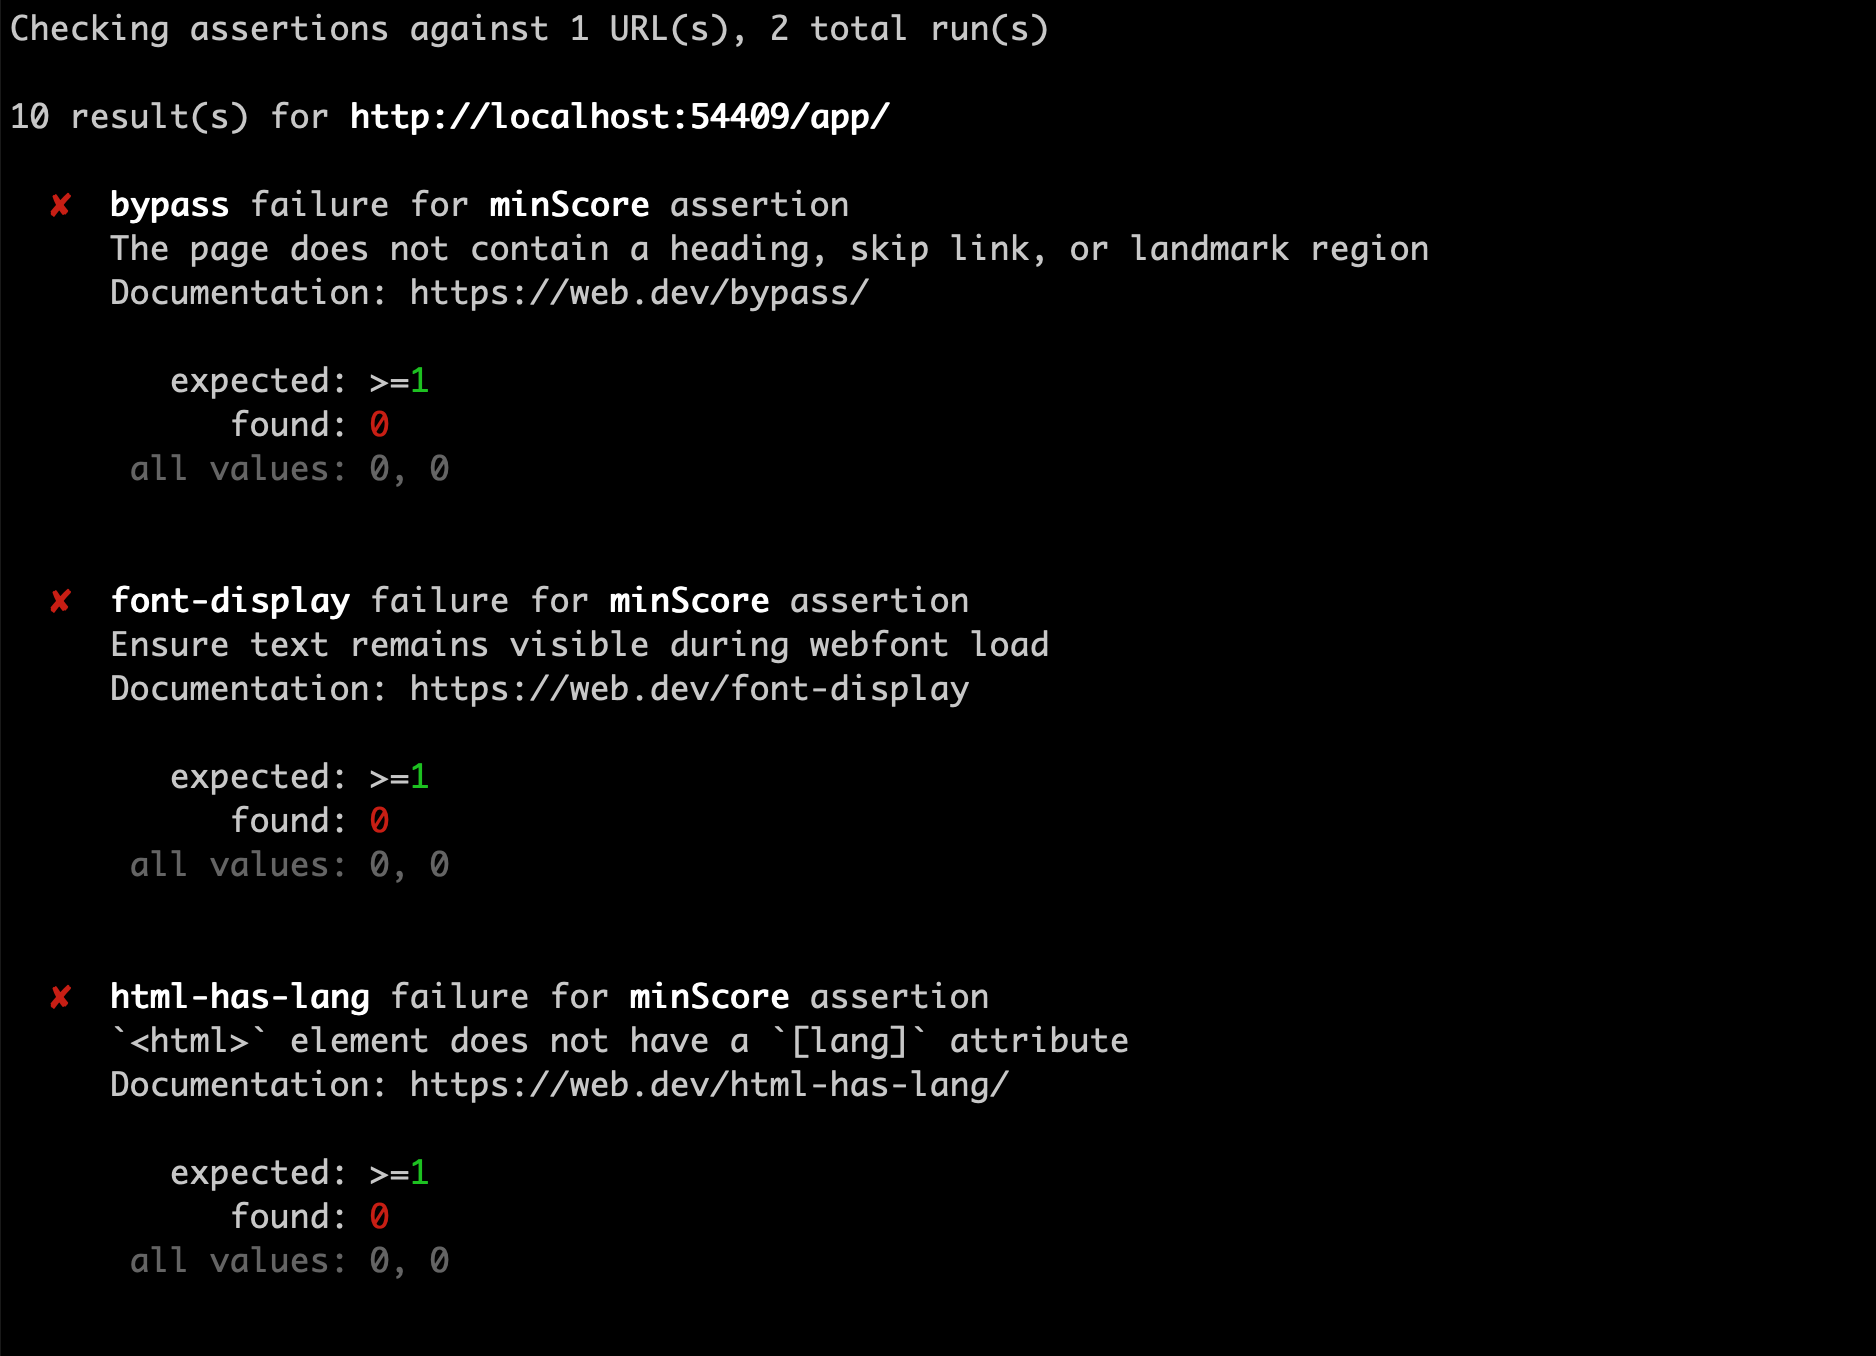
Here are the lighthouse metrics for the currently deployed blog.ipfs.io
- mobile: https://bafybeien4ks7xkg5iuvulfgdilb2sfgzj3gga6auikk7rjlbajrxuyhmja.ipfs.dweb.link/?filename=blog.ipfs.io-mobile.html
- desktop: https://bafybeie55gsncxf4yfxdzjzsir3sjzlqou64htijyxcf7svplaewthppjq.ipfs.dweb.link/?filename=blog.ipfs.io-desktop.html
This will serve as a very rudimentary basis of comparison to the new version.
@zebateira - I see you've already got an issue to add this to IPFS docs, and I added ipfs/ipfs-website#9 for the replatformed website. Are you OK closing this issue?
@jessicaschilling yes 👍