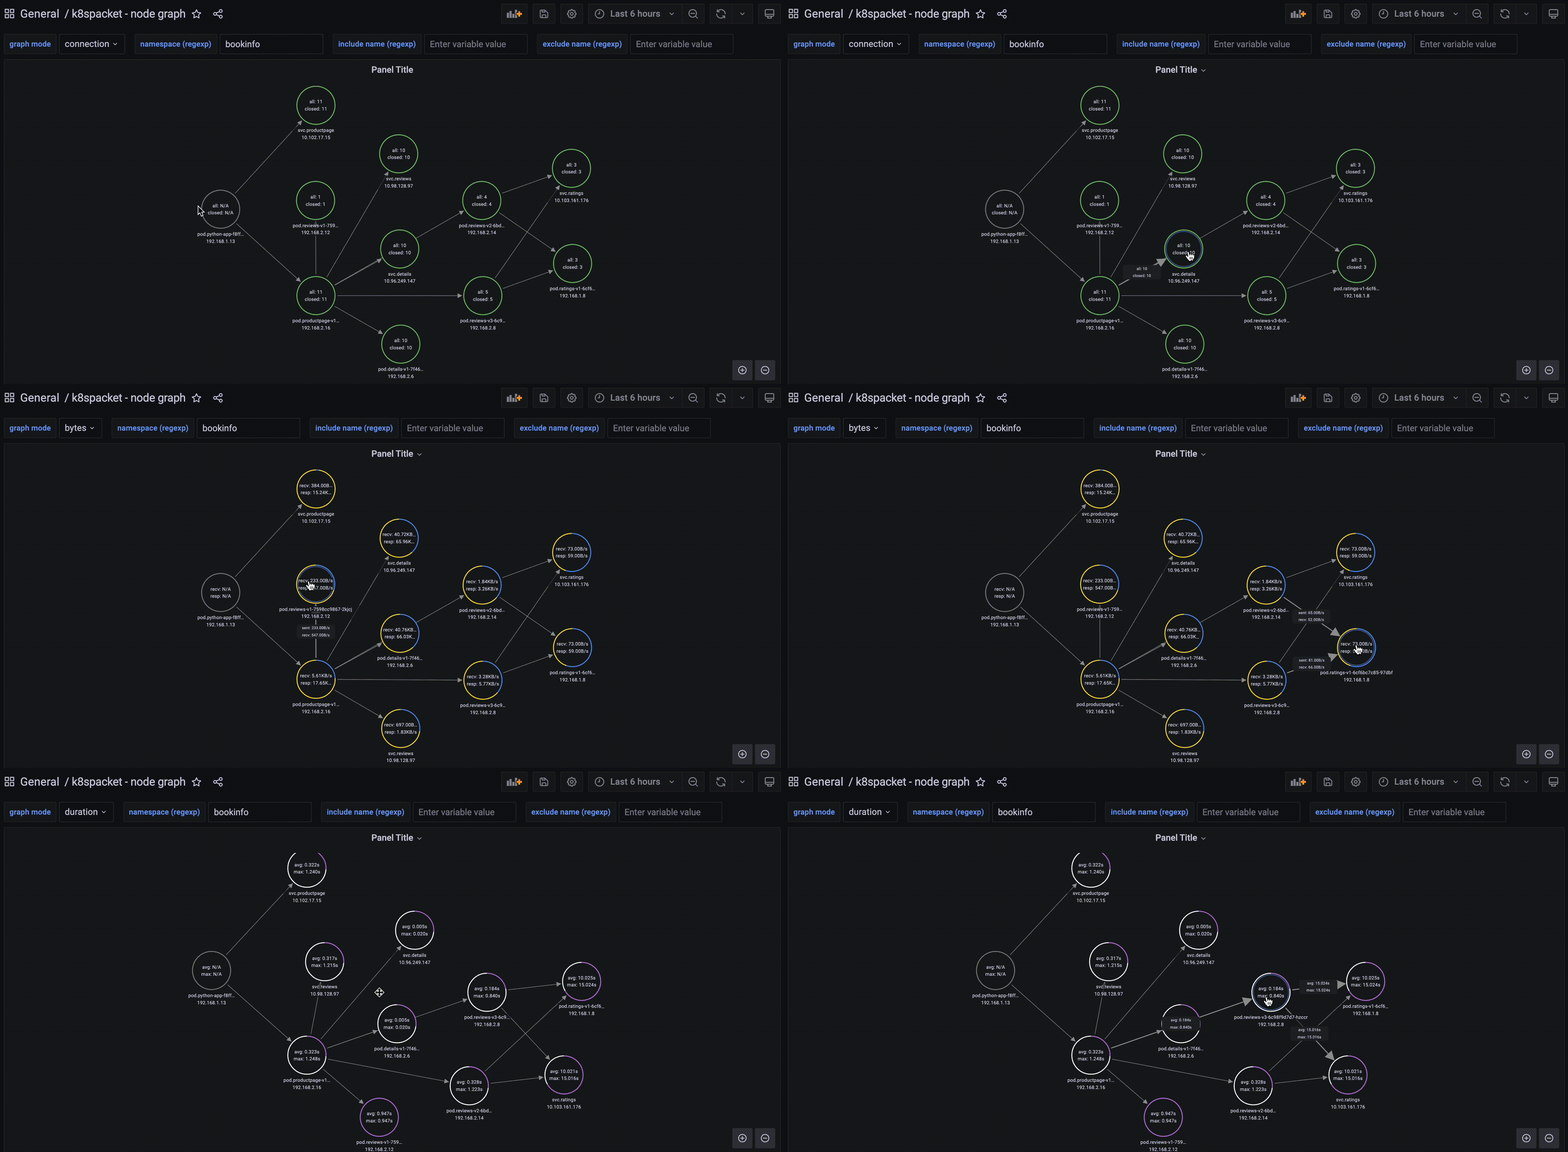
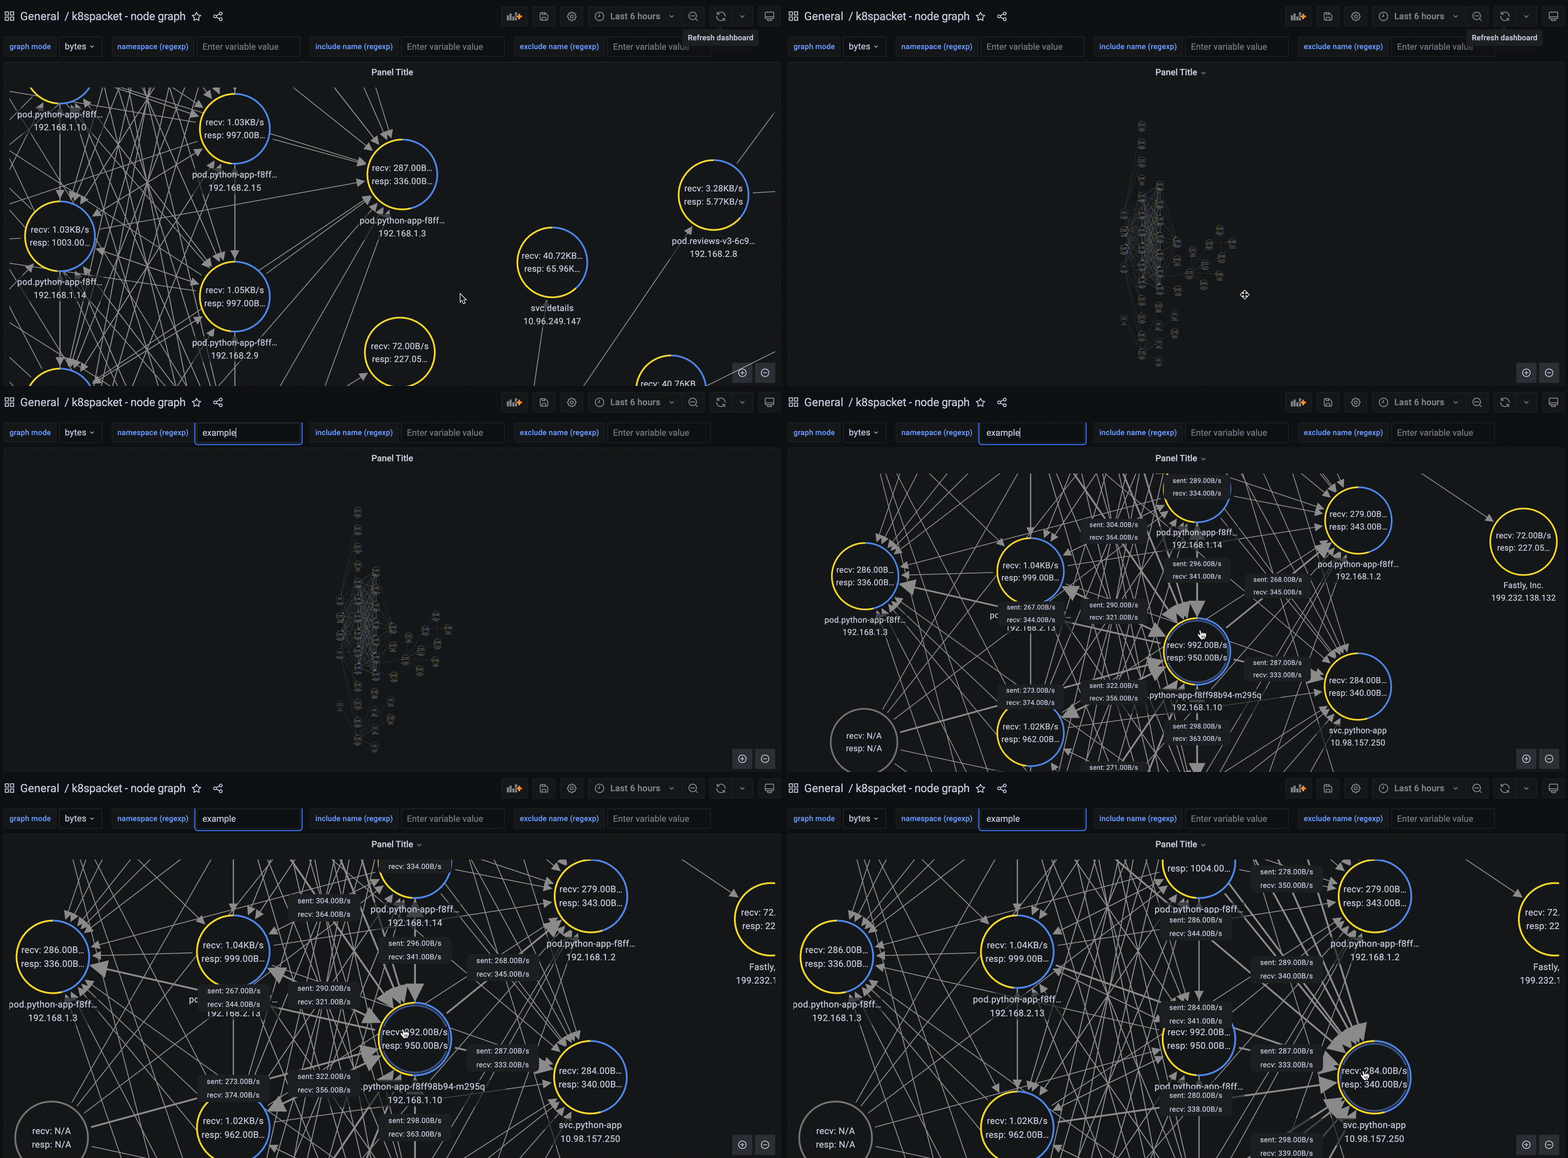
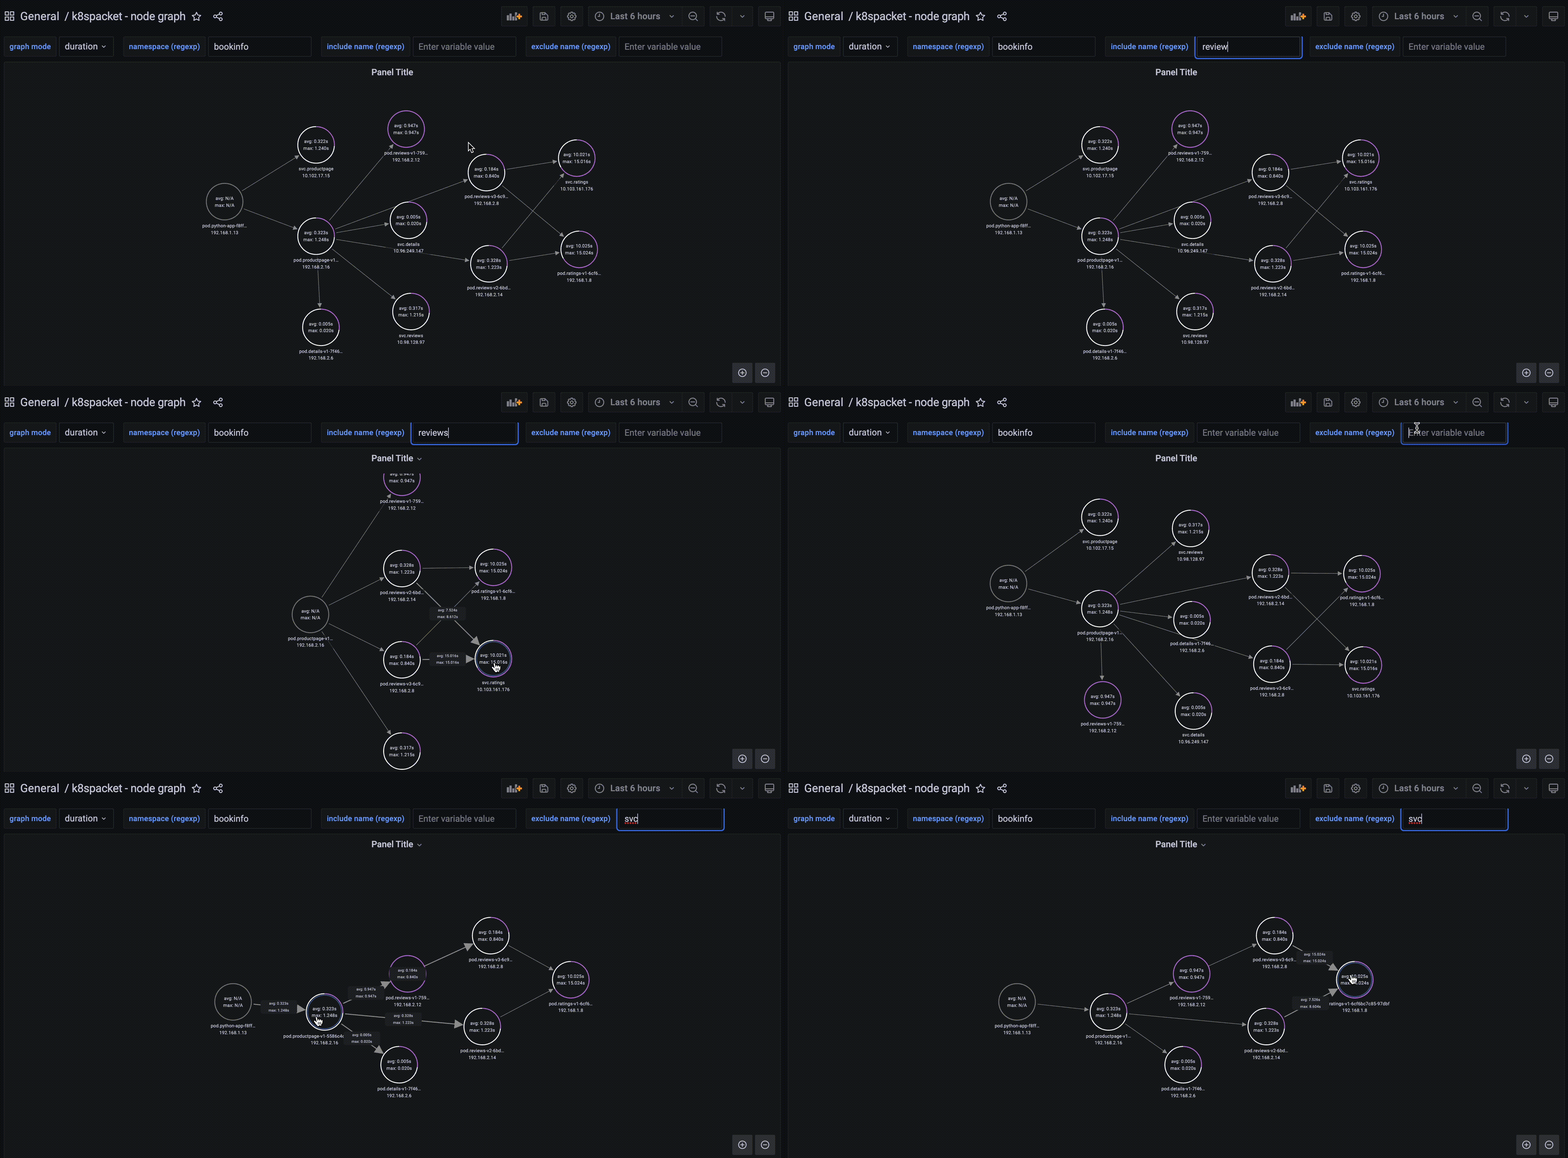
k8spacket helps to understand TCP packets traffic in your kubernetes cluster:
- shows traffic between workloads in the cluster
- informs where the traffic is routed outside the cluster
- displays information about closing sockets by connections
- shows how many bytes are sent/received by workloads
- calculates how long the connections are established
- displays the net of connections between workloads in the whole cluster
k8spacket uses Node Graph API Grafana datasource plugin. See details Node Graph API plugin
Install k8spacket using helm chart (https://github.com/k8spacket/k8spacket-helm-chart)
  helm repo add k8spacket https://k8spacket.github.io/k8spacket-helm-chart
  helm install k8spacket --namespace k8spacket k8spacket/k8spacket --create-namespace
Add the Node Graph API plugin and datasource to your Grafana instance. You can do it manually or change helm values for the Grafana chart, e.g.:
grafana:
  env:
    GF_INSTALL_PLUGINS: hamedkarbasi93-nodegraphapi-datasource
  datasources:
    nodegraphapi-plugin-datasource.yaml:
      apiVersion: 1
      datasources:
      - name: "Node Graph API"
        jsonData:
          url: "http://k8spacket.k8spacket.svc.cluster.local:8080"
        access: "proxy"
        basicAuth: false
        isDefault: false
        readOnly: false
        type: "hamedkarbasi93-nodegraphapi-datasource"
        typeLogoUrl: "public/plugins/hamedkarbasi93-nodegraphapi-datasource/img/logo.svg"
        typeName: "node-graph-plugin"
        orgId: 1
        version: 1
Add dashboards configmap to Grafana stack
kubectl -n $GRAFANA_NS apply --recursive -f ./dashboardsGo to k8spacket - node graph in Grafana Dashboards and use filters as below


