Visualization Library for building standard graphical representations of AIRR semantically structured data.
This visualization library parses AIRR DATA and enables a standard visual narrative for iReceptor Stats API.
The iReceptor Stats API definition can be found at the Github repository or through the Swagger Editor.
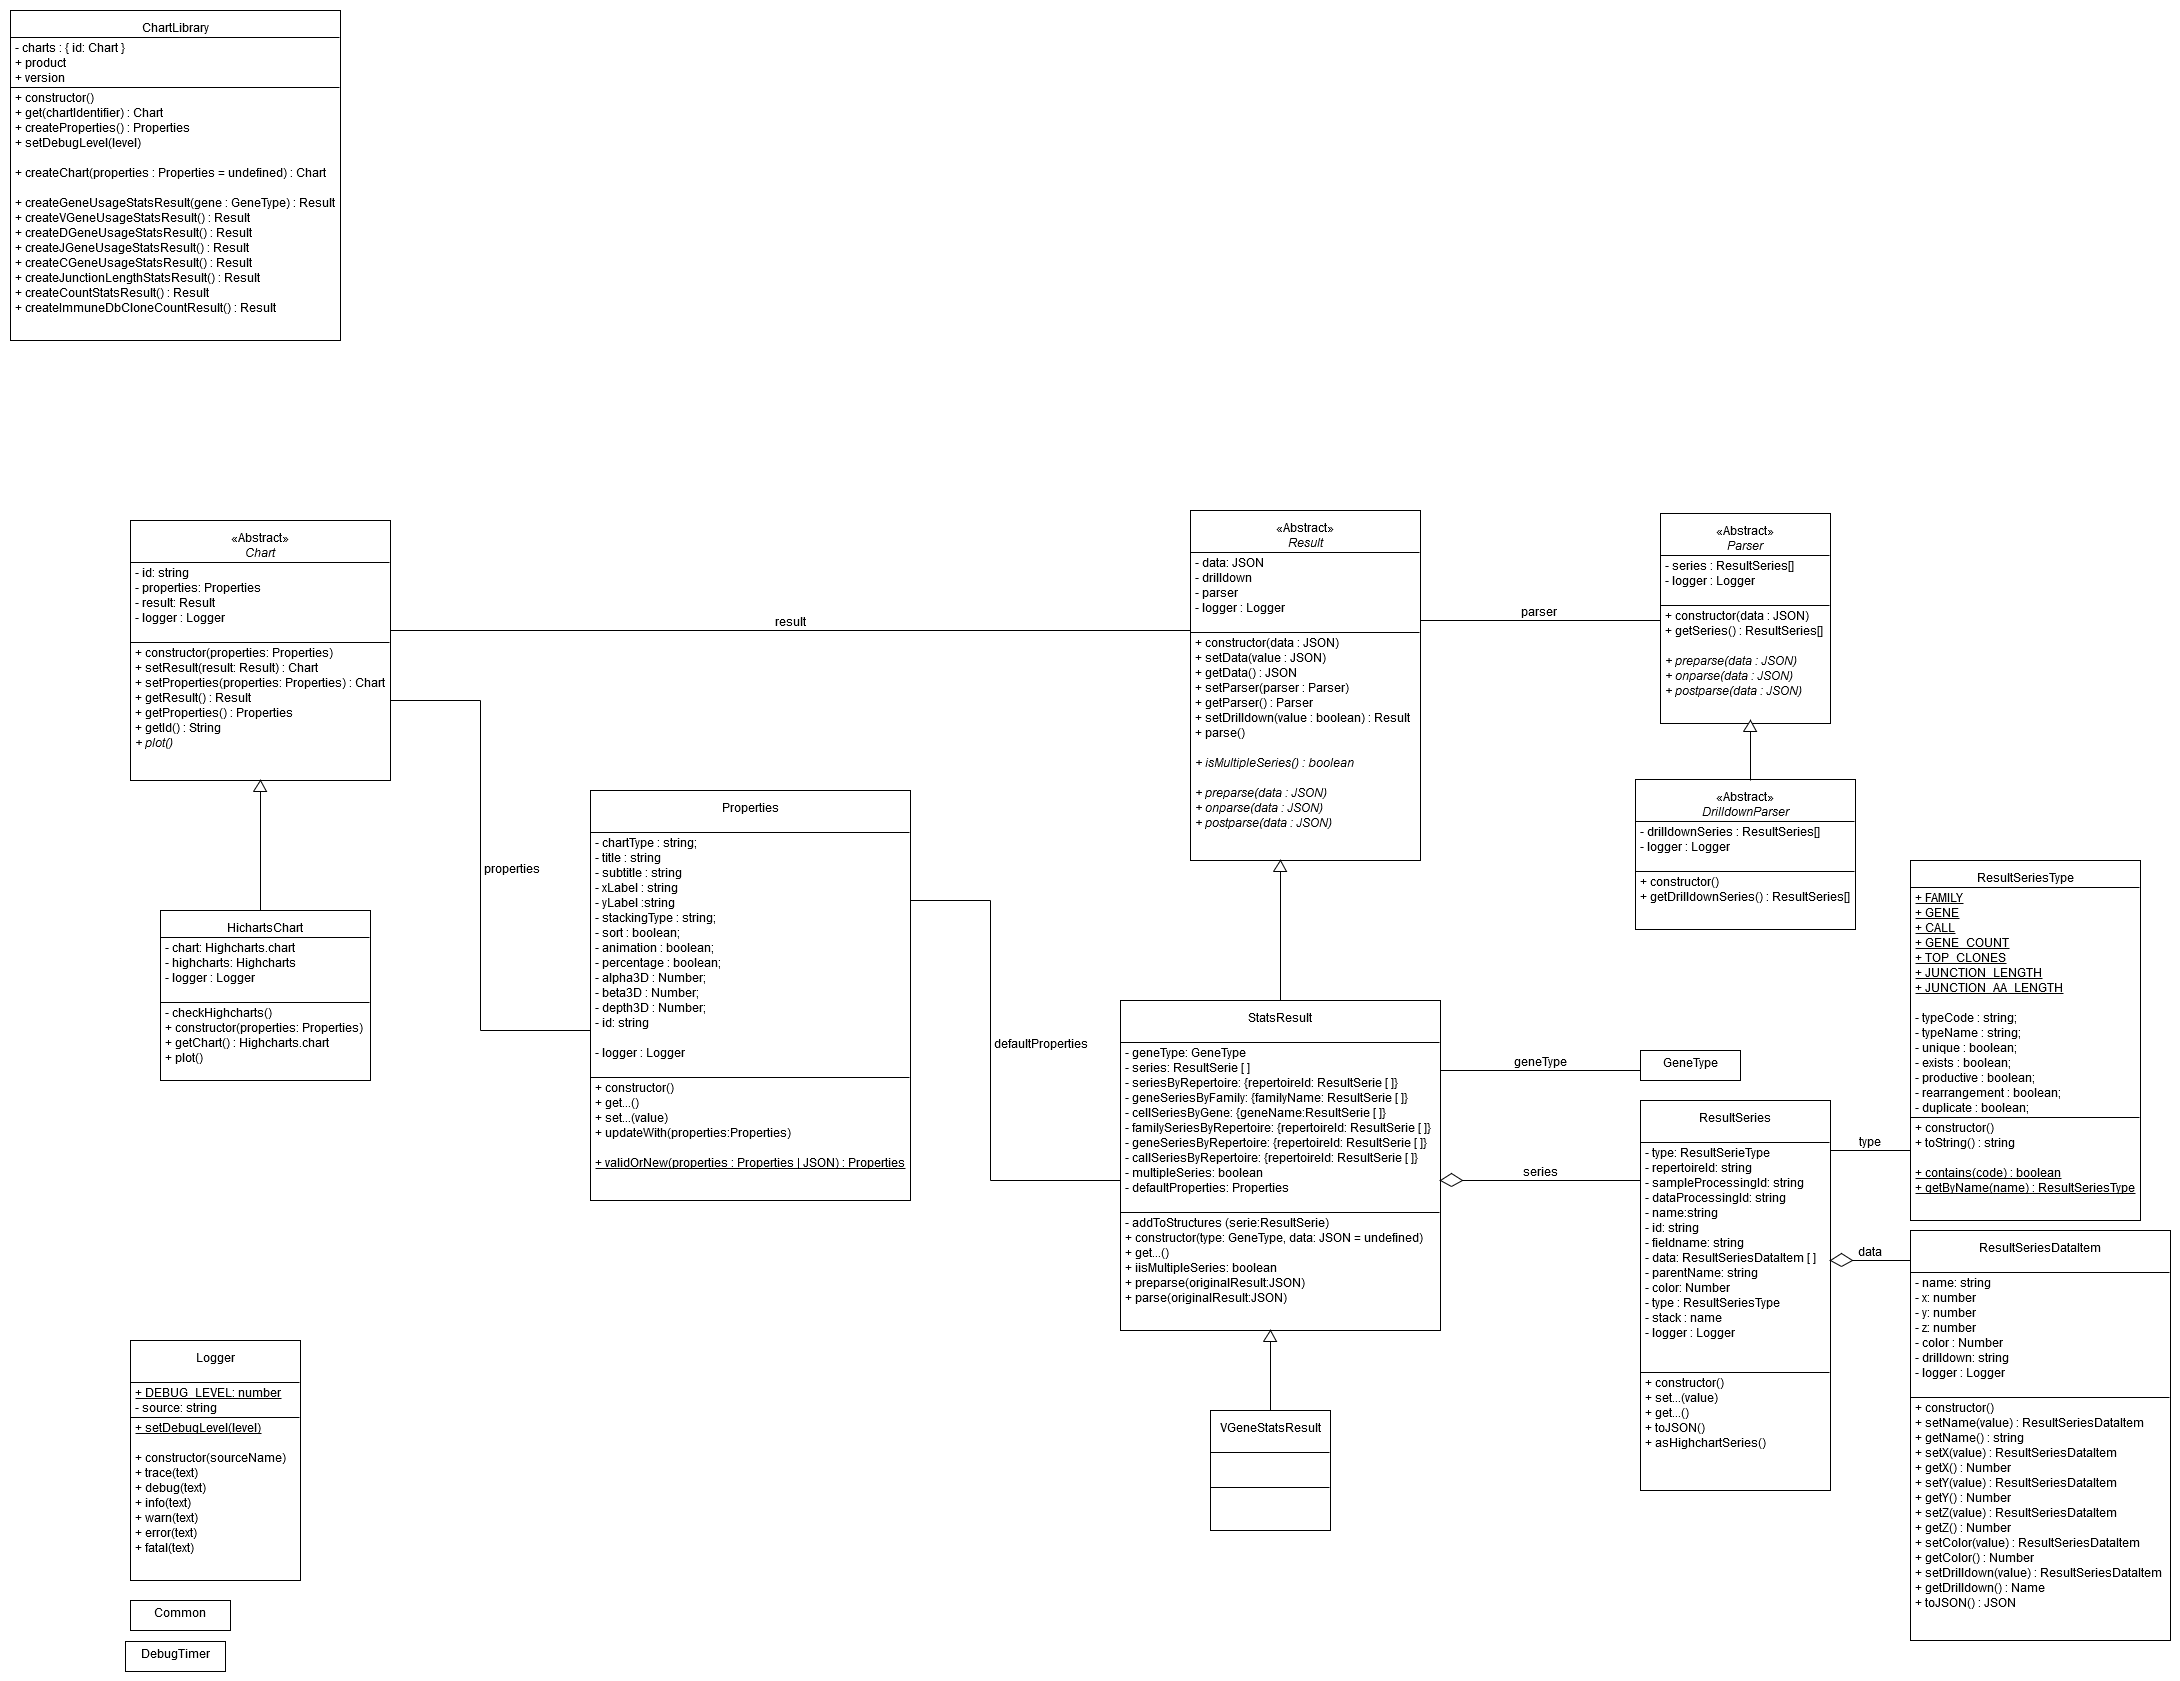
The library is meant to be used either through the global variable window.airrvisualization or by instanciating the individual Classes.
With window.airrvisualization you get an instance of the Class VisualizationLibrary.
Working examples can be found in the files iRplusVis_APP.html, iRplusVis_APP-module.html and ImmuneDb_APP.html.
(UML (under maintenance) Class Diagram)

Note you must have npminstalled on your machine.
Start by installing dependencies, on the command line type:
npm installTo build the visualization library run (after installing dependencies):
npm run buildIf sources are required intead of build use build:dev:
npm run build:devTo build the library documentation run:
npm run build:docsAfter running the above command, JsDoc documentation will be available on /jsdoc/index.html
To tests on the library, run:
npm run testTo see tests code coverage run:
npm run cover