This tutorial will be based on the popular Demo platform provided by Google : The Online Boutique
Online Boutique is a cloud-native microservices demo application. Online Boutique consists of a 10-tier microservices application. The application is a web-based e-commerce app where users can browse items, add them to the cart, and purchase them. The Google HipsterShop is a microservice architecture using several langages :
- Go
- Python
- Nodejs
- C#
- Java
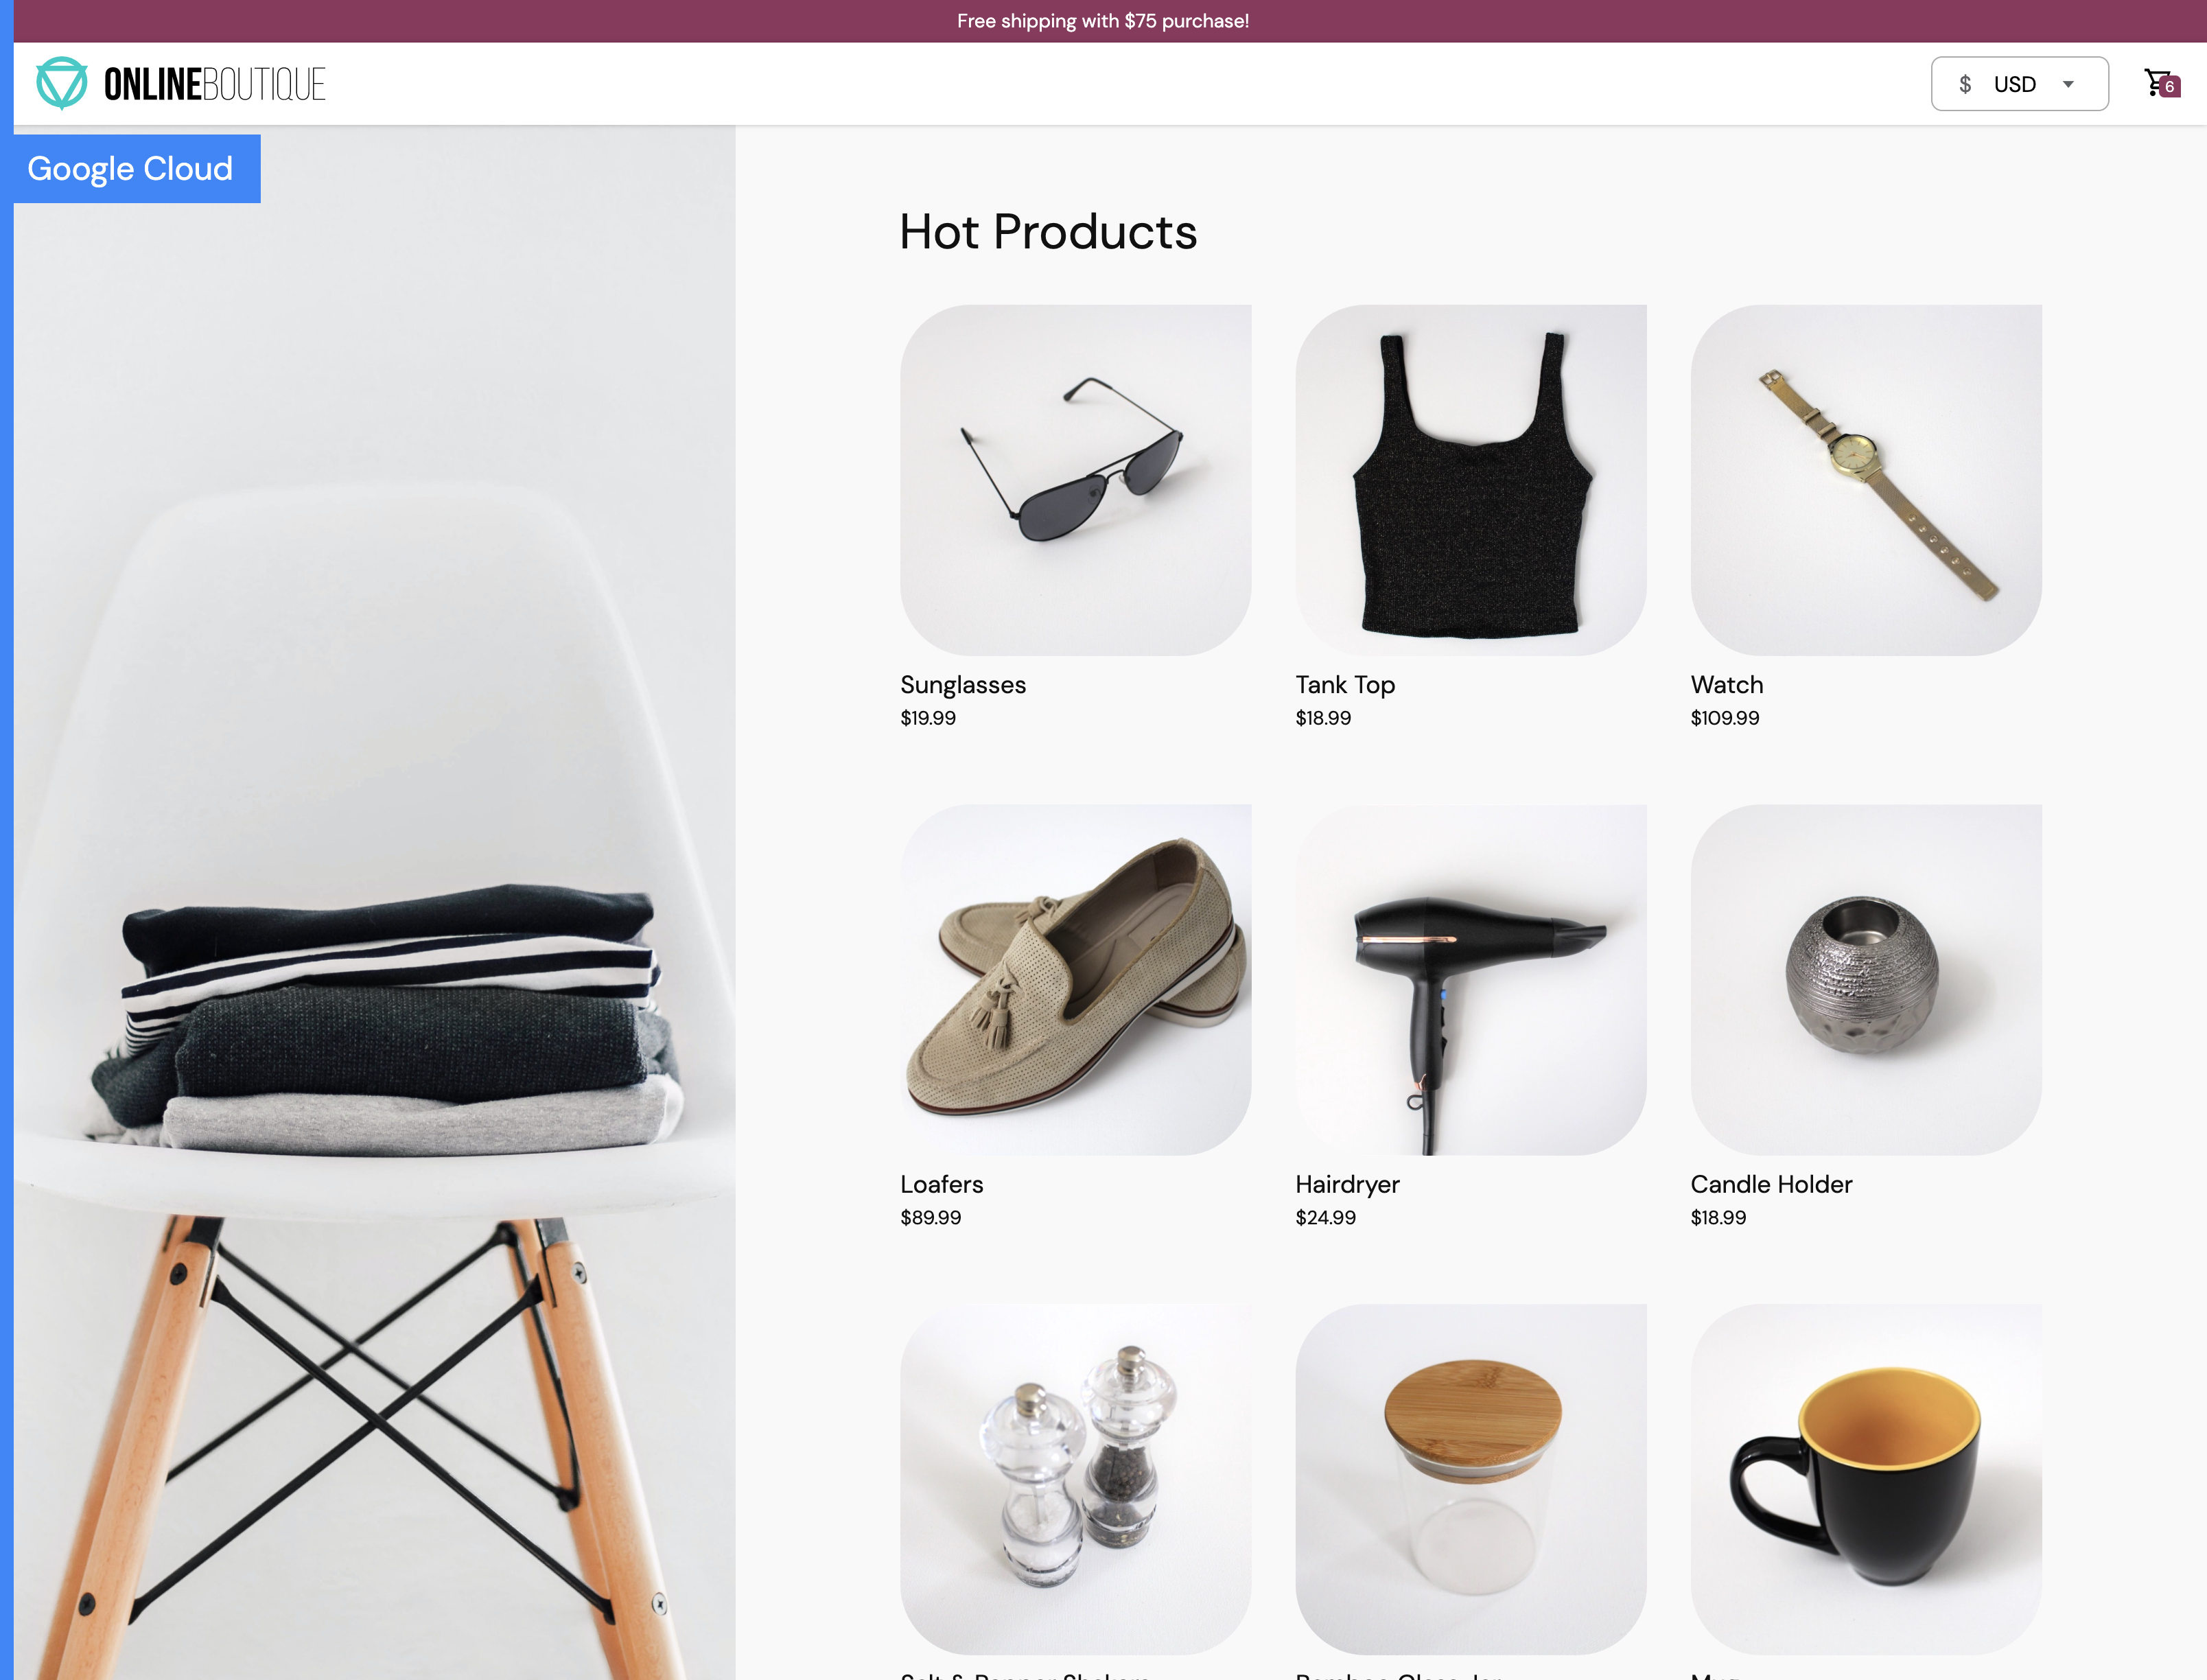
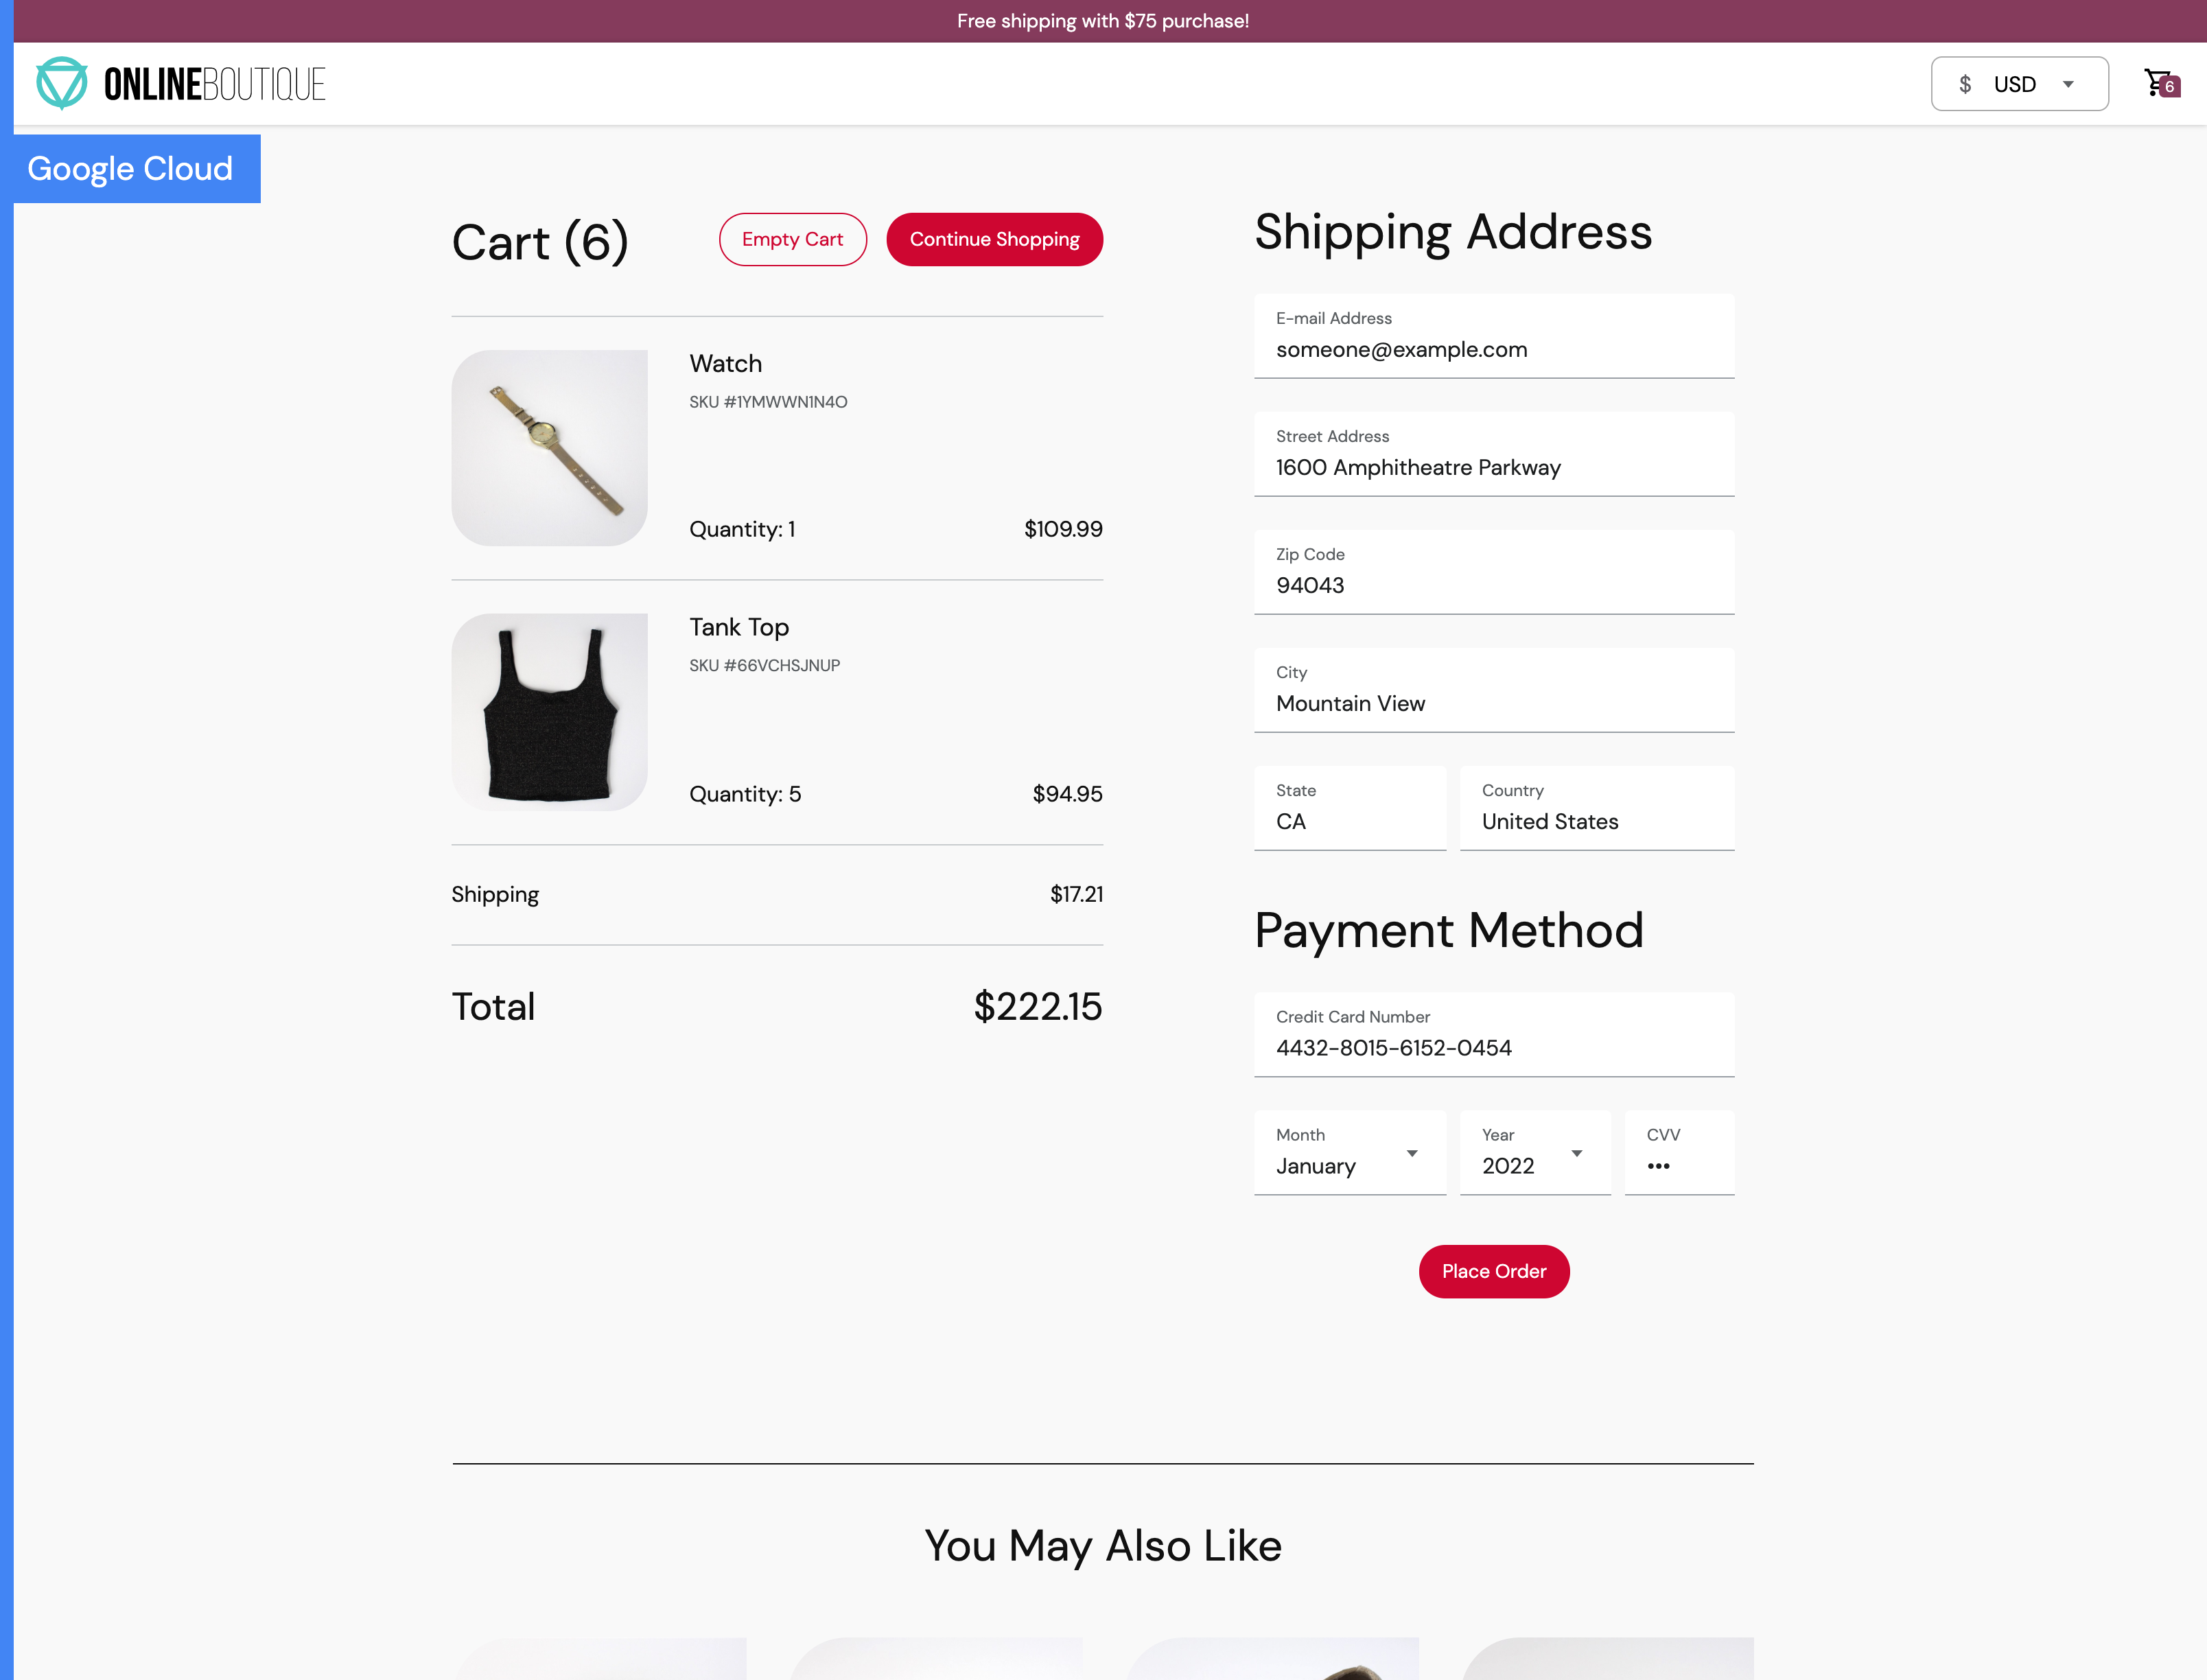
| Home Page | Checkout Screen |
|---|---|
 |
 |
The following tools need to be install on your machine :
- jq
- kubectl
- git
- gcloud ( if you are using GKE)
- Helm
This tutorial will generate traces and send them to Dynatrace. Therefore you will need a Dynatrace Tenant to be able to follow all the instructions of this tutorial . If you don't have any dynatrace tenant , then let's start a trial on Dynatrace
You will first need a Kubernetes cluster with 2 Nodes. You can either deploy on Minikube or K3s or follow the instructions to create GKE cluster:
PROJECT_ID="<your-project-id>"
gcloud services enable container.googleapis.com --project ${PROJECT_ID}
gcloud services enable monitoring.googleapis.com \
    cloudtrace.googleapis.com \
    clouddebugger.googleapis.com \
    cloudprofiler.googleapis.com \
    --project ${PROJECT_ID}
ZONE=us-central1-b
gcloud container clusters create onlineboutique \
--project=${PROJECT_ID} --zone=${ZONE} \
--machine-type=e2-standard-2 --num-nodes=4
git clone https://github.com/isItObservable/OpenTelemetry-Instrumentation
cd OpenTelemetry-Instrumentation
helm upgrade --install ingress-nginx ingress-nginx \
  --repo https://kubernetes.github.io/ingress-nginx \
  --namespace ingress-nginx --create-namespace
this command will install the nginx controller on the nodes having the label observability
Since we are using Ingress controller to route the traffic , we will need to get the public ip adress of our ingress. With the public ip , we would be able to update the deployment of the ingress for :
- hipstershop
- grafana
- K6
IP=$(kubectl get svc ingress-nginx-controller -n ingress-nginx -ojson | jq -j '.status.loadBalancer.ingress[].ip')
update the following files to update the ingress definitions :
sed -i "s,IP_TO_REPLACE,$IP," kubernetes-manifests/k8s-manifest.yaml
Our Chaos experiments will utilize the Prometheus as an Observabilty backend
We will neeed to deploy Prometheus only on the nodes having the label observability.
helm repo add prometheus-community https://prometheus-community.github.io/helm-charts
helm repo update
helm install prometheus prometheus-community/kube-prometheus-stack
To measure the impact of our experiments on use traffic , we will use the load testing tool named K6. K6 has a Prometheus integration that writes metrics to the Prometheus Server. This integration requires to enable a feature in Prometheus named: remote-writer
To enable this feature we will need to edit the CRD containing all the settings of promethes: prometehus
To get the Prometheus object named use by prometheus we need to run the following command:
kubectl get Prometheus
here is the expected output:
NAME                                    VERSION   REPLICAS   AGE
prometheus-kube-prometheus-prometheus   v2.32.1   1          22h
We will need to add an extra property in the configuration object :
enableFeatures:
- remote-write-receiver
so to update the object :
kubectl edit Prometheus prometheus-kube-prometheus-prometheus
After the update your Prometheus object should look like :
apiVersion: monitoring.coreos.com/v1
kind: Prometheus
metadata:
  annotations:
    meta.helm.sh/release-name: prometheus
    meta.helm.sh/release-namespace: default
  generation: 2
  labels:
    app: kube-prometheus-stack-prometheus
    app.kubernetes.io/instance: prometheus
    app.kubernetes.io/managed-by: Helm
    app.kubernetes.io/part-of: kube-prometheus-stack
    app.kubernetes.io/version: 30.0.1
    chart: kube-prometheus-stack-30.0.1
    heritage: Helm
    release: prometheus
  name: prometheus-kube-prometheus-prometheus
  namespace: default
spec:
  alerting:
  alertmanagers:
  - apiVersion: v2
    name: prometheus-kube-prometheus-alertmanager
    namespace: default
    pathPrefix: /
    port: http-web
  enableAdminAPI: false
  enableFeatures:
  - remote-write-receiver
  externalUrl: http://prometheus-kube-prometheus-prometheus.default:9090
  image: quay.io/prometheus/prometheus:v2.32.1
  listenLocal: false
  logFormat: logfmt
  logLevel: info
  paused: false
  podMonitorNamespaceSelector: {}
  podMonitorSelector:
  matchLabels:
  release: prometheus
  portName: http-web
  probeNamespaceSelector: {}
  probeSelector:
  matchLabels:
  release: prometheus
  replicas: 1
  retention: 10d
  routePrefix: /
  ruleNamespaceSelector: {}
  ruleSelector:
  matchLabels:
  release: prometheus
  securityContext:
  fsGroup: 2000
  runAsGroup: 2000
  runAsNonRoot: true
  runAsUser: 1000
  serviceAccountName: prometheus-kube-prometheus-prometheus
  serviceMonitorNamespaceSelector: {}
  serviceMonitorSelector:
  matchLabels:
  release: prometheus
  shards: 1
  version: v2.32.1
kubectl apply -f https://github.com/jetstack/cert-manager/releases/download/v1.6.1/cert-manager.yaml
kubectl get svc -n cert-manager
After a few minutes, you should see:
NAME                   TYPE        CLUSTER-IP      EXTERNAL-IP   PORT(S)    AGE
cert-manager           ClusterIP   10.99.253.6     <none>        9402/TCP   42h
cert-manager-webhook   ClusterIP   10.99.253.123   <none>        443/TCP    42h
kubectl apply -f https://github.com/open-telemetry/opentelemetry-operator/releases/latest/download/opentelemetry-operator.yaml
To be able to ingest the Distributed traces generated by the Online Boutique , it would be requried to modify openTelemetry-manifest.yaml with
- your Dynatrace Tenant URL ( your dynatrace url would be
https://<TENANTID>.live.dynatrace.com) - A dynatrace API token having the right :
Ingest OpenTelemetry tracesTo generate your API token you will need to click onAccess Tokens( in the left menu) Follow the instruction described in dynatrace's documentation Make sure that the scope Ingest OpenTelemetry traces and metrics v2 is enabled.
export DT_TENANT_URL=<YOUR TENANT URL>
export DT_API_TOKEN=<YOUR DYNATRACE API TOKEN>
sed -i "s,TENANTURL_TOREPLACE,$DT_TENANT_URL," kubernetes-manifests/openTelemetry-manifest.yaml
sed -i "s,DT_API_TOKEN_TO_REPLACE,$DT_API_TOKEN," kubernetes-manifests/openTelemetry-manifest.yaml
kubectl apply -f kubernetes-manifests/openTelemetry-manifest.yaml
kubectl create ns hipster-shop
kubectl apply -f kubernetes-manifests/k8s-manifest.yaml -n hipster-shop
kubectl get pods
After a few minutes, you should see:
NAME                                     READY   STATUS    RESTARTS   AGE
adservice-668484d797-jxqsg               1/1     Running   0          23d
cartservice-754d9f69b6-k5tlk             1/1     Running   0          23d
checkoutservice-56b96d95c-7k66b          1/1     Running   0          23d
currencyservice-c4bd899cd-zvwnx          1/1     Running   0          23d
emailservice-79bdf579f6-wvx4c            1/1     Running   0          22d
frontend-5694965584-gfkrk                1/1     Running   0          22d
k6loadgenerator-69d9579f98-w5g66         1/1     Running   1          24h
loadgenerator-546597c764-qs8ts           1/1     Running   22         22d
paymentservice-6fc857fd48-zfmfr          1/1     Running   0          22d
productcatalogservice-6b488c9d57-lwflb   1/1     Running   0          22d
recommendationservice-78fbf687c7-m68v9   1/1     Running   0          22d
redis-cart-79b499b7dd-wrlgf              1/1     Running   0          23d
shippingservice-7986c676f5-krnhv         1/1     Running   0          23d
with http://onlineboutique..nip.io
Open you browser , Open the online boutique and add few products in the cart.
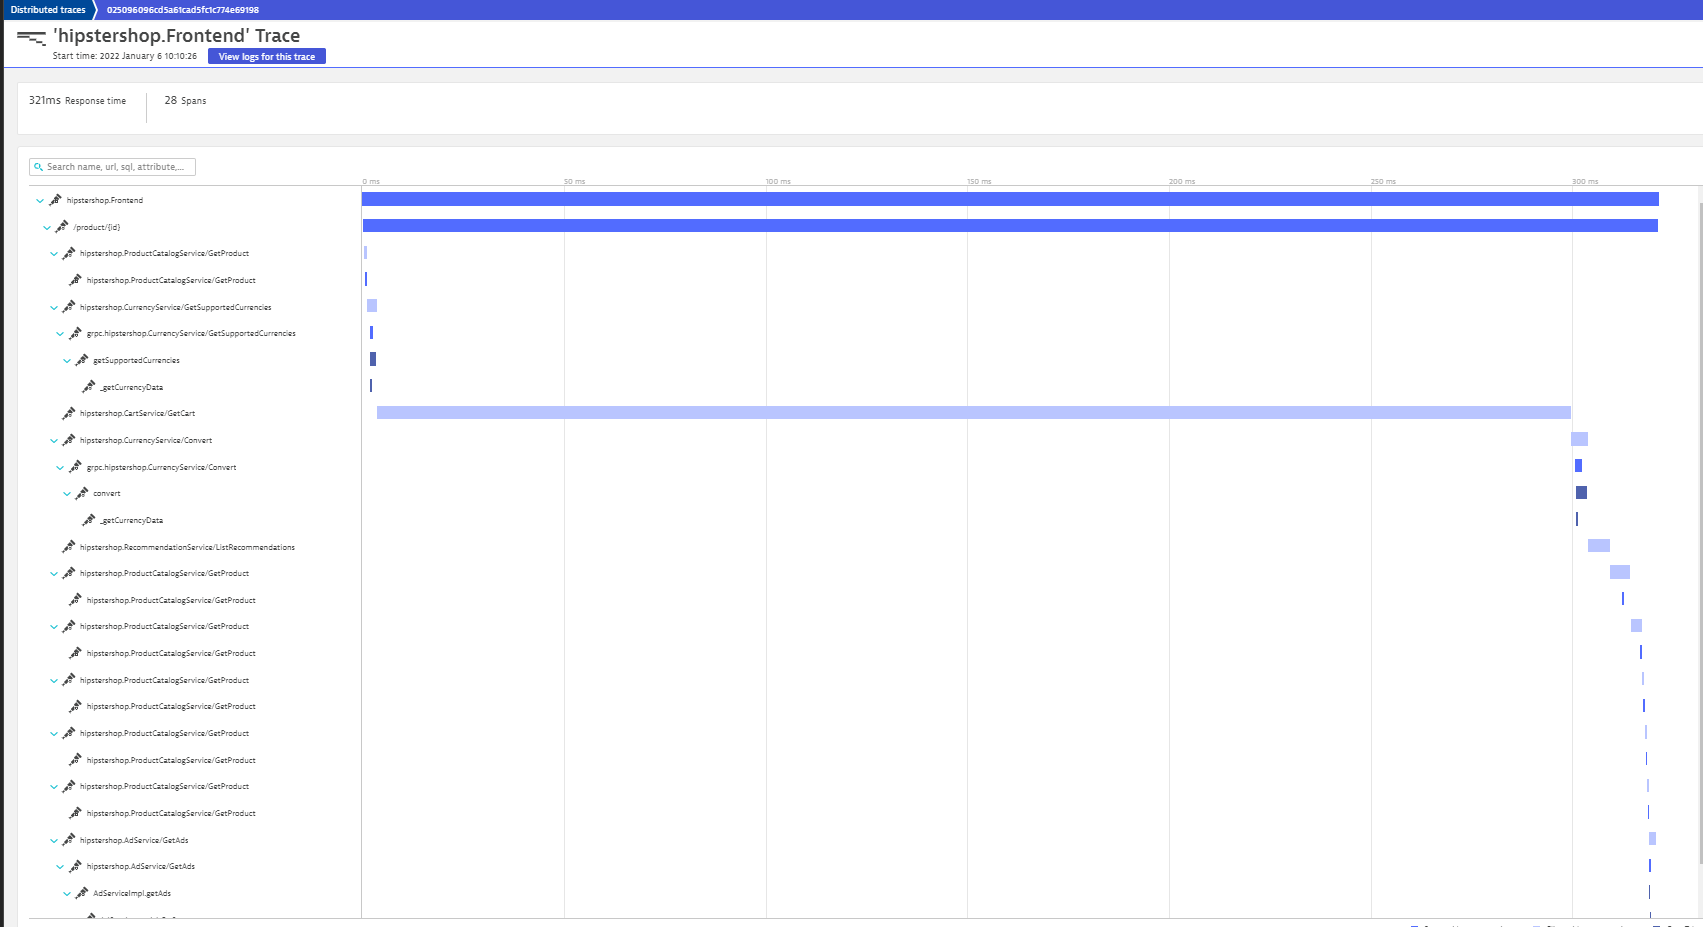
Open Dynatrace, Click on the left menu Application & Microserivces / Distributed traces
gcloud container clusters delete onlineboutique \
    --project=${PROJECT_ID} --zone=${ZONE}
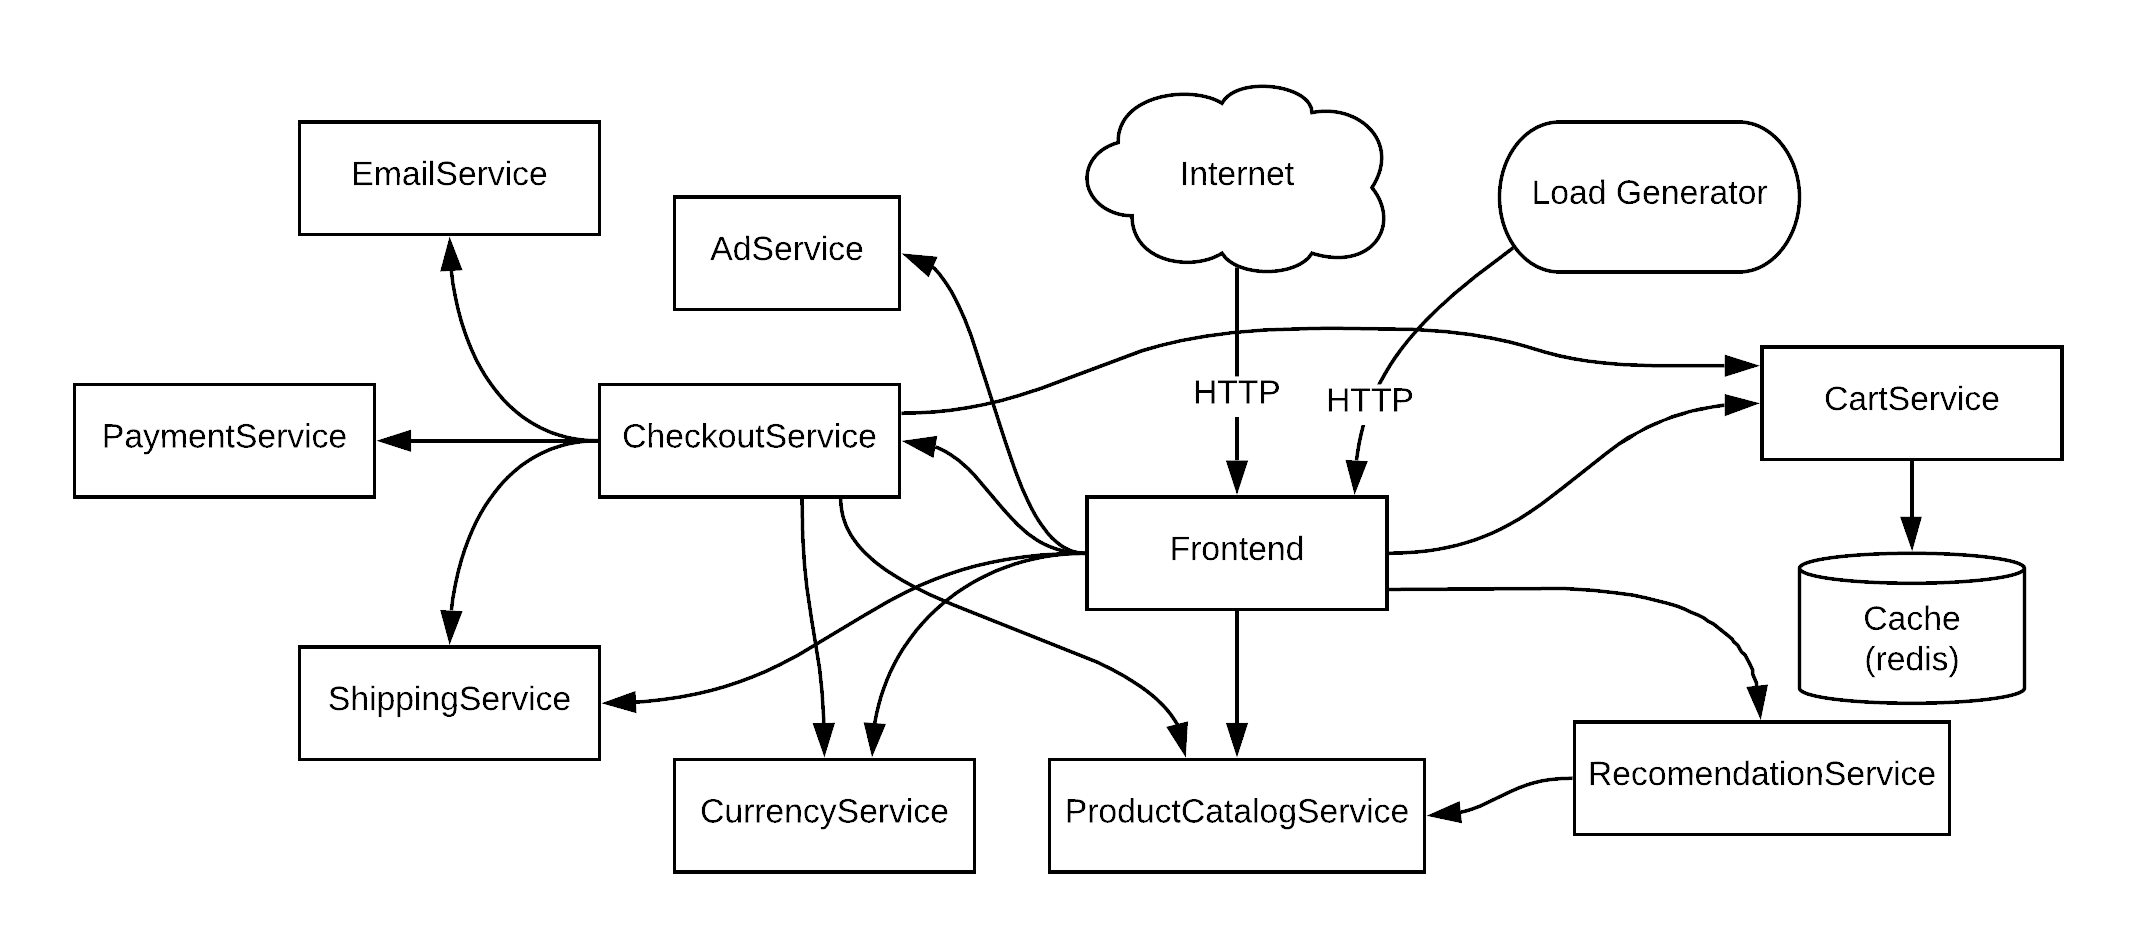
Online Boutique is composed of 11 microservices written in different languages that talk to each other over gRPC. See the Development Principles doc for more information.
Find Protocol Buffers Descriptions at the ./pb directory.
| Service | Language | Description |
|---|---|---|
| frontend | Go | Exposes an HTTP server to serve the website. Does not require signup/login and generates session IDs for all users automatically. |
| cartservice | C# | Stores the items in the user's shopping cart in Redis and retrieves it. |
| productcatalogservice | Go | Provides the list of products from a JSON file and ability to search products and get individual products. |
| currencyservice | Node.js | Converts one money amount to another currency. Uses real values fetched from European Central Bank. It's the highest QPS service. |
| paymentservice | Node.js | Charges the given credit card info (mock) with the given amount and returns a transaction ID. |
| shippingservice | Go | Gives shipping cost estimates based on the shopping cart. Ships items to the given address (mock) |
| emailservice | Python | Sends users an order confirmation email (mock). |
| checkoutservice | Go | Retrieves user cart, prepares order and orchestrates the payment, shipping and the email notification. |
| recommendationservice | Python | Recommends other products based on what's given in the cart. |
| adservice | Java | Provides text ads based on given context words. |
| loadgenerator | JS /K6 | Continuously sends requests imitating realistic user shopping flows to the frontend. |


