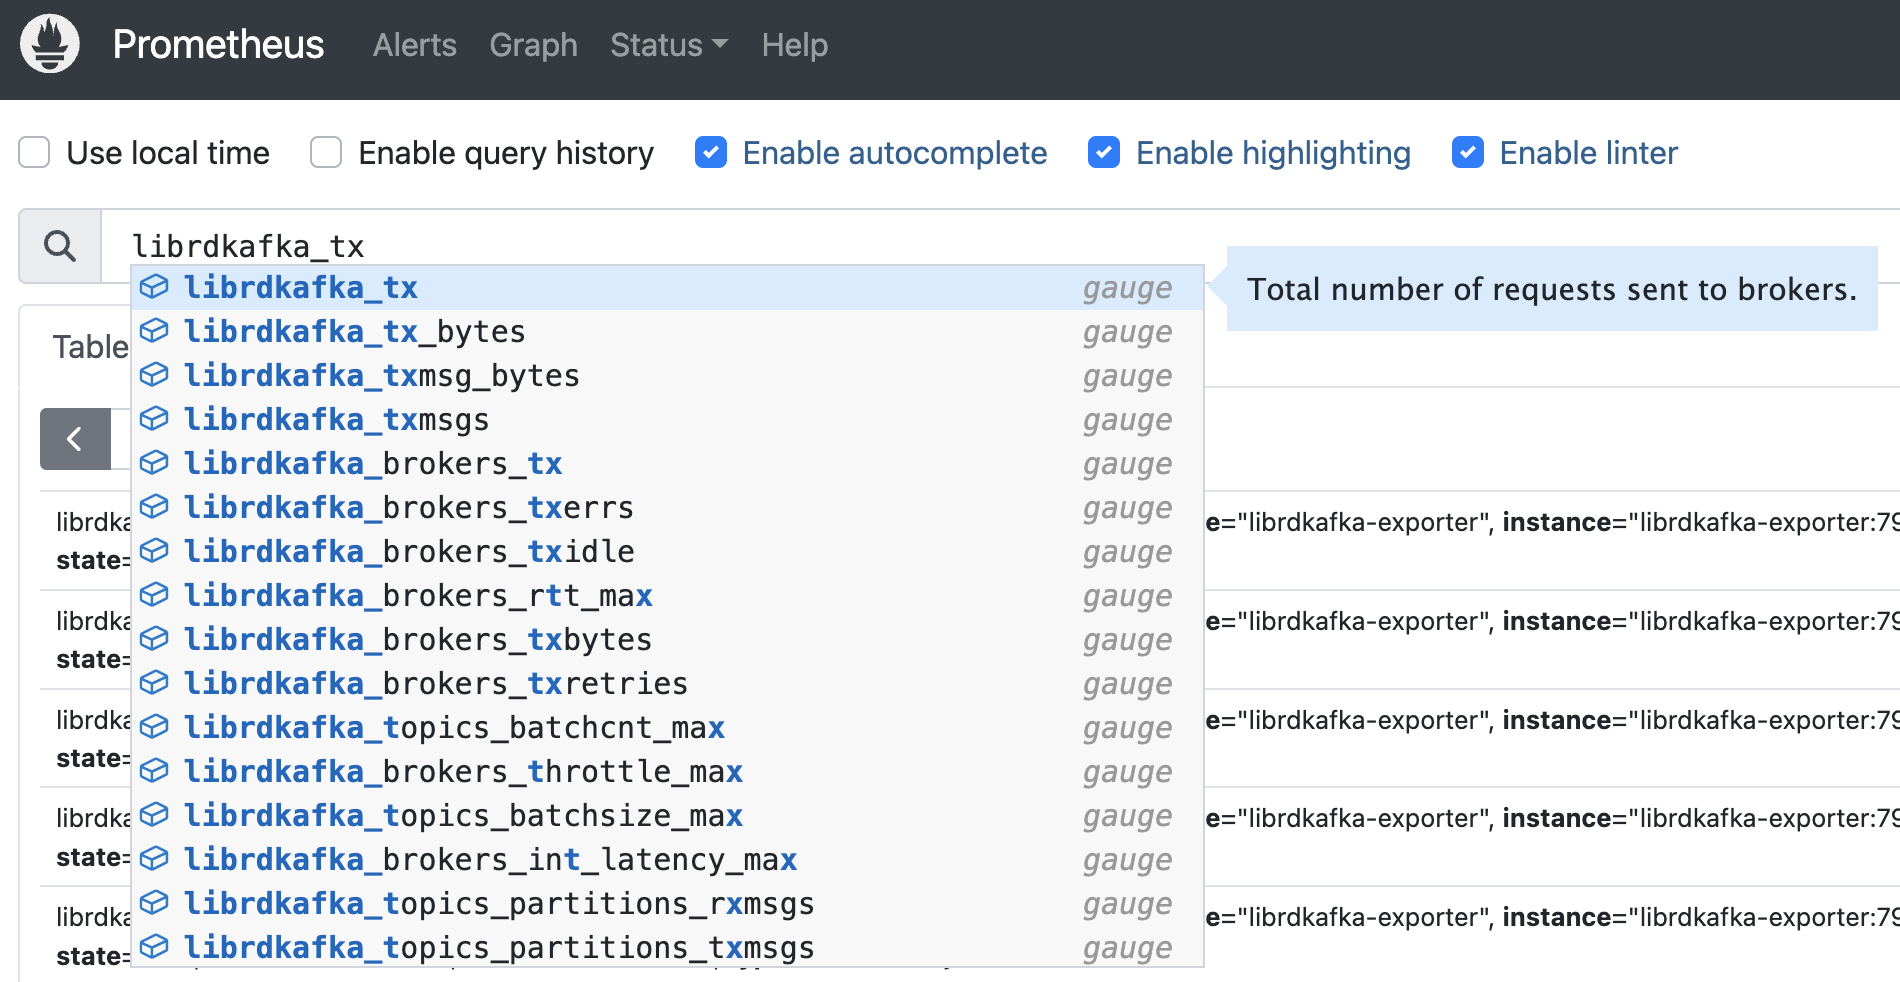
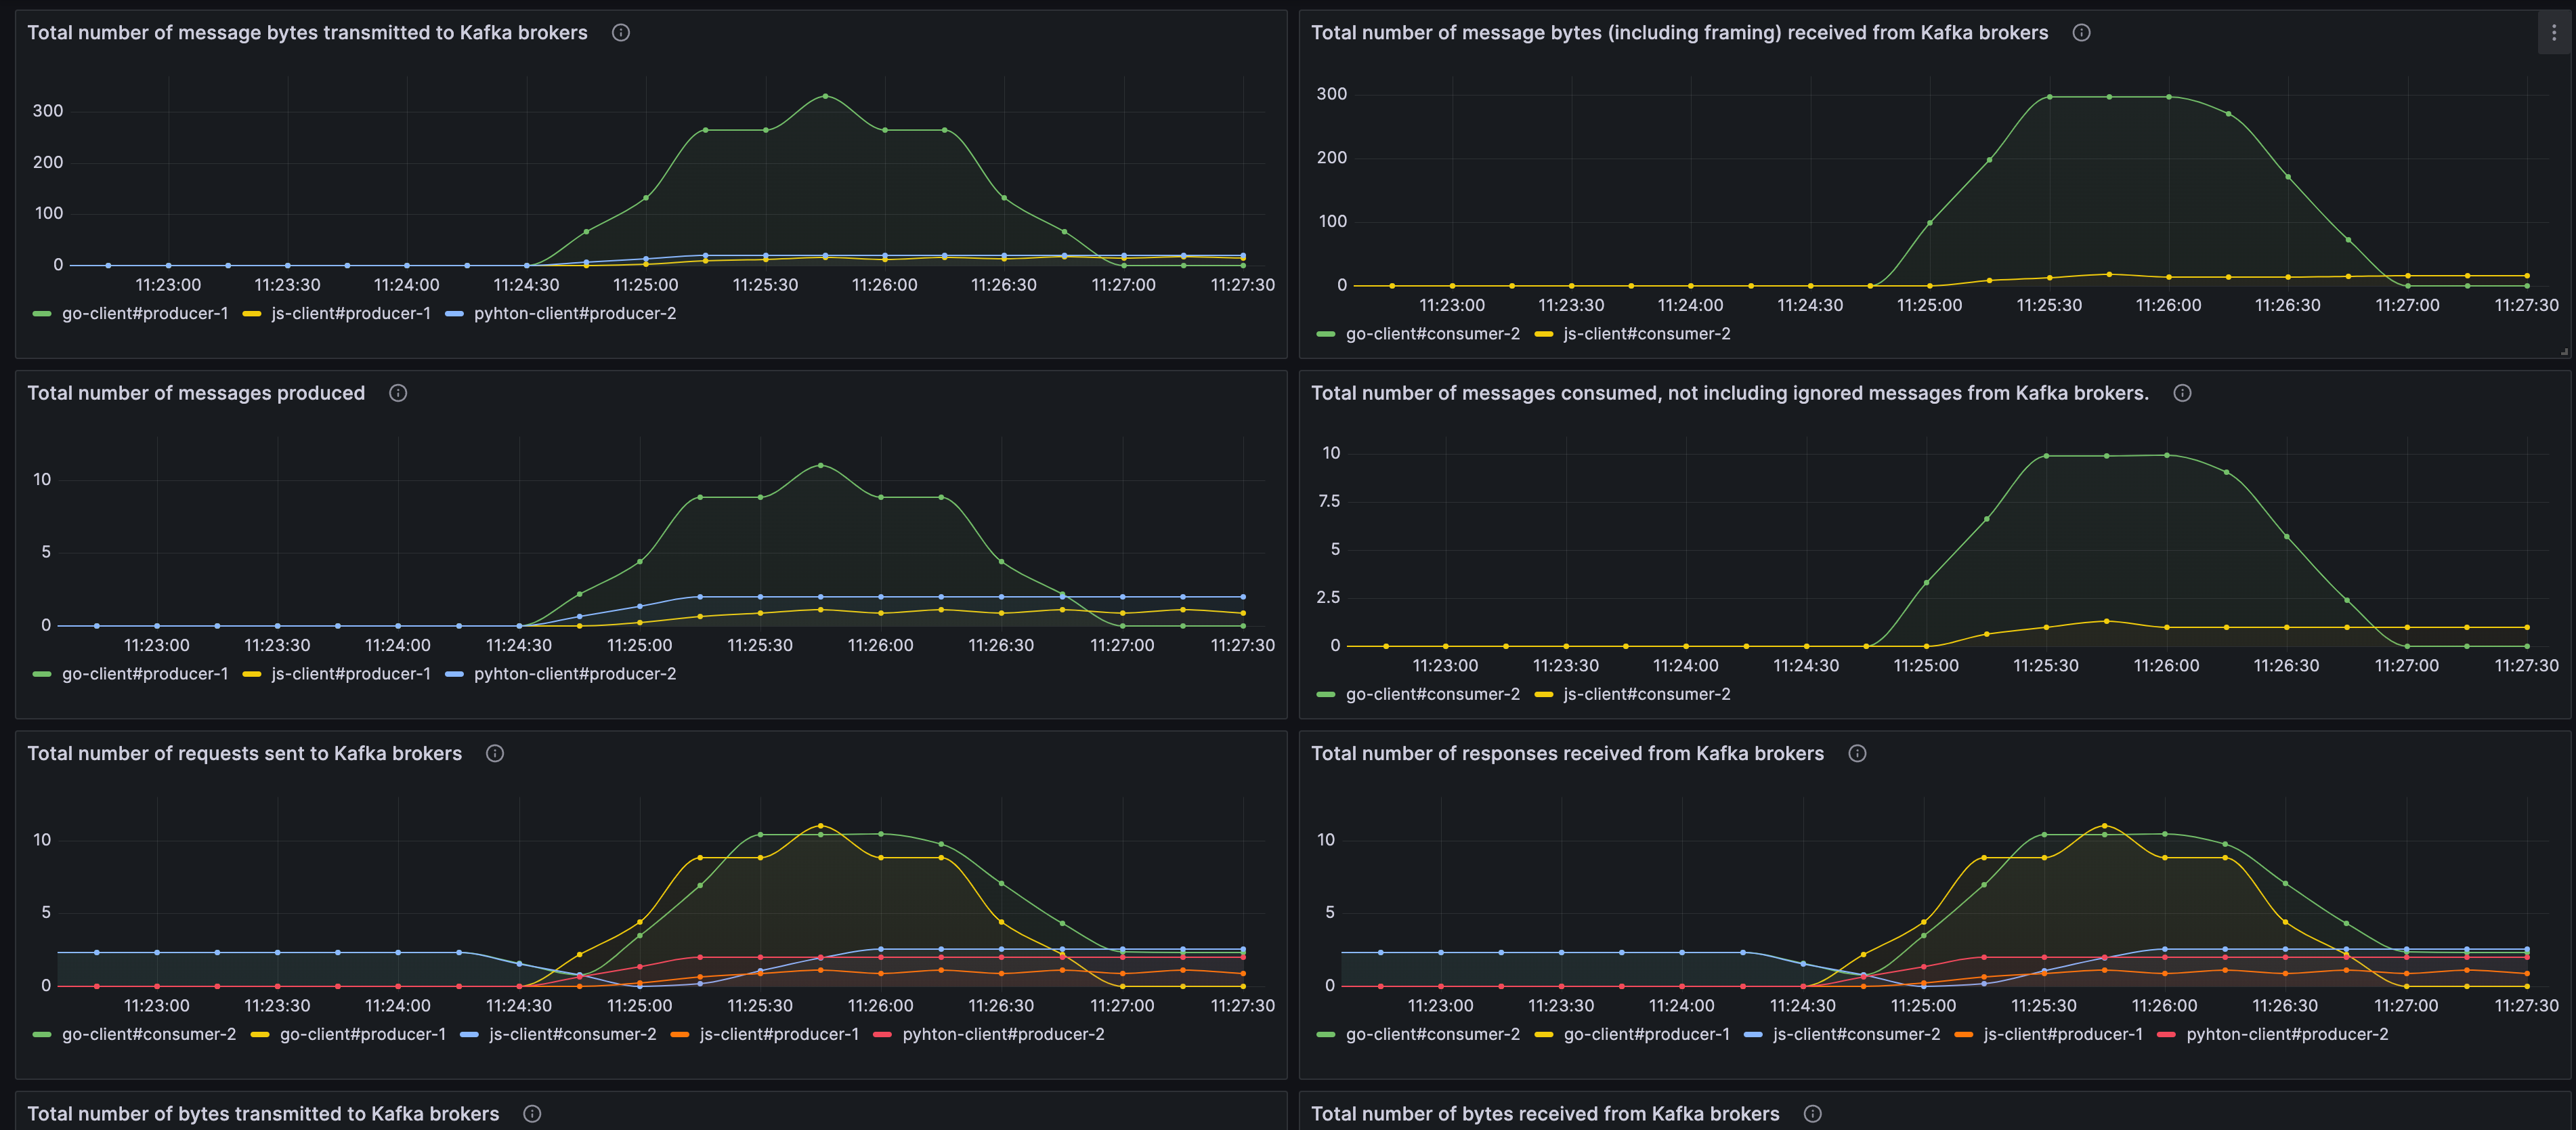
This is a simple prometheus exporter for librdkafka Stats. It provides a common implementation for all the librkafka clients, instead of providing a specific exporter+server implementation for each language.
It uses the librdkafka definition to expose the stats as Prometheus metrics. Any librdkafka client can push stats (json) to the server using the statistics.interval.ms configuration and the stats_cb. The server will parse the stats JSON requests and expose those stats as Prometheus metrics.
This is a experimental implementation. See Project Status at the end of this doc.
-
Endpoints
/- POST - The client will POST JSON Stats fromlibrdkafka/metrics- GET - Get stats in Prometheus format. (Prometheus target)
-
Prefix: All the metrics are translated using the prefix
librdkafka_ -
Labels, for all the metrics:
client_id,nameandtype- Brokers:
- Prefix:
librdkafka_brokers_ - Labels:
broker, nodeid, nodename, source, state
- Prefix:
- Topics:
- Prefix:
librdkafka_topics_ - Labels:
topic
- Prefix:
- Consumer Groups:
- Prefix:
librdkafka_consumergroups_ - Labels:
state, join_state, rebalance_reason
- Prefix:
- EOS:
- Prefix:
librdkafka_eos_ - Labels:
idemp_state, txn_state
- Prefix:
- Brokers:
Prometheus configuration:
  - job_name: "librdkafka-exporter"
    static_configs:
      - targets:
          - "librdkafka-exporter:7979"
    relabel_configs:
      - source_labels: [__address__]
        target_label: hostname
        regex: '([^:]+)(:[0-9]+)?'
replacement: '${1}'examples directory:
Docker Compose (docker-compose.yaml):
- Kafka Broker (29092)
- Prometheus (9090)
- Grafana (3000)
- Kafka Clients (Go, JS, Pyhton)
Build:
docker-compose build Run:
docker-compose up -dAll clients are configured using statistics.interval.ms
http://localhost:3000 (admin/password)
./examples/grafana/provisioning/dashboards/librdkafka.json
Dir: ./clients/go
Produce 1000 messages and consume them. There is a 500ms gap between each message production.
Environment variables:
TOPIC: test-topic-goproduce and consume.STATS_EXPORTER_URL: http://librdkafka-exporter:7979BOOTSTRAP_SERVERS: broker:29092
Logs:
docker-compose logs go-clientDir: ./clients/js
Produce 1000 messages and consume them. There is a 500ms gap between each message production.
Environment variables:
TOPIC: test-topic-jsproduce and consume.STATS_EXPORTER_URL: http://librdkafka-exporter:7979BOOTSTRAP_SERVERS: broker:29092
Logs:
docker-compose logs js-clientDir: ./clients/python
Produce 1000 messages and consume them. There is a 500ms gap between each message production.
Environment variables:
TOPIC: test-topic-pyproduce and consume.STATS_EXPORTER_URL: http://librdkafka-exporter:7979BOOTSTRAP_SERVERS: broker:29092
Logs:
docker-compose logs py-clientDir: ./clients/dotnet/PrometheusExporter
Produce 1000 messages and consume them. There is a 500ms gap between each message production.
Environment variables:
TOPIC: test-topic-pyproduce and consume.STATS_EXPORTER_URL: http://librdkafka-exporter:7979BOOTSTRAP_SERVERS: broker:29092
Logs:
docker-compose logs dotnet-clientgo run main.gogo buildExperimental implementation.
TODOs:
- Prometheus exporter:
- Update stats code should be improved (unit testing, abstractions, resorce usage, etc)
- Error handling
- Prometheus Collector
- Add support for Window Stats from Librdkafka
- Update stats code should be improved (unit testing, abstractions, resorce usage, etc)
- Grafana:
- Add filters
- Add more metrics/panels
- Clients
- Error handling

