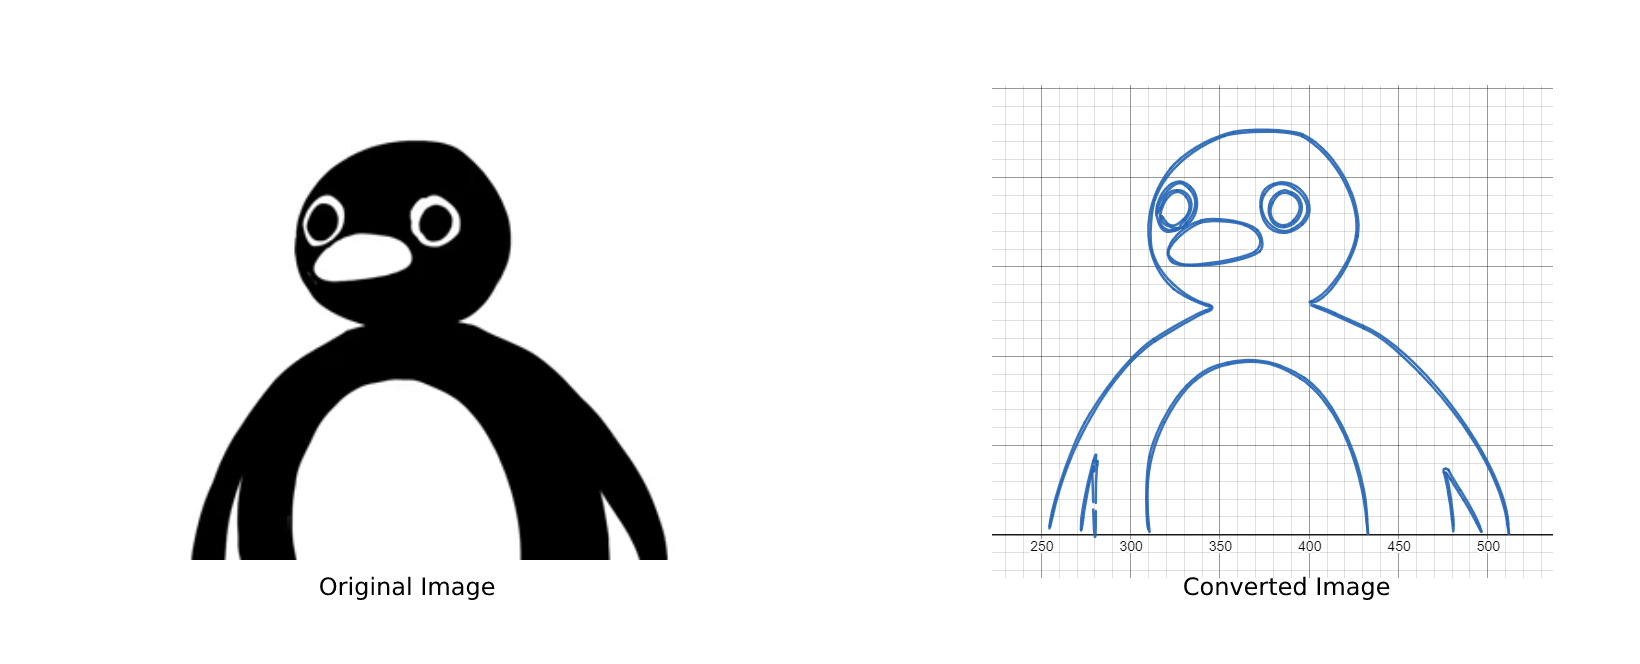
Turn your picture into Desmos graphs.
- The source code that turns picture into series of Desmos graphs were achieved by kevinjycui in his project DesmosBezierRenderer.
- Desmos themselves! Needed to modify their official API's javascript code a bit in order to make this thing working.
This is a website (or API at the same time) that turns your picture into Desmos Graphs.
Please check https://gooday2die.net/DesmosPics or http://us.gooday2die.net/DesmosPics for live demo!
backend.py: A Python script that includes all codes for API./frontend/: All elements for frontend web page.
- Simply put
/frontenddirectory into your Apache directory sudo apt install git python3-dev python3-pip build-essential libagg-dev libpotrace-dev pkg-config- If you do not have PHP and CURL PHP not installed in your system, install them.
- Install all requirements in
requirements.txtbypip install -r requirements.txt - Edit graph saving location using at following files
-
backend.pyat line 155.
-
index.phpat line 136
python3 backend.py

DesmosPics supports Docker. You can simply pull the image by
docker pull isukim/desmos_pics
Then execute the image using
docker run -d -p 8080:80 isukim/desmos_pics
This will make the container run web server on port 8080. Also, if you would like to use API as well, use 5001 for the container's API port.
For example, if you would like to use
8080in local host for the web server and8081for the API server, use following command:docker run -d -p 8080:80 -p 8081:5001 isukim/desmos_pics
- When the picture needs many functions to be rendered, Desmos API needs very much time to render graphs.
By python3 backend.py there will be an API server running in port 5001. The API has following services.
/pic- Method:
POSTandGET
Post a png, jpeg, jpg image document using enctype=multipart/form-data. Send data in following format.
{"image": ImageData}
If the API server was able to process the image, it will return following json as return value.
{
	"js_result": "string object that represents javascript code that is needed for representing Desmos graph using their API",
	"text_result": "string object that represents latex expression that represents all functions needed for representing the image"
}
./frontend/modified.jswas a modified version of official Desmos API. Since there was abit of minor bug from the original API which can be found here, I had to modify a bit of code in order for the frontend script to work.
I am not a web programmer, so if you happen to find bugs in frontend or backend, please PR or report issues.