This visual will generate an interactive map for the kind of data shown in the following table:
| Point_Diameter | Label_Txt_1 | Label_Txt_2 | Line_Width | Colour | GeoJSON |
|---|---|---|---|---|---|
3 |
"some" |
"other" |
2 |
"#FF0000" |
{ "type":"Feature", "geometry":{ ... } } |
3 |
"example" |
"label" |
3 |
"#FFFF00" |
{ "type":"Feature", "geometry":{ ... } } |
4 |
"data" |
"stuff" |
1 |
"#FFAA00" |
{ "type":"Feature", "geometry":{ ... } } |
| ... | ... | ... | ... | ... | ... |
PS: If you want to plot features on the Main Roads Western Australia road network based on (ROAD, START_SLK, END_SLK), you may be interested in my other project: https://github.com/thehappycheese/linear_referencing_geocoding_server which will help to generate the GeoJSON column.
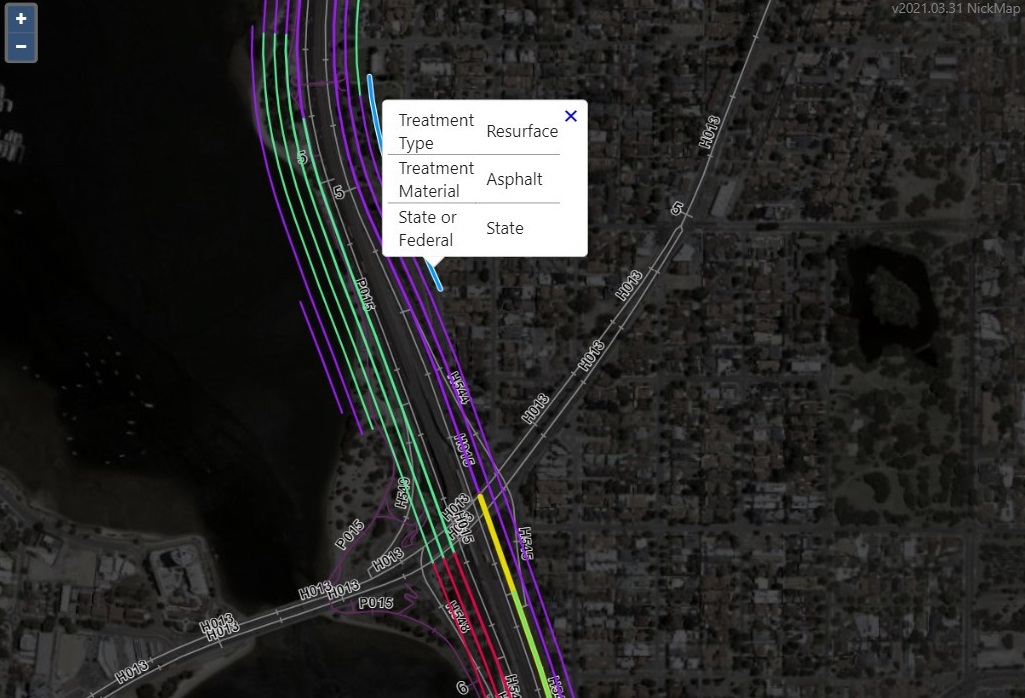
The screenshot below shows a typical output:

The "field wells" will accept the following data types:
| 'Field Well' Name | Description of accepted columns | Data Type | Required | Max Columns | Default | Example / Default |
|---|---|---|---|---|---|---|
| GeoJson Feature | a single GeoJSON feature per row. Note:
|
Text / GeoJSON | Yes | 1 | none |
'{ "type":"Feature", "geometry":{ type":"LineString", "coords":[[1,2],[3,4],[...]] } }' |
| Popup Info | columns containing the information to be shown in the popup when a feature is clicked in the map. | Any | No | ∞ | none |
- |
| Colour | a single hex formatted colour value per row. | Text / Hex formatted colour | No | 1 | "#FF0000" |
"#00FFFF" |
| Line Weight (px) | a single number per row representing the desired line thickness of any LineString features drawn on the map. |
Number | No | 1 | 1 |
2 |
| Point Diameter (px) | a single number per row representing the desired diameter of any Point features drawn on the map. |
Number | No | 1 | 5 |
30 |
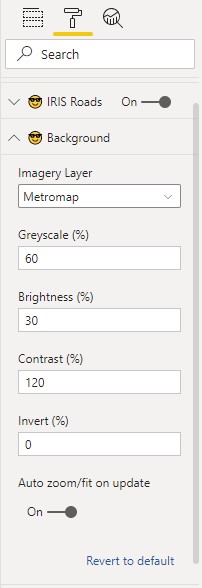
The following settings are available:
| Settings Page 1 | Settings Page 2 |
|---|---|
 |
 |
Only MetroMap imagery and OpenStreetMap background layers are currently available. Many others could be added if required.
Please contact the author to suggest improvements! :)
Some ideas I have are:
- Improve style options for point data; allow fill and maybe shape to be specified.
- currently points are drawn as hollow circles with the same line style as LineStrings.
- Improve style options for polygon data.
- Make the map remember where you were last zoomed in on future visits to reduce confusion.
- Integrate with PowerBI's integrated tooltip service which would give users much more flexibility to create custom tooltips.
- Devise a way to generate colour categories using PowerBI's built in colour theme
- This would alleviate the user from having to add a column to generate hex colour strings (not easy!)
- This would reduce flexibility quite a lot though... I have no idea what colouring strategies the user might want; gradients, categories, bands etc.?
- Don't hard-code layers into the visual, instead use a text input in the settings menu to allow entering the URL of the desired map services.
To work on this project the following are needed:
- Install Node.js
- Alternatively if you are an admin on your local machine I recommend https://github.com/coreybutler/nvm-windows which will make it easier to swap out node versions if necessary
- Make sure
npm(node package manager) is installed - Note this happens as part of the Node.js installation process and you should not need to do anything. - Open a terminal and install pbiviz
npm install pbiviz - Install the pbiviz certificate
pbiviz --install-certfollowing this guide: https://docs.microsoft.com/en-us/power-bi/developer/visuals/create-ssl-certificate - Clone or download this repo and open a terminal in the same folder where
package.jsonis found - run
npm installto automatically download all dependencies. This should create a folder callednode_modules - Configure 'environments' (see section below)
- run
pbiviz start - Follow microsoft documentation to preview the developer mode visual https://docs.microsoft.com/en-us/power-bi/developer/visuals/visuals-how-to-debug
- Install the secrets.json file as described below.
- To make this visual compile, you must create a file inside the
./src/directory called.secrets.json. - A template file is provided called
.secretes.example.jsonwhich shows what should be in this file. - This is necessary to avoid uploading the map service URLs and API keys used by the layers in this visual.
- To make this visual compile, you must create a file inside the