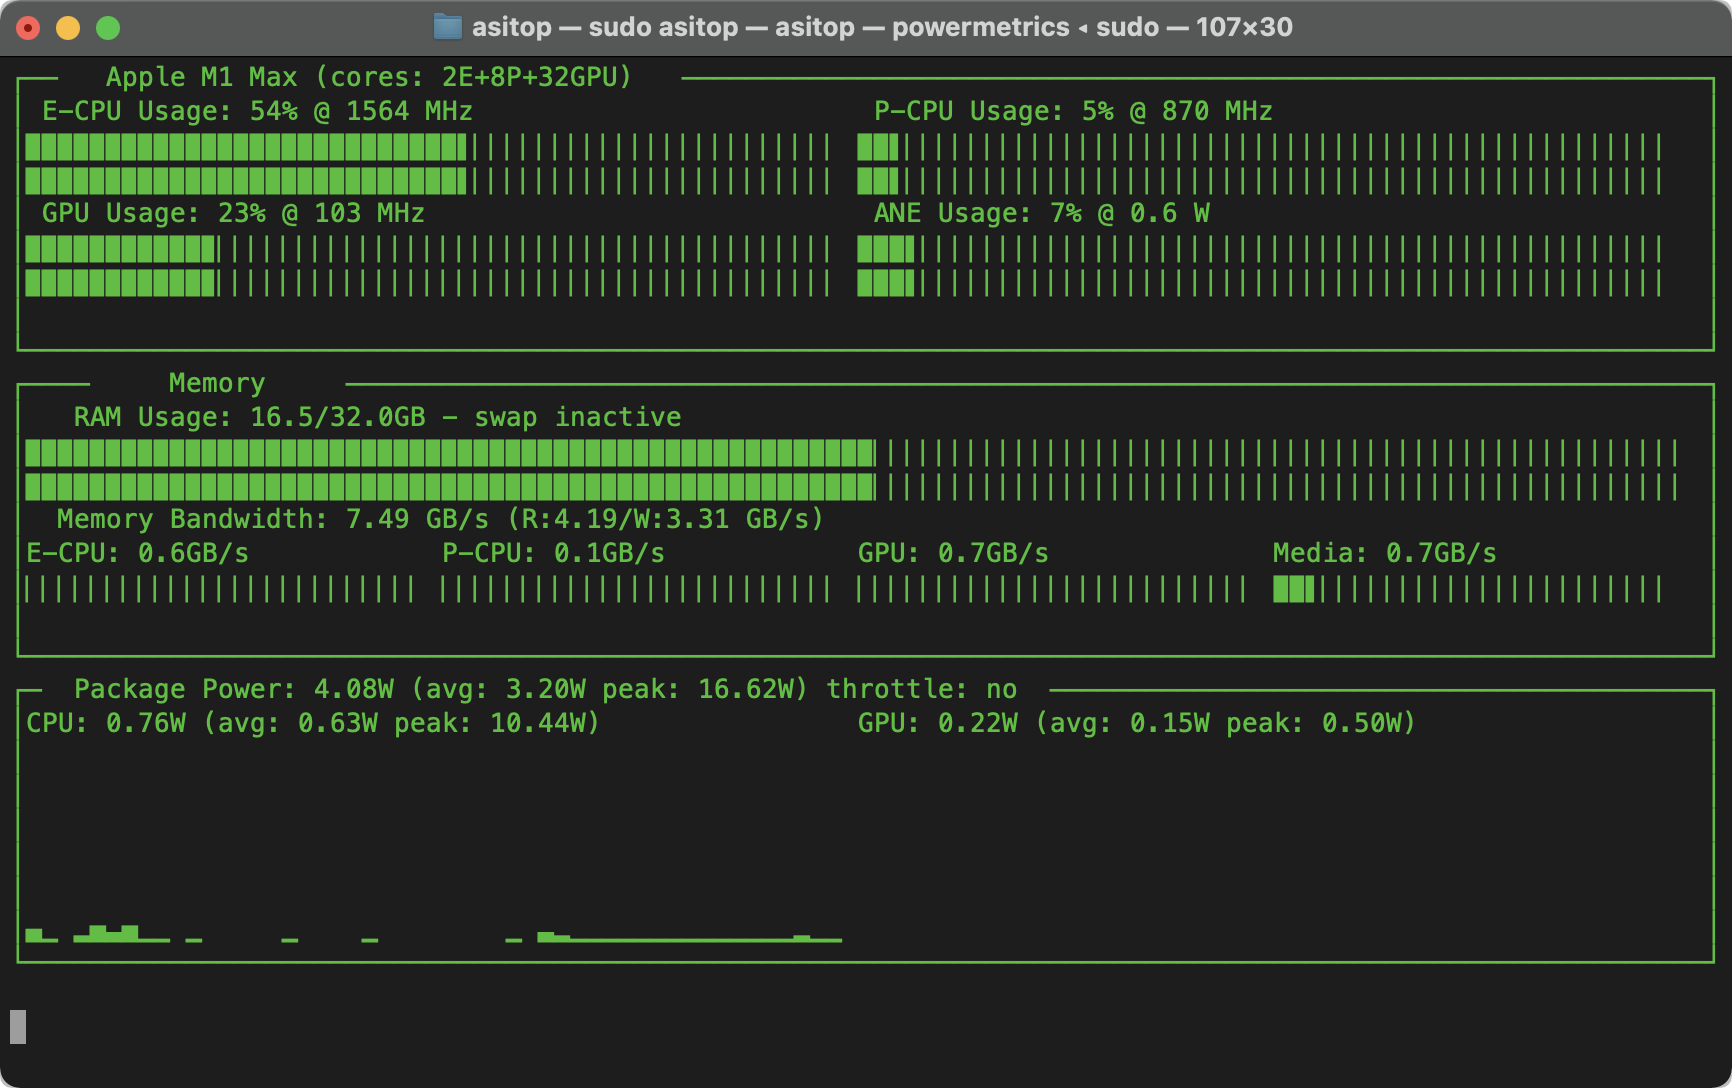
Performance monitoring CLI tool for Apple Silicon
pip install asitopA Python-based nvtop-inspired command line tool for Apple Silicon (aka M1) Macs.
- Utilization info:
- CPU (E-cluster and P-cluster), GPU
- Frequency and utilization
- ANE utilization (measured by power)
- Memory info:
- RAM and swap, size and usage
- (Apple removed memory bandwidth from
powermetrics)
- Power info:
- CPU power, GPU power (Apple removed package power from
powermetrics) - Chart for CPU/GPU power
- Peak power, rolling average display
- CPU power, GPU power (Apple removed package power from
asitop uses the built-in powermetrics utility on macOS, which allows access to a variety of hardware performance counters. Note that it requires sudo to run due to powermetrics needing root access to run. asitop is lightweight and has minimal performance impact.
asitop only works on Apple Silicon Macs on macOS Monterey!
asitop is a Python-based command line tool. You need pip to download and install asitop. macOS already comes with Python, to install pip, you can follow an online guide. After you install asitop via pip, you can use it via the Terminal.
# to enter password before start
# this mode is recommended!
sudo asitop

# it will prompt password on start
asitop

# advanced options
asitop [-h] [--interval INTERVAL] [--color COLOR] [--avg AVG]
optional arguments:
  -h, --help           show this help message and exit
  --interval INTERVAL  Display interval and sampling interval for powermetrics (seconds)
  --color COLOR        Choose display color (0~8)
--avg AVG Interval for averaged values (seconds)powermetrics is used to measure the following:
- CPU/GPU utilization via active residency
- CPU/GPU frequency
- Package/CPU/GPU/ANE energy consumption
- CPU/GPU/Media Total memory bandwidth via the DCS (DRAM Command Scheduler)
psutil is used to measure the following:
- memory and swap usage
sysctl is used to measure the following:
- CPU name
- CPU core counts
system_profiler is used to measure the following:
- GPU core count
Some information is guesstimate and hardcoded as there doesn't seem to be a official source for it on the system:
- CPU/GPU TDP
- CPU/GPU maximum memory bandwidth
- ANE max power
- Media engine max bandwidth
Because I didn't find something like this online. Also, just curious about stuff.
I did this randomly don't blame me if it fried your new MacBook or something.

