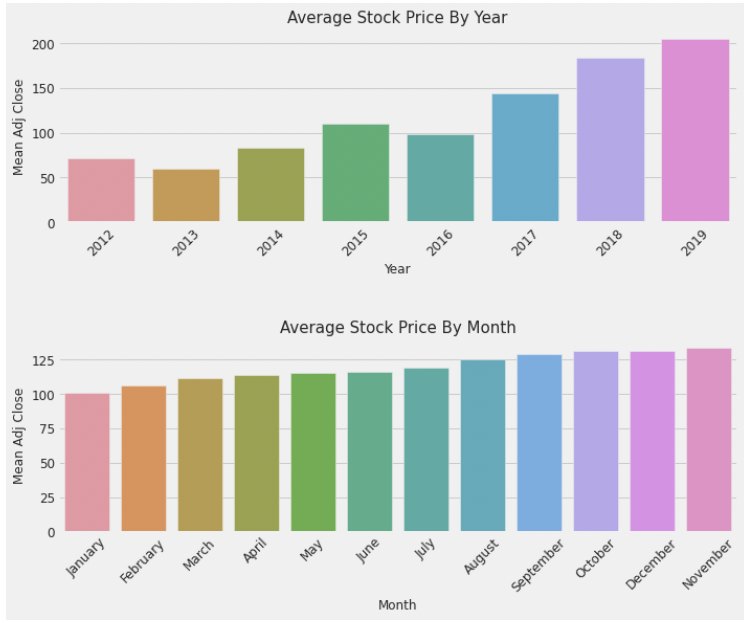
Comparison between Time Series Analysis Vs Fundamental Analysis for Apple Inc. Time Series Analysis uses historical patterns, seasonality to predict the future values by developing mathematical models that capture the series. We used Seasonal Auto-Regressive Moving Average(SARIMA) & Prophet for Time Series Forecasting.
Fundamental Analysis is established on foundations of economics,financial reports and researching several business/industry aspects. We take a look at financial ratios, balance sheets,domestic & global business environments,etc. At the end we arrive at conclusion of whether the security is undervalued or overvalued. We used Intrinsic Valuation in our case.
While pursuing my Finance Minors, I came across Business Valuation techniques and found it fascinating to value the company. I valued Apple by sincerely following Prof. Aswath Damodaran's guide to valuation. After coming across Data Mining courses, I found it interesting to predict Apple Stock Price using Time Series Forecasting Methodologies like ARIMA. Out of my curiosity, I questioned how would both the techniques compare with each other?
Time Series Forecasting Problem-Solved Using Seasonal ARIMA & Prophet.
Result Metrics
Mean Squared Error(MSE),Mean Absolute Percentage Error(MAPE), R2 Score.(Time Series)
Overvalued or Undervalued (Fundamental Analysis)
Whether to Invest in the underlying Stock/Security or Not.
- Python 3.6
- Pandas
- Matplotlib
- Sklearn
- Seaborn
- Statsmodels
- Scipy
- fbprophet
For Time Series : Data was collected from Yahoo Finance (https://finance.yahoo.com/). Ticker is 'AAPL' and time period for data is from 1st-April-2012 to 31st-Dec-2019 with Daily frequency containing 2011 records in total.
For Business Valuation data(10-K Fillings/Financial Reports) was available on Apple's Investor Relation Page(https://investor.apple.com/investor-relations/default.aspx)
Some additional links wrt to Business Valuation files :-
1.) Discounted Cash Flow Excel Sheet-https://drive.google.com/file/d/1EPU_JsF5EnPc9fhBniFpKeXH9J9GkFDt/view?usp=sharing 2.) Detailed Report Valuation - https://docs.google.com/document/d/1zNf9gxoUwTUocQpKLseXJqHEit162CRx1bI5srsSMTE/edit?usp=sharing
- Yahoo Finance [https://finance.yahoo.com/]
- https://machinelearningmastery.com/arima-for-time-series-forecasting-with-python/
- https://machinelearningmastery.com/gentle-introduction-autocorrelation-partial-autocorrelation/
- https://machinelearningmastery.com/time-series-data-visualization-with-python/
- https://otexts.com/fpp2/intro.html
