(CN)
#### 20230819 10:10:10,234 | com.alibaba.druid.filter.logging.Log4jFilter.statementLogError(Log4jFilter.java:152) | ERROR |  {conn-10593, pstmt-38675} execute error. update xxx set xxx = ? , xxx = ?  where RowGuid = ?
com.mysql.jdbc.exceptions.jdbc4.MySQLTransactionRollbackException: Lock wait timeout exceeded; try restarting transaction
The above error is definitely unfamiliar to colleagues who lack experience in database development. When encountering this error for the first time, they may not know how to handle it, whether it is a code issue or not. Many people may feel that the database is abnormal or if there is something wrong, so they should urgently seek treatment from the DBA.
Now let's popularize the science again. This error is lock wait timeout, which is mainly divided into [row lock wait timeout] and [metadata lock wait timeout] according to the type of lock.
Row lock wait timeout: When SQL times out due to waiting for row locks, it is called row lock wait timeout, which often occurs in multi concurrent transaction scenarios.
Metadata lock wait timeout: When SQL times out while waiting for a metadata lock, it is considered a metadata lock wait timeout, which often occurs during DDL operations.
For the row locks that encounter the most scenarios, to put it simply, lock timeout means that you have been queuing in the cafeteria for too long. A group of people are waiting in the cafeteria to pick up vegetables, getting spoons ready to go to the dish. However, if the person in front is too slow to pick up vegetables or standing there doing nothing, the person behind is waiting. In this case, everyone should understand. Of course, the database locking mechanism is not as simple as queuing in the cafeteria.
Unzip to any directory
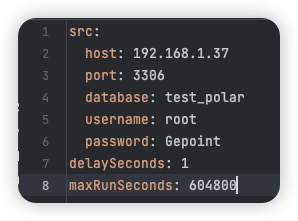
1 Please use Notepad++ or other text tools to edit the yml format file dbcfg. yml
Configure Database Connection
Where delaySeconds is the monitoring interval in seconds. If it is 1, the database is monitored every 1 second
maxRunSecondsIt is the maximum running time of tool monitoring, in seconds. If it is 604800, it means 7 days. After 7 days, the program will automatically exit and no longer be monitored
2 running tools
After decompression, enter cmd in the address bar of the tool directory and press Enter to call the cmd window
3 row lock information
If the database has row locks and other information, terminals such as cmd will have corresponding thread_id and SQLinformation, otherwise the output is No row lock info
4 log file
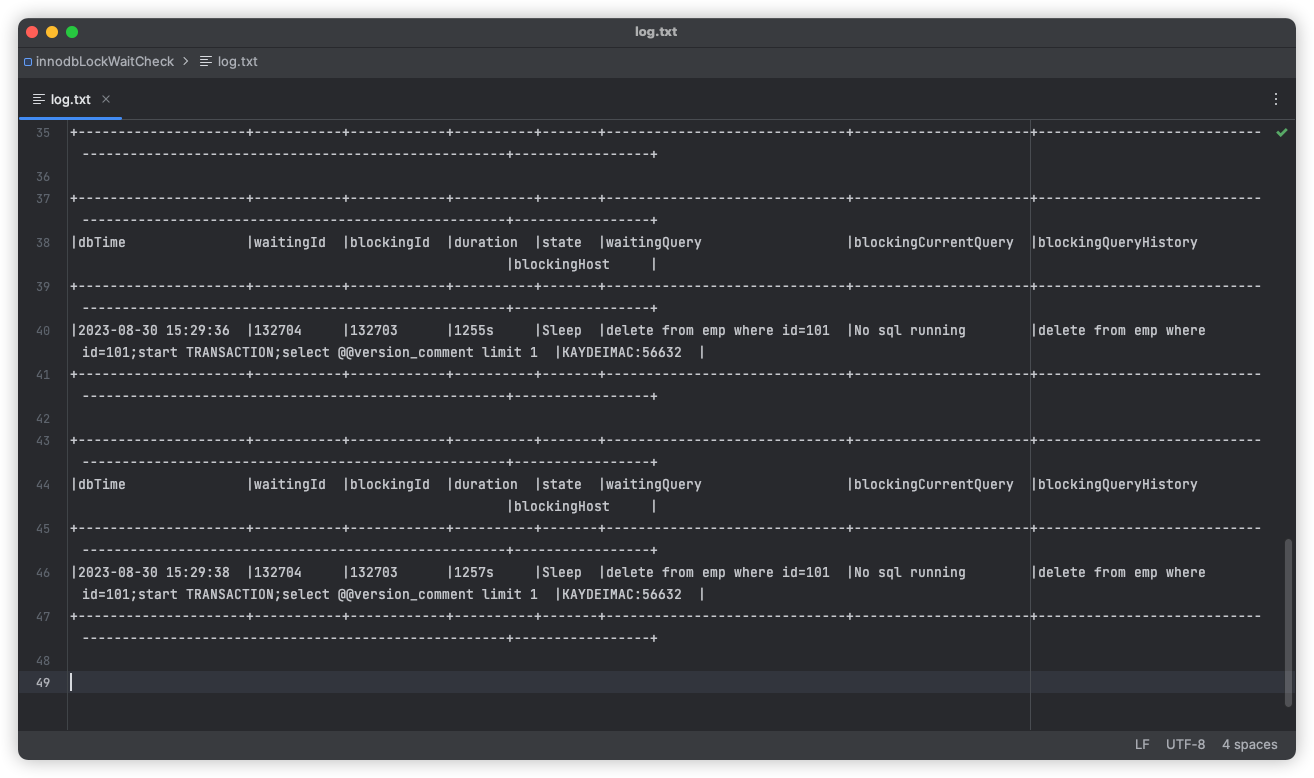
The line lock information monitored by the tool will be dumped to the log.txt file in the same path
The output results in the tool will display the following columns, as shown below:
dbTime:The current time of the database
waitingId:等待的线程id(即被阻塞的MySQL线程)
blockingId:The waiting thread ID (i.e. the blocked MySQL thread)
duration:Row lock waiting time, in seconds
state: The state of the thread, if it is Sleep, indicates that the current transaction is not executing SQL
waitingQuery: The SQL waiting for execution is the SQL that is blocked`
blockingCurrentQuery: The source of the blockage is SQL. If it is No SQL running, it indicates that the current transaction is not executing SQL. It is very likely that the corresponding program does not do anything or commit transactions after executing SQL code.
blockingQueryHistory: This is a historical SQL statement executed under the blocking source thread, with a maximum of 10 SQL statements recorded, each with a semicolon Separation, arranged in descending chronological order, where the most recently executed SQL is on the far left and the latest executed SQL is on the far right
blockingHost: The host name of the blocking source
In case studies on projects, it is often necessary to pay attention to the blockingQueryHistory column, because many transactions do not do anything or commit transactions after SQL execution, and the connection is always maintained. Therefore, this historical execution record needs to be used to assist in analysis, for example
blockingQueryHistory:
select count(*) from emp where id=1;select count(*) from emp where id=2;select @@version_comment limit 1
It can be seen that in the historical execution of SQL, there are select query statements select count (*). Many people naively think that only queries can block, but little do they know that MySQL is in the transaction information view events_Statements_History can only support 10 historical SQL by default, so in this case, after executing the update or delete operation and then executing other select query operations, now that you know the history operation of SQL, you can perform logical reasoning and investigate which method in the code the executed SQL originates from


