Ruby_memprofiler_pprof (RMP for short, in this README!) is a tool designed to help understand memory usage in large Ruby applications. It's intended to help answer questions like "why is my app's memory usage so high?", or "why is my app leaking memory?"; it's also designed to be usable in production environments, to help solve the dreaded "...but only in production??" part of those questions too.
RMP is a gem that's intended to run continuously inside a running Ruby app from the very beginning. It periodically produces profile data in the pprof format. It's capable of gathering a few different kinds of information, but at its heart the profiles RMP produces contain one key piece of information:
What codepaths (stack traces) allocated objects, that are still live as of when the profile was taken? (
retained_objects/retained_size)
Because RMP is designed for production use, it also supports setting a sample rate; when doing this, the profiles contain some random subset of allocations & retained objects, rather than the whole picture themselves. However, the pprof data can also be combined; so, over an entire production environment, you should still be able to get a solid picture of what, on average, is using memory.
Add the ruby_memprofiler_pprof gem to your Gemfile. Note that the gem is pre-alpha and has no stable interface yet, so you should pin to the exact version you want.
gem 'ruby_memprofiler_pprof', '=0.0.4'You can profile an application with ruby_memprofiler_pprof in two ways; either by starting it via the ruby_memprofiler_pprof_profile wrapper, or by integrating ruby_memprofiler_pprof directly into your code.
bundle exec ruby_memprofiler_pprof_profile YOUR_APP ...
With the default options, this will start your application, and periodically (every 30s) write pprof files to the tmp/profiles directory.
The ruby_memprofiler_pprof_profile wrapper application works by simply adding -rruby_memprofiler_pprof/profile_app to the RUBYOPT environment variable, so that when your application starts, it will automatically require the profiling machinery.
When using the profiler in this way, some parts of its behaviour can be configured by environment variables:
RUBY_MEMPROFILER_PPROF_SAMPLE_RATE: The fraction (from 0 to 1) of allocated objects that should be sampled. Has the same effect asMemprofilerPprof::Collector#sample_rate. Defaults to 1.RUBY_MEMPROFILER_PPROF_ALLOC_RETAIN_RATE: The fraction (from 0 to 1) of sampled allocations that should be profiled. Normally, when RMP samples an allocation, it will produce an entry in theallocationsprofile information recording where and when this object was allocated. If the object is still alive when the sample data is produced, it will also appear on theretained_objectssection of the profile. Ruby programs usually have very many short-lived allocations, so theallocationssection can turn out to be enormous; they're also often less interesting than analysing long-lived objects. So, theRUBY_MEMPROFILER_PPROF_ALLOC_RETAIN_RATEsetting specifies a fraction of these allocation events to keep; setting this to zero would mean that only information about retained objects is kept. Has the same effect asMemprofilerPprof::Collector#allocation_retain_rate. Defaults to 1.RUBY_MEMPROFILER_PPROF_MAX_ALLOC_SAMPLES: The maximum number of allocation samples to keep in RMP's internal buffers; if more samples than this are collected before being periodically flushed to files, they will be dropped. Has the same effect asMemprofilerPprof::Collector#max_allocation_samples. Defaults to 10000.RUBY_MEMPROFILER_PPROF_MAX_HEAP_SAMPLES: The maximum number of live objects to keep track of in RMP's internal buffers; if more object allocations than this are traced, they will be dropped. Has the same effect asMemprofilerPprof::Collector#max_heap_samples. Defaults to 50000.RUBY_MEMPROFILER_PPROF_FILE_PATTERN: The path and pattern template to use for the written-out pprof files. See the documentation forMemprofilerPprof::FileFlusher#patternfor details of the interpolation options available here. Defaults totmp/profiles/mem-%{pid}-%{isotime}.pprof.
Integrating ruby_memprofiler_pprof directly into your code gives you more control over flushing the generated profiles out of RMP's internal buffers. First, you need to construct a MemprofilerPprof::Collector object, and call #start! on it, as early as possible in your program, to begin tracking objects:
require 'ruby_memprofiler_pprof'
$rmp_collector = MemprofilerPprof::Collector.new

# Configure the $rmp_collector object here, e.g.
$rmp_collector.sample_rate = 0.1

$rmp_collector.start!
Then, you will need to organise to periodically call #flush on this collector. Calling #flush clears out the internal buffers of the collector, and returns a pprof-encoded binary string containing the profile data. You might want to write this to disk, send it to cloud storage, or any number of other things. MemprofilerPprof::BlockFlusher contains a useful primitive for periodically calling #flush in a background thread and passing the profile data to a block you specify; for example:
$rmp_flusher = MemprofilerPprof::BlockFlusher.new(
  $rmp_collector,
  interval: 15, # seconds
  on_flush: ->(pprof_data) {
    write_profile_data_to_s3_somehow(pprof_data)
  },
)
However, you're free to organise the calls to #flush however makes sense for your application.
It's part of this project's aim to build some tooling to easily aggregate profiles across different processes and guide app developers towards which things are having the biggest impact on memory usage. In particular, what kind of objects (and where were they allocated) increase over time, indicating a potential cause for a memory leak. However, right now, these tools don't exist yet.
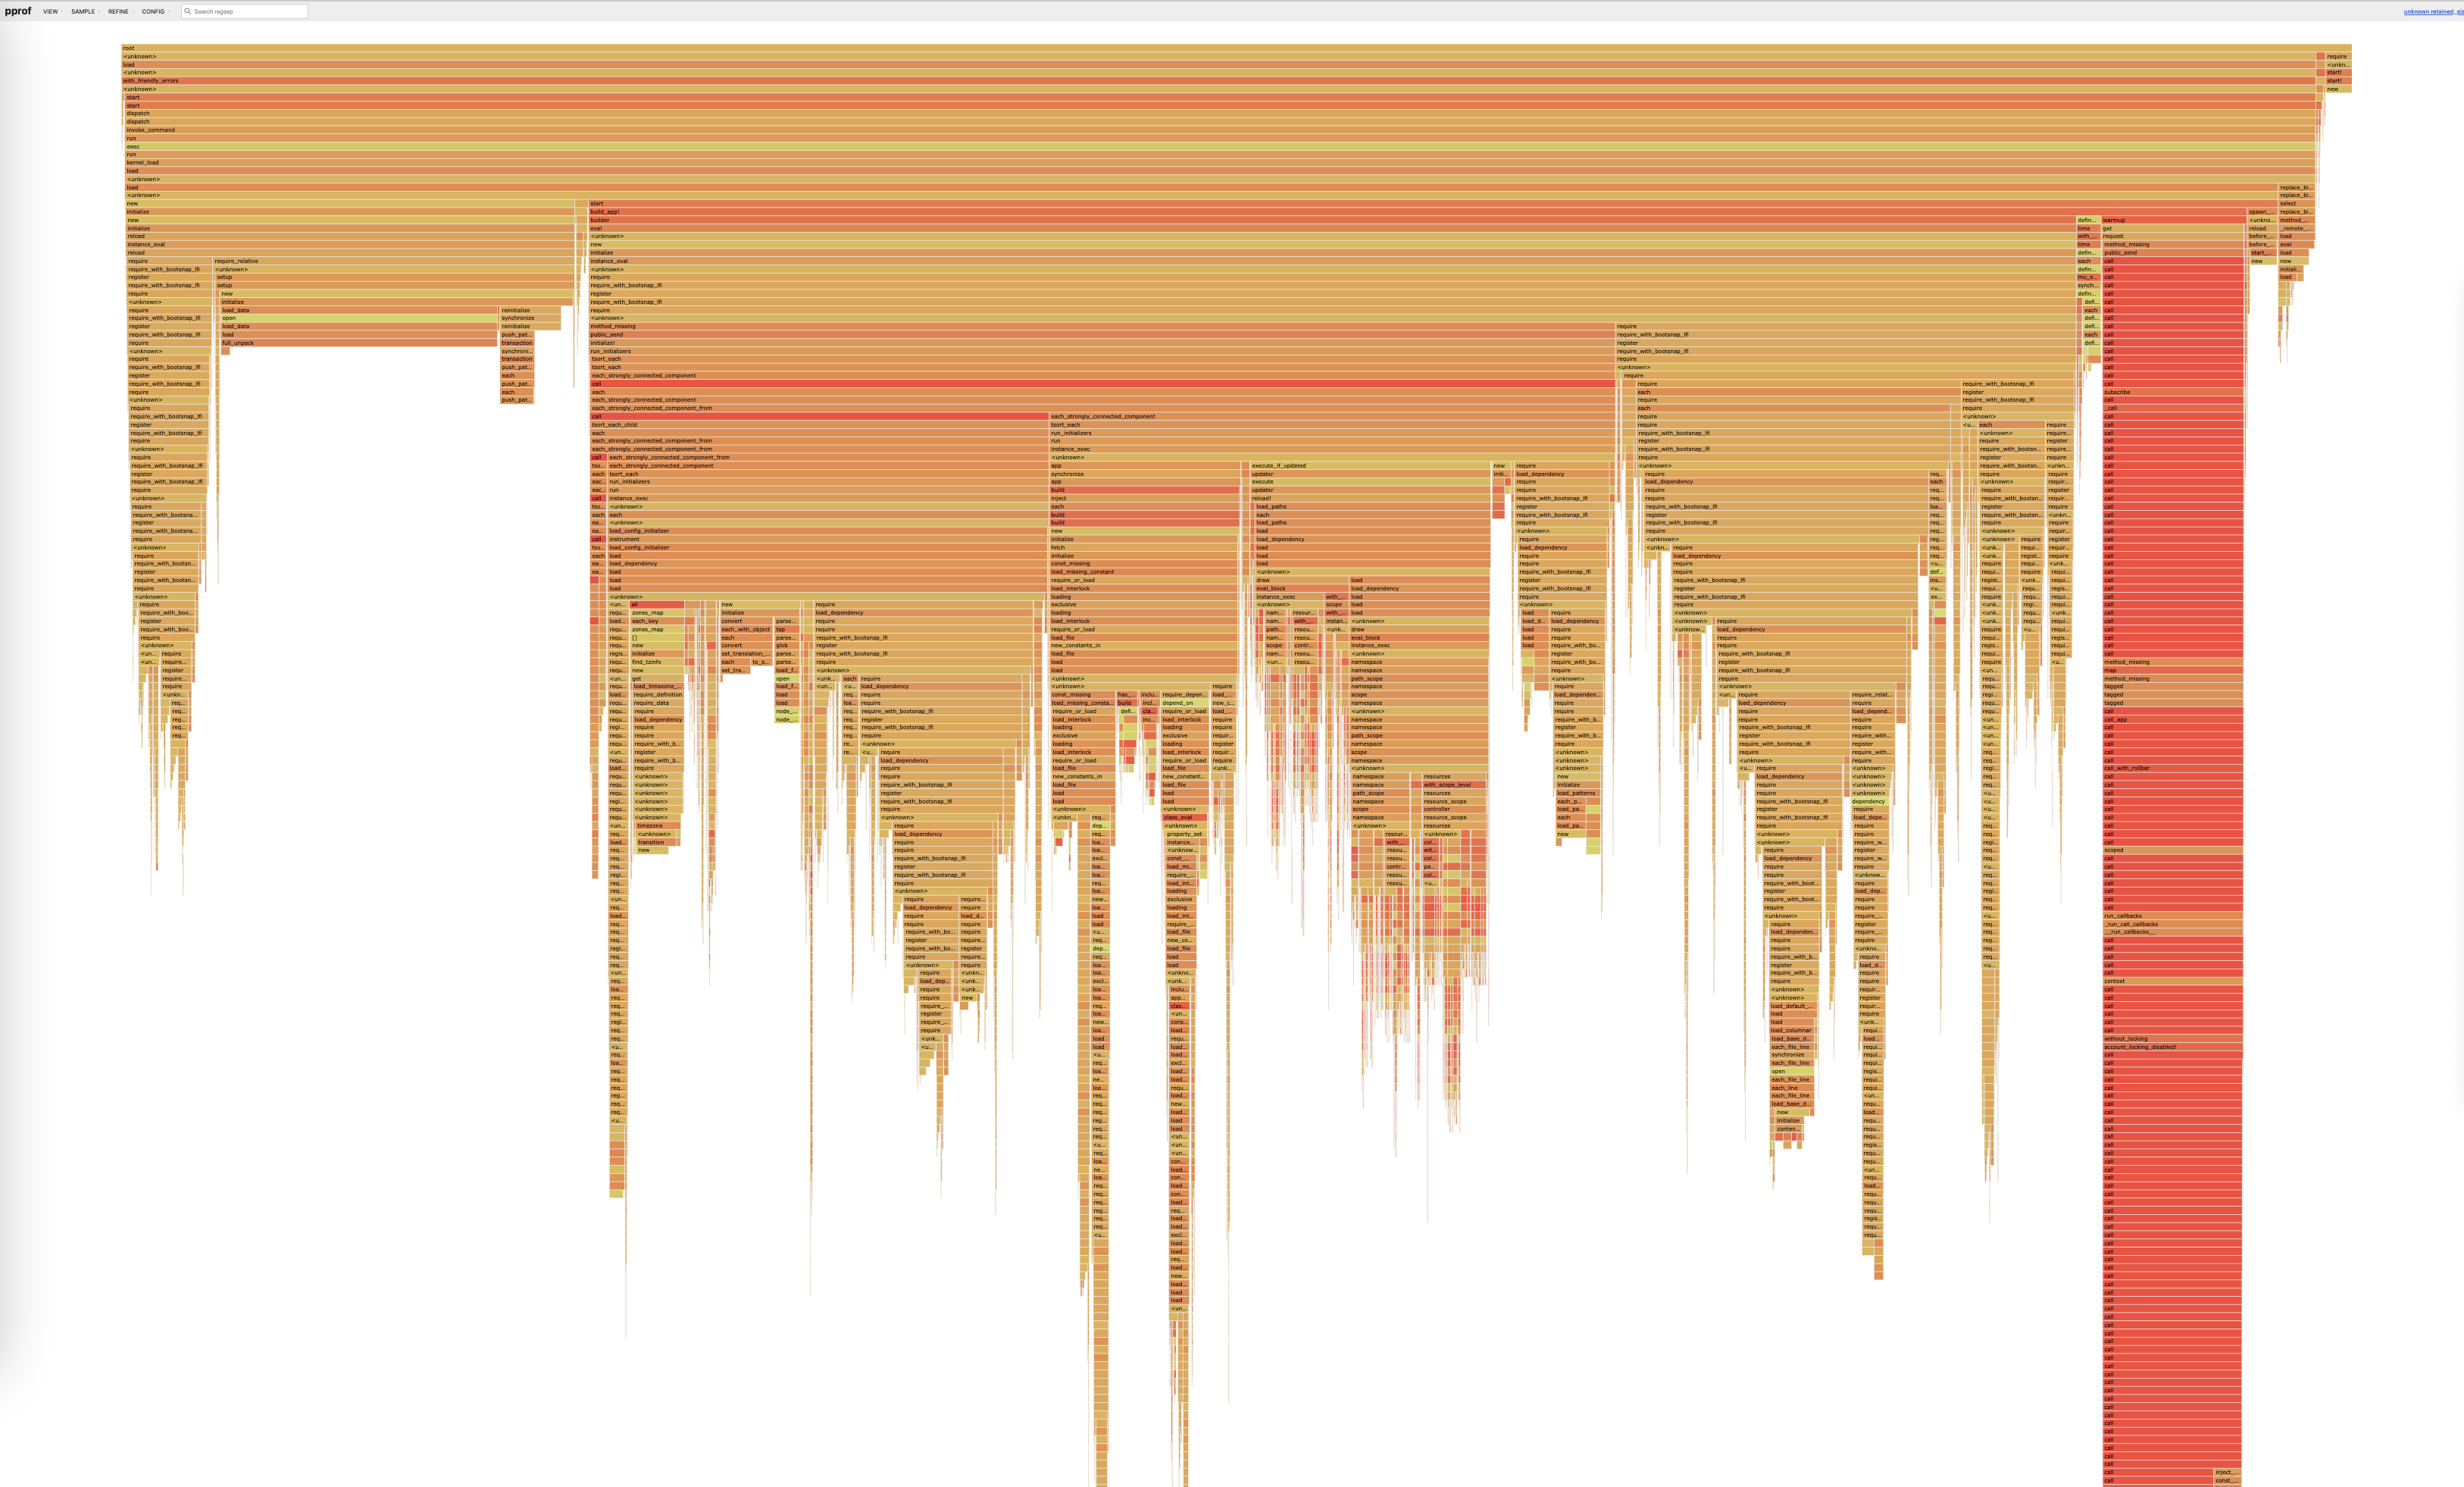
However, since RMP produces standard format pprof profiles, they can be viewed and analysed with any other pprof program. For example, you can get a flamegraph of allocation stacktraces for allocated or retained objects using the Golang pprof viewer, go tool pprof:
go tool pprof -http :8987 <path-to-output.pprof>
This will open a web UI to analyise the profile. Perhaps the most useful view is the Flame graph view ("View > Flame graph"), and you can select to view either allocated or live objects (Sample > "allocation_size" or Sample > "retained_size"). The following is an example for a profile collected after booting a large Rails app.
There's a huge amount to wade through here! The intention of this project is to provide some more purpose-built tools for analyisng memory use for this kind of large app from these profiles.
