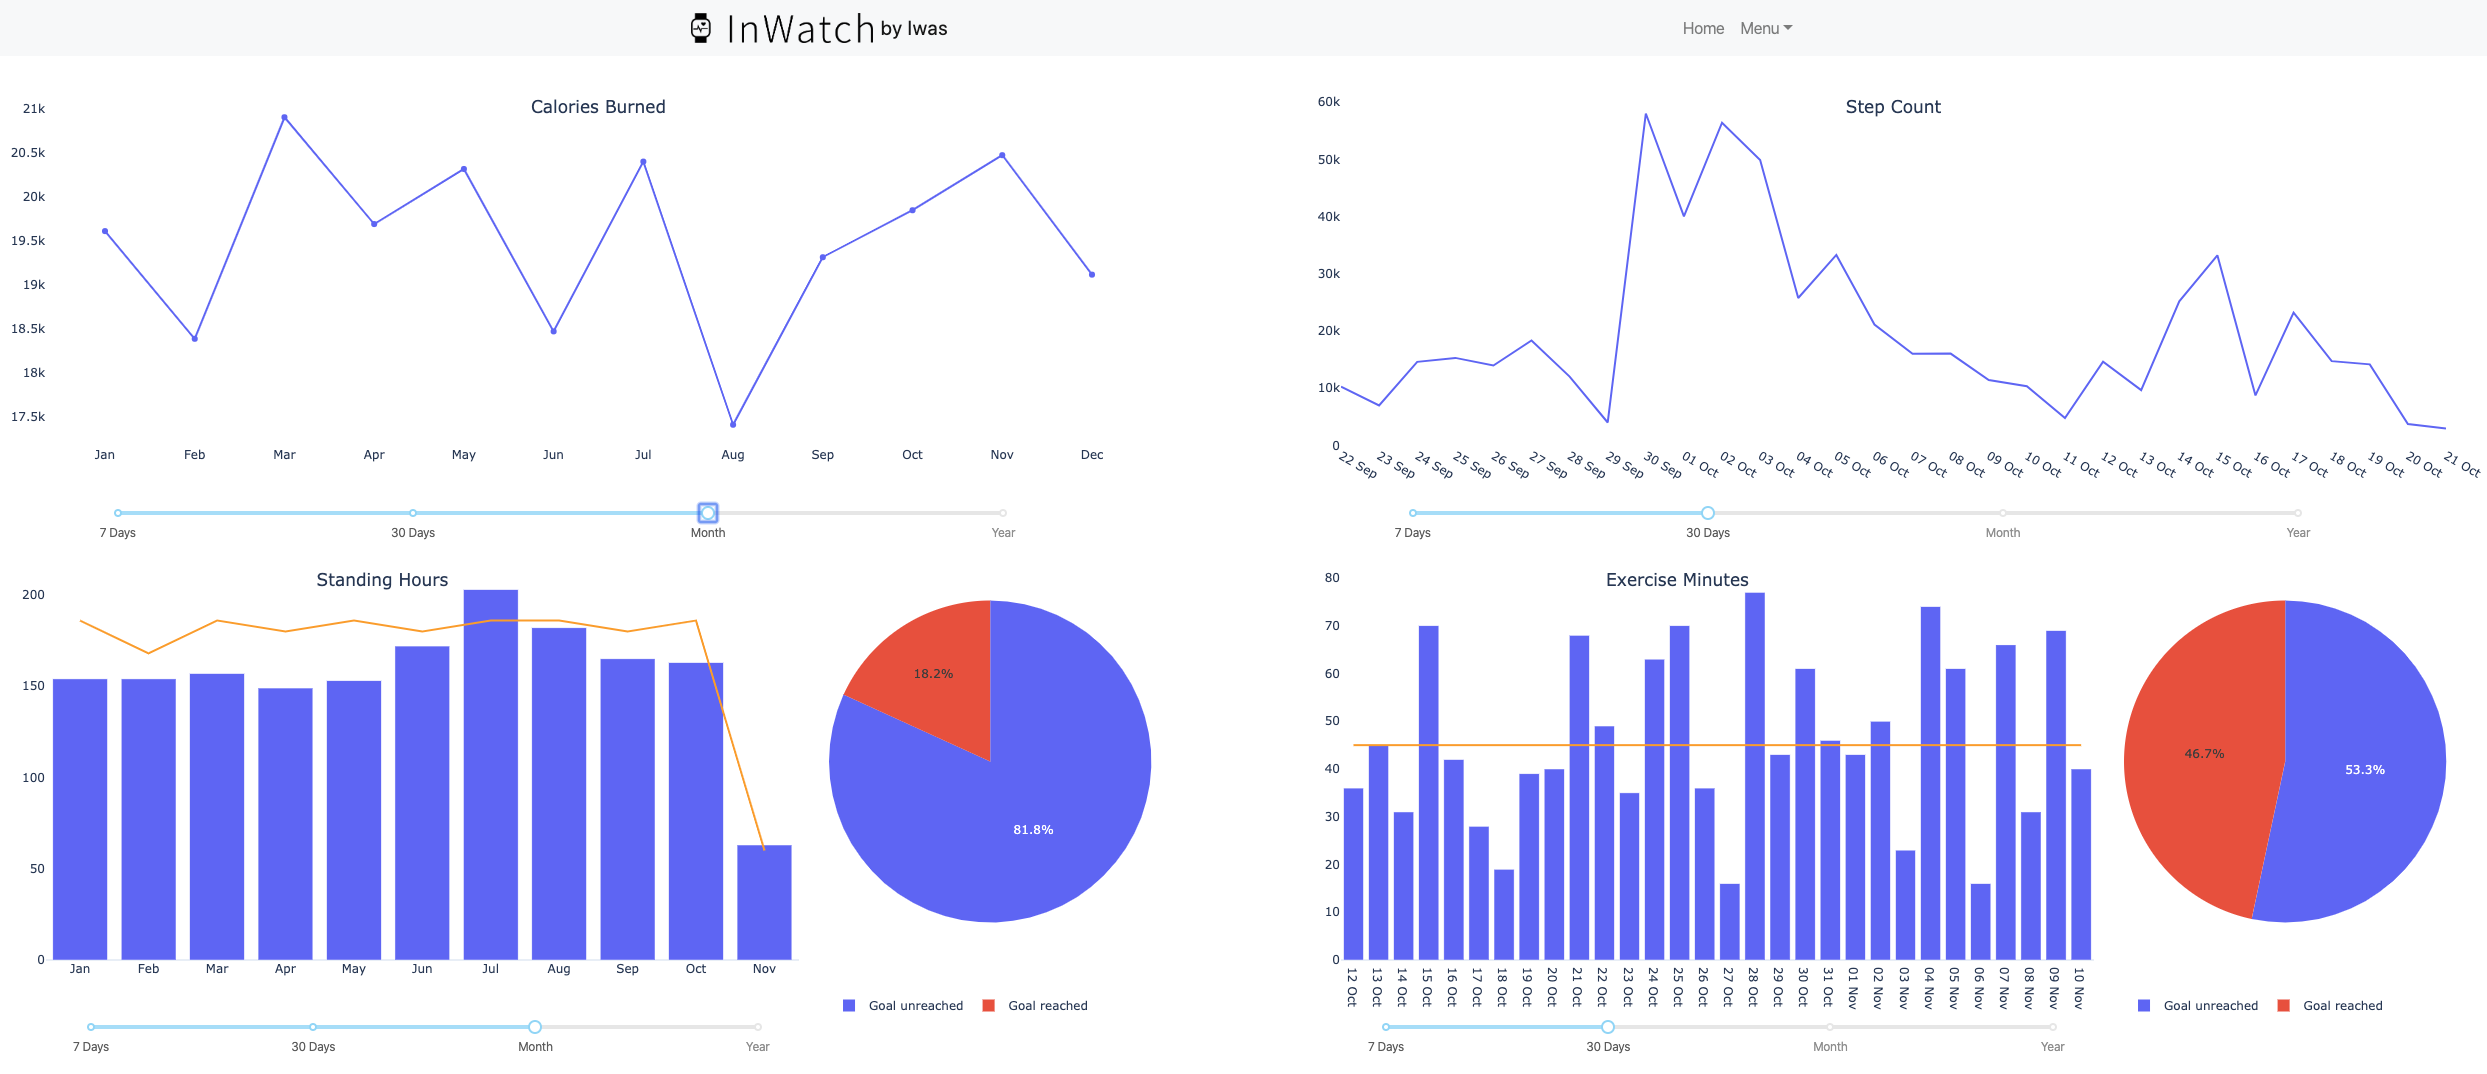
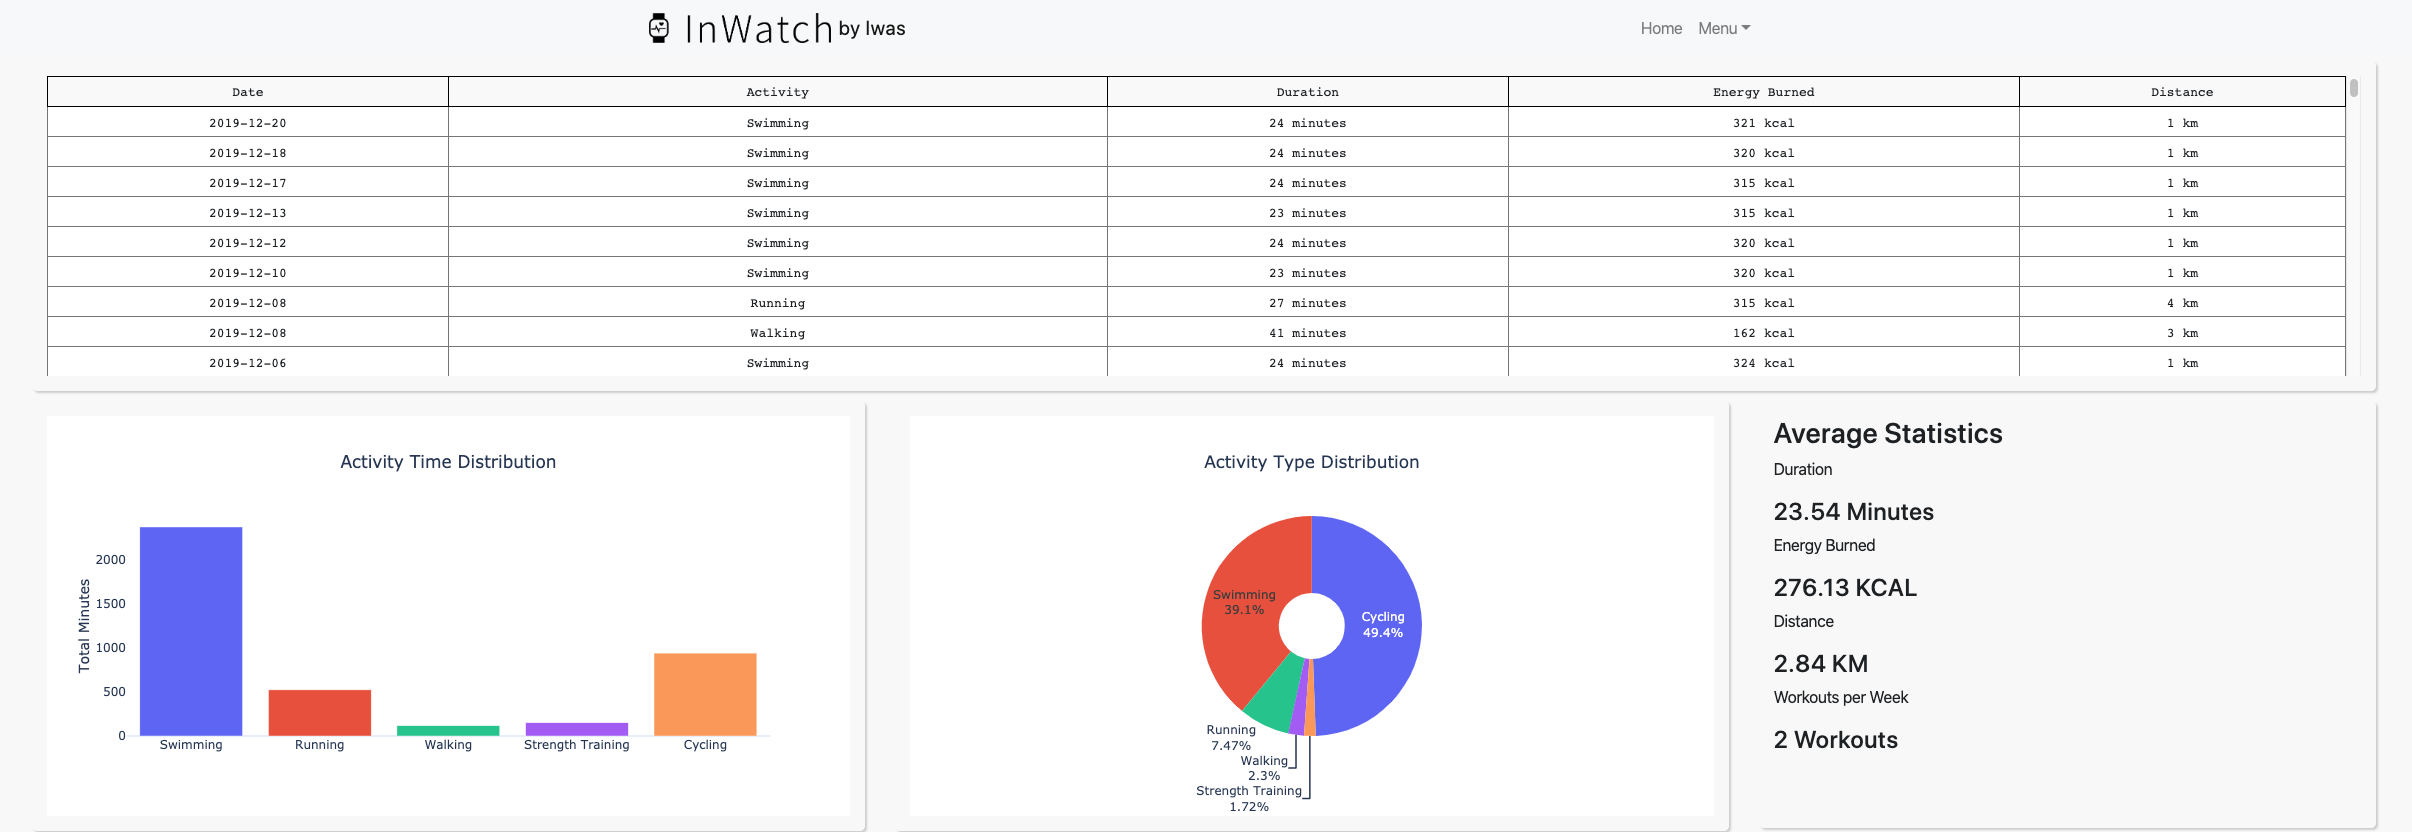
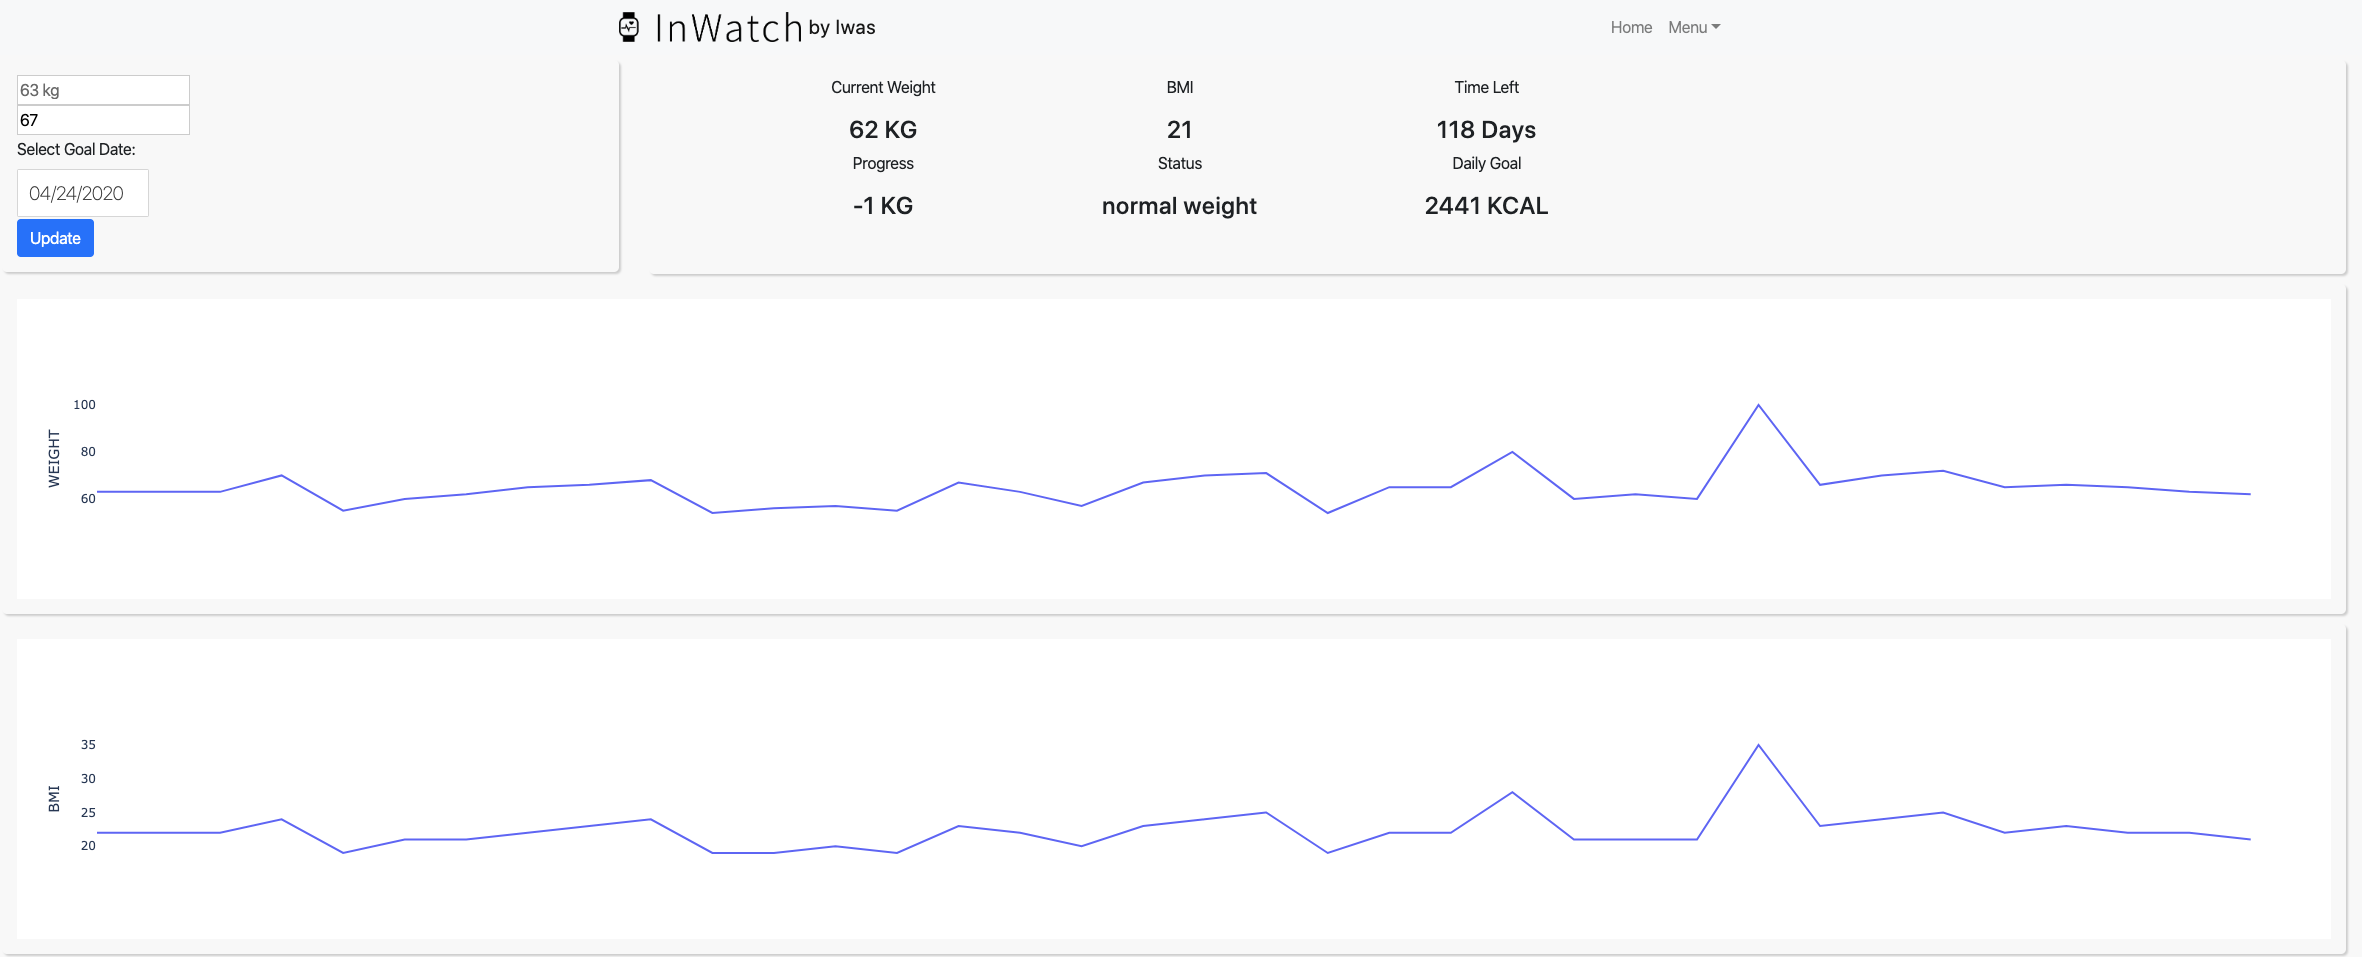
InWatch is a web application that transforms raw Apple Watch sensor-data into an interactive multi-page dashboard with visualizations, insightful statistics and offers tools to utilize the measured data.
Used Technologies/Stack: Flask, Dash by Plotly, SQLAlchemy(SQLite), Pandas, Numpy, Plotly, Bootstrap, HTML, CSS, Heroku
Frameworks: Flask, Dash by Plotly
Database: SQLite (Flask SQLAlchemy)
Deployment: Heroku
Important Libraries: Pandas, Numpy, Dash Bootstrap Components, Plotly
Basic Page: Interactive Time Sereies Visualizations (Burned Calories, Step Count, Standing Time, Exercise Time) with option to show last 7 days, last 30 days, months of the year and total years
Workout Page: Scrollable Data-Table with Historic Workouts, Activity Type Distribution Plot, Activity Time Distribution Plot and Average Activity Statistics. Want to take a picture of a graph? - just hover over the graph and save it as png!
Smart Diet Page: Everytime the weight is upgraded, the new weight is added to the SQLite database and the visualizations and statistics are upgraded simultaneously, too. I also implented a tool to be able to set a weight-goal and goal-date, which utilizes sensor-data of burned energy to accurately calculate how many calories need to be consumed in order to succesfully reach the weight-goal in time for the date-goal!


