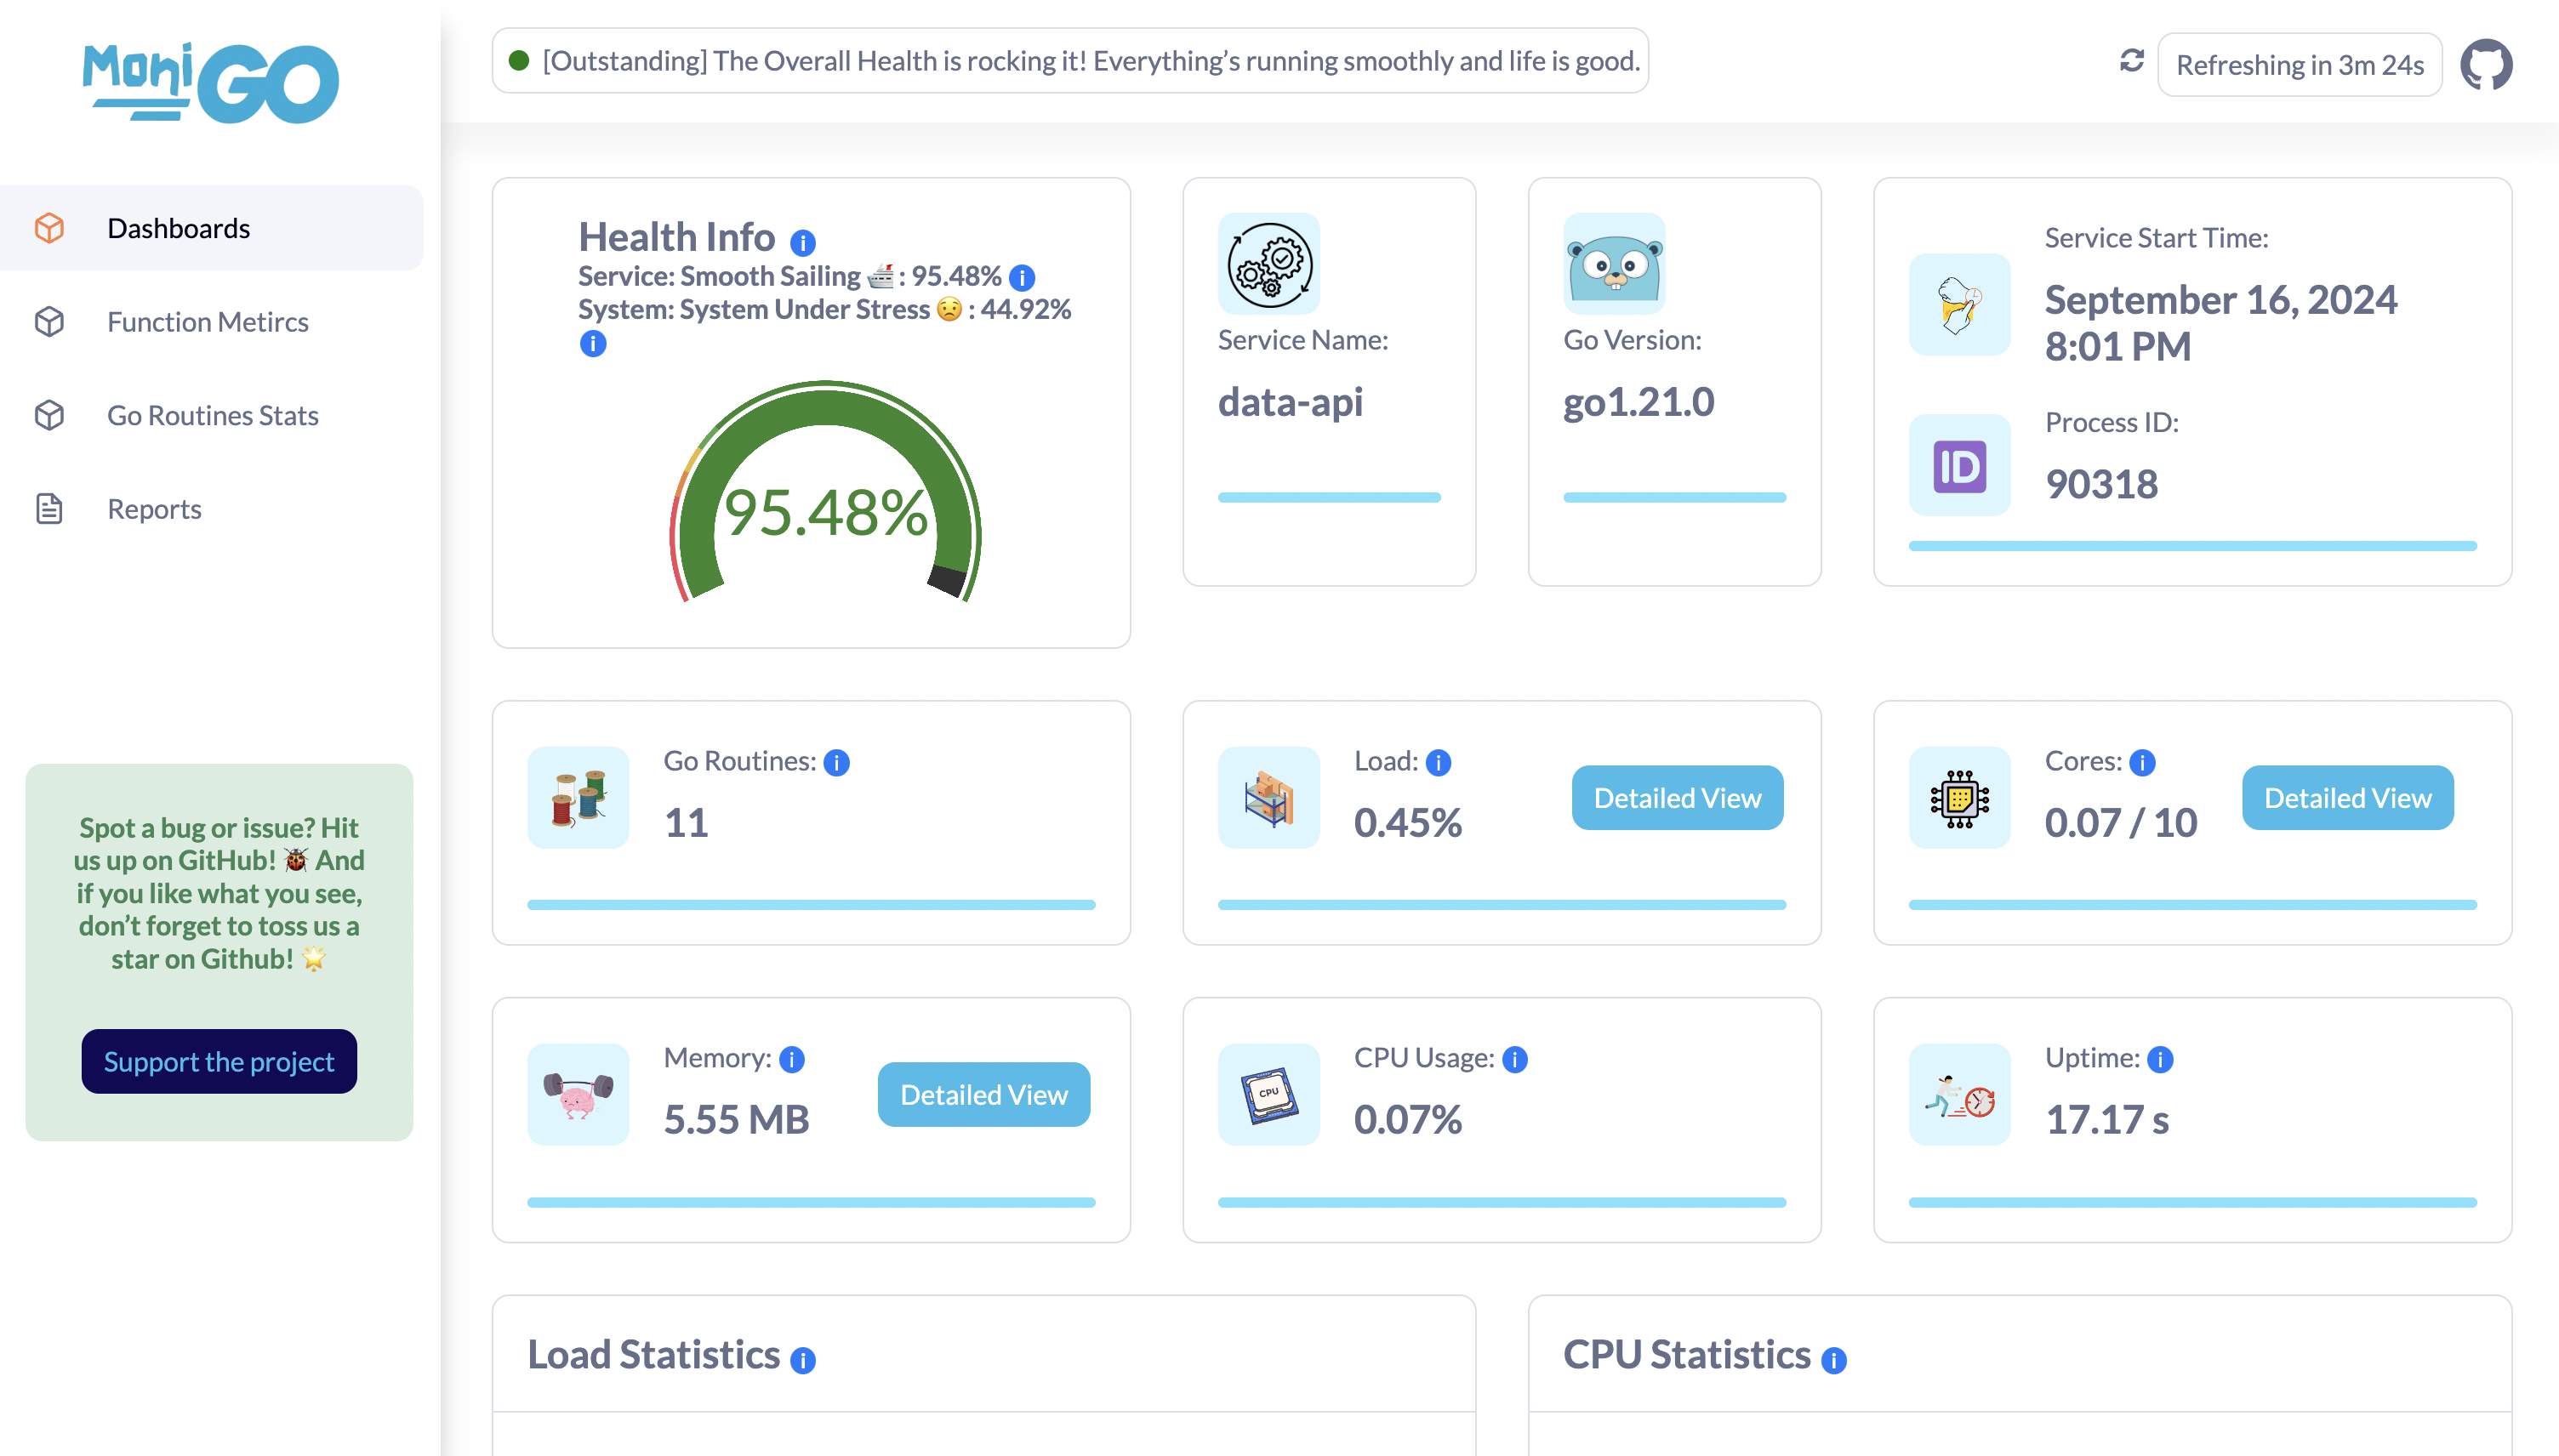
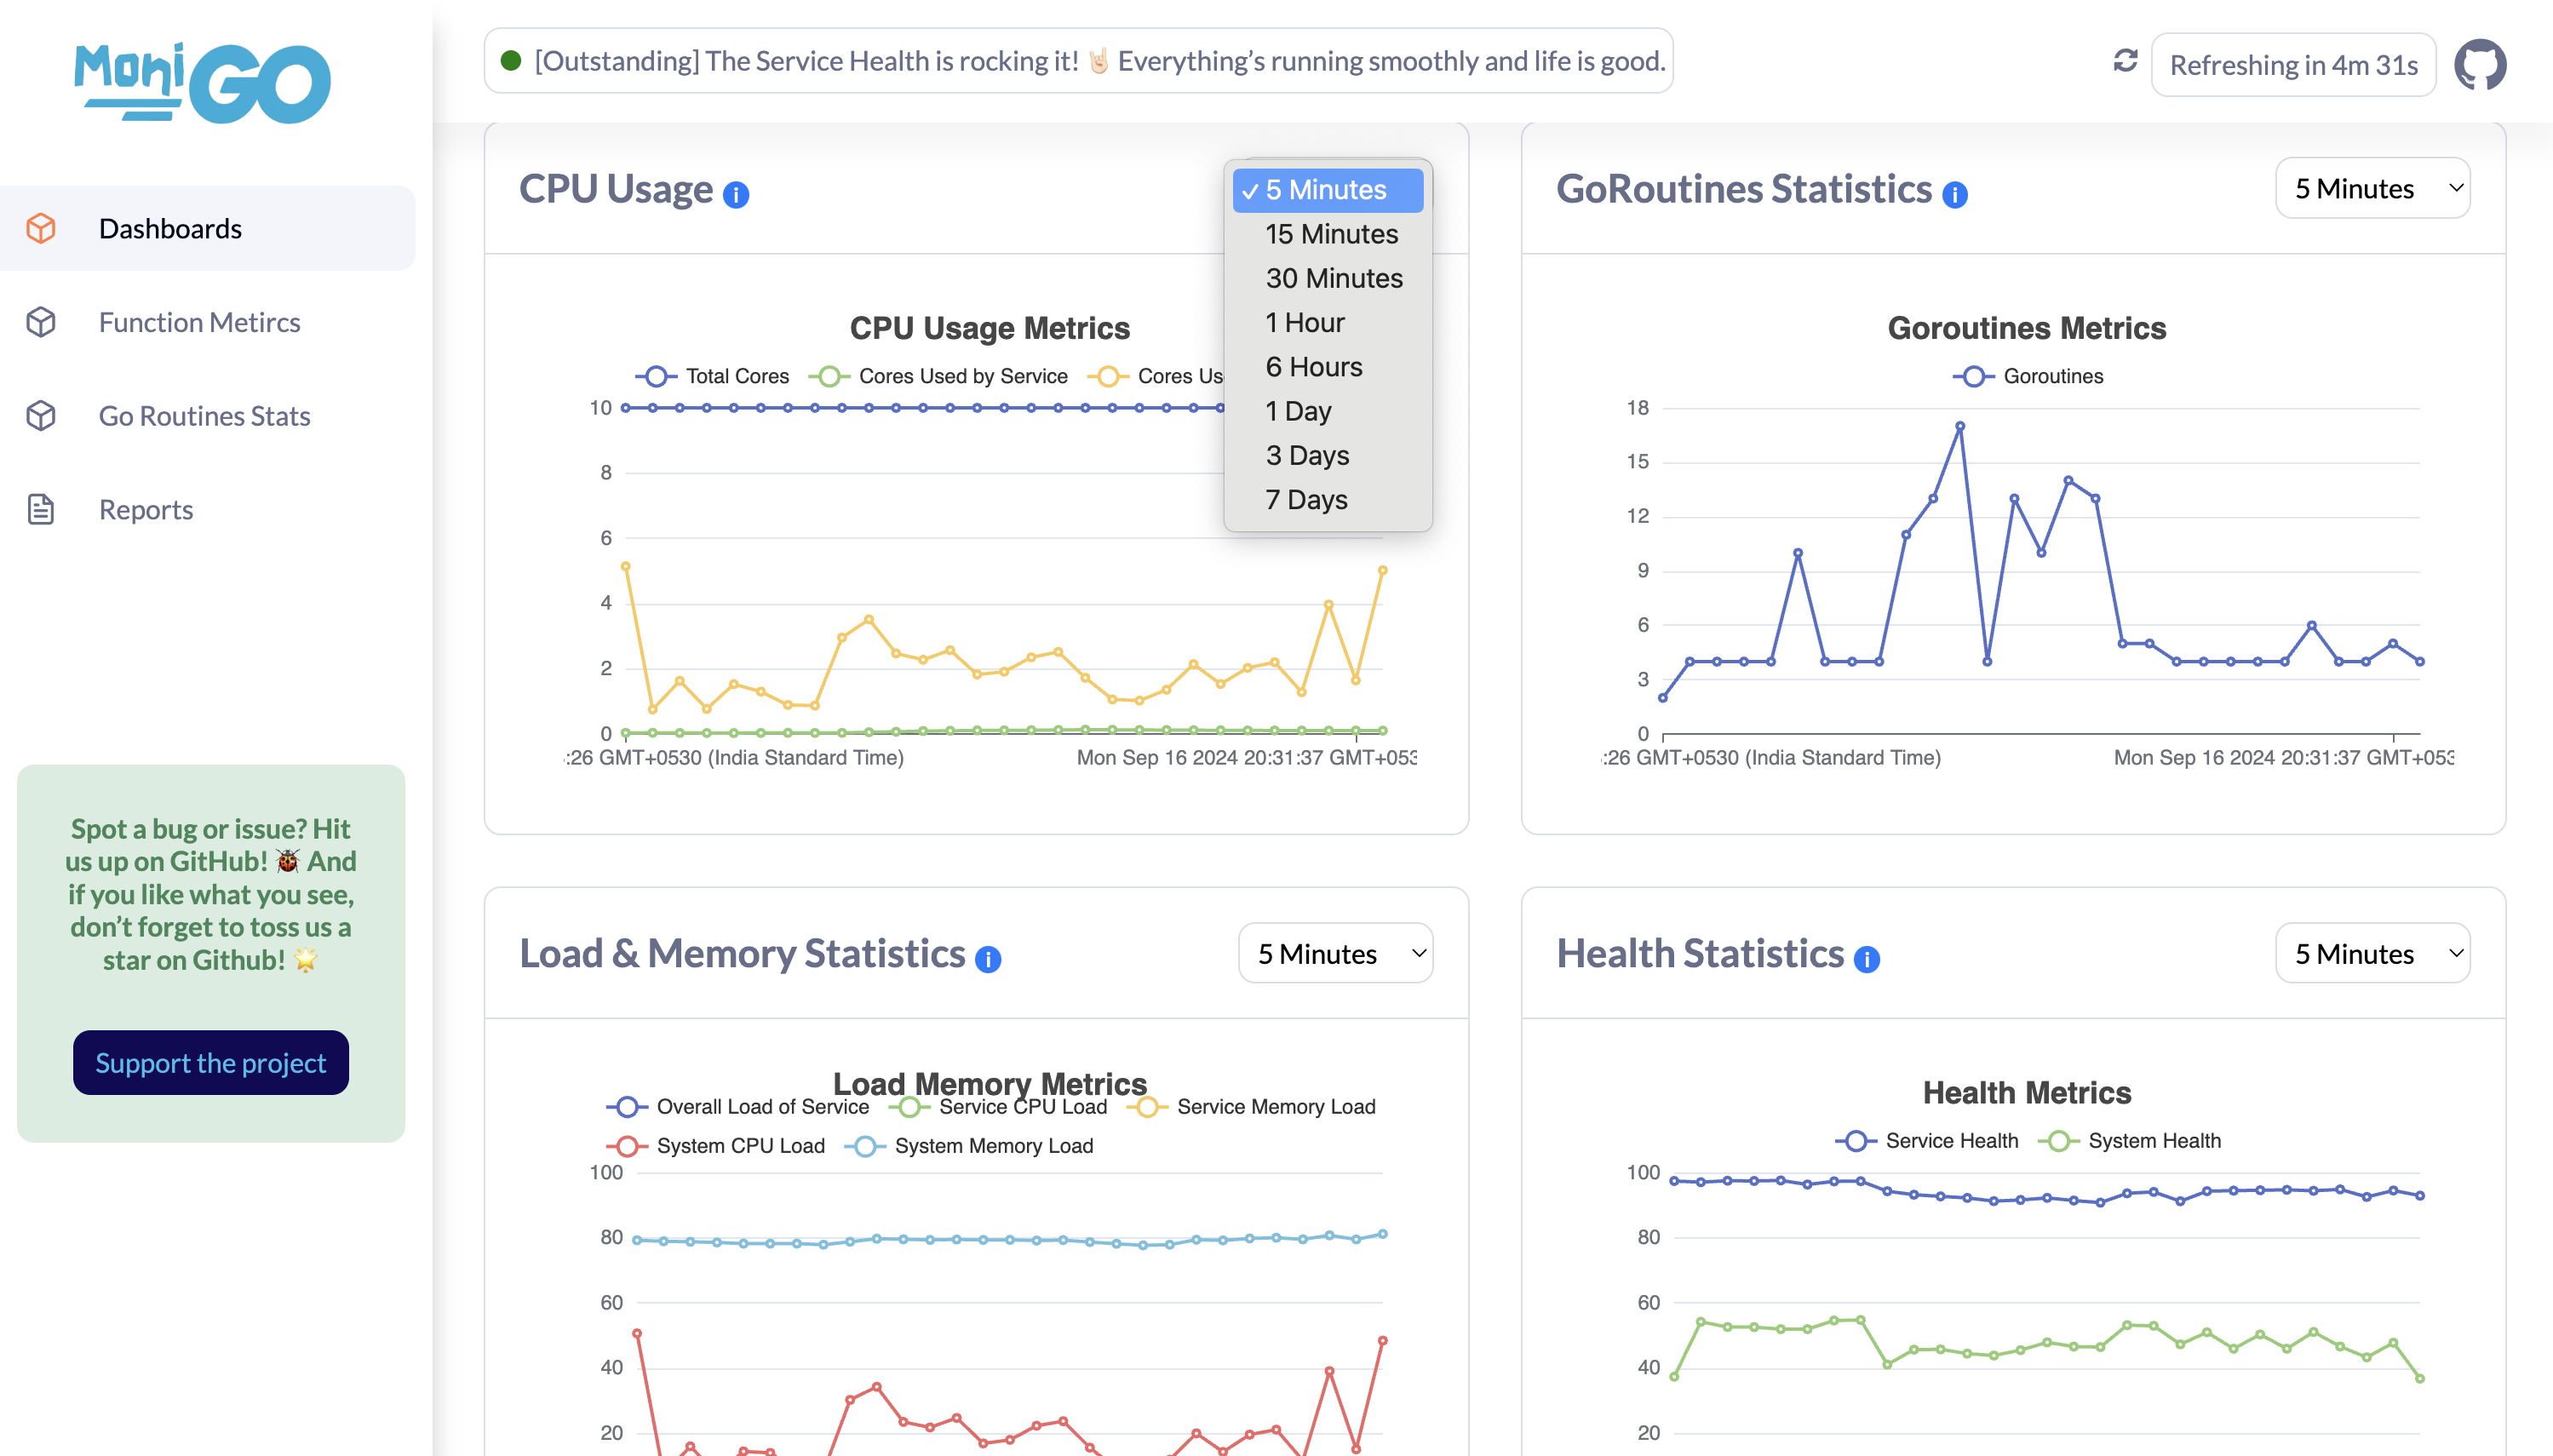
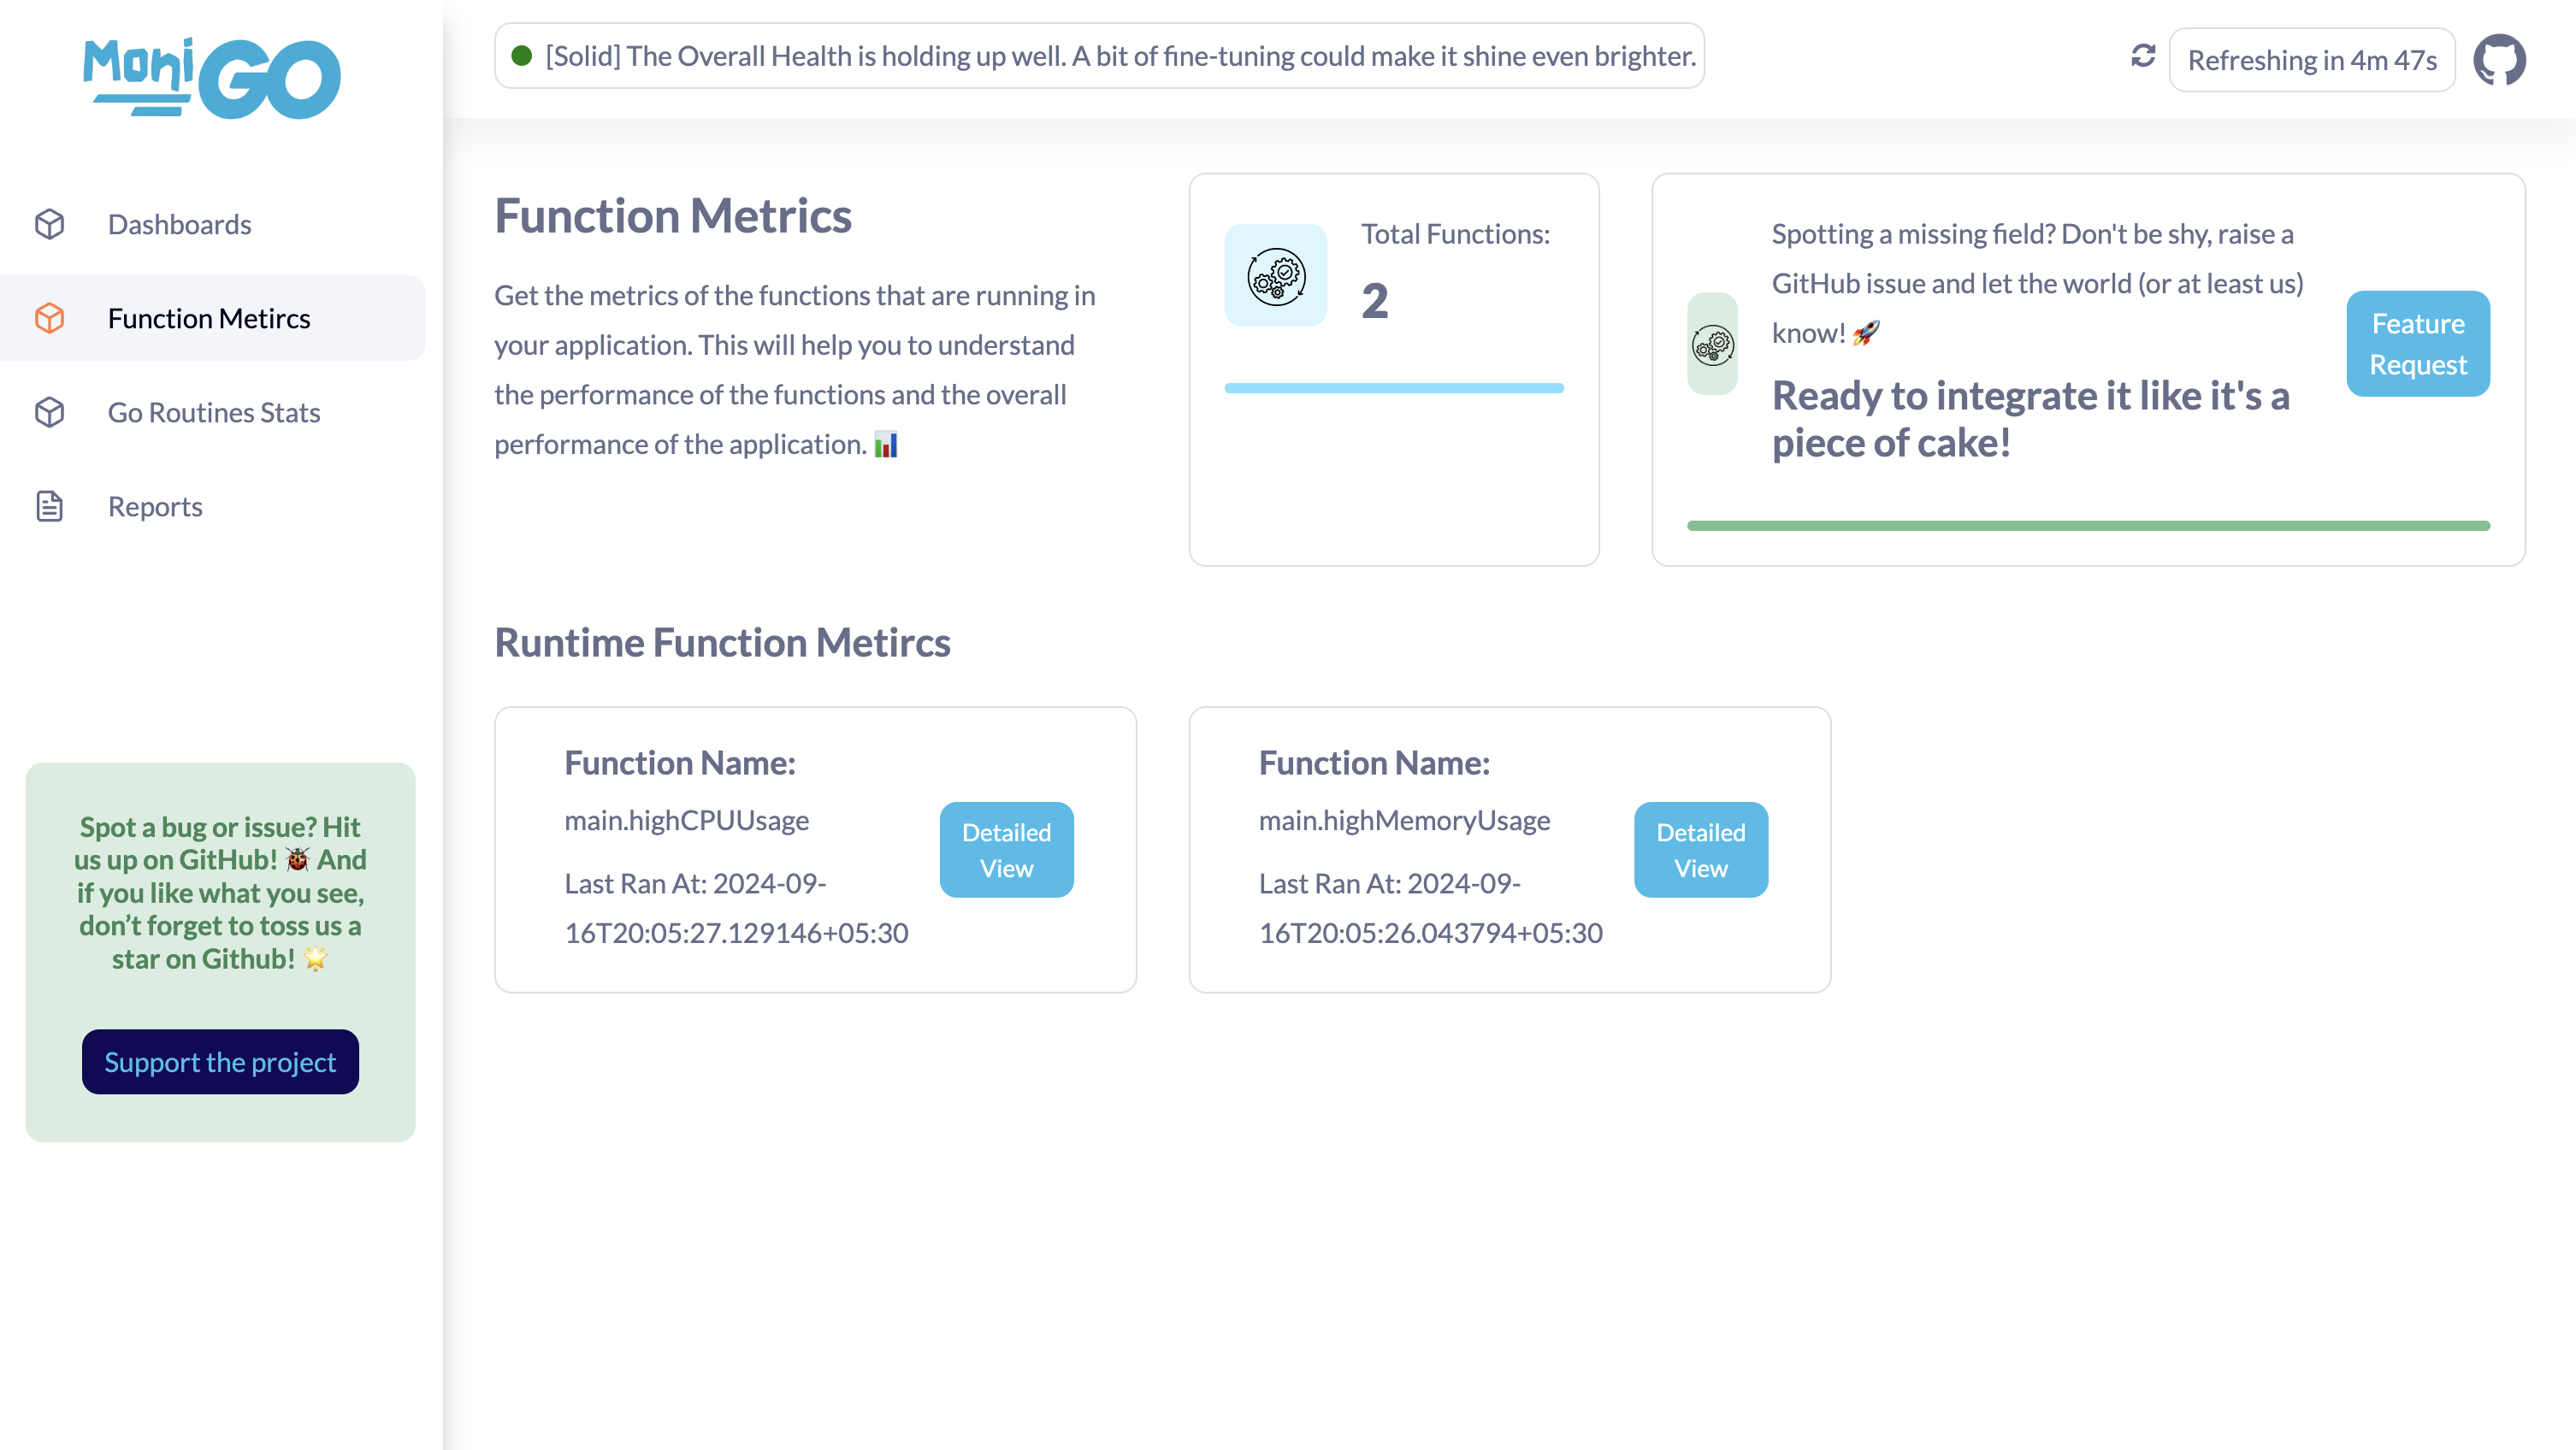
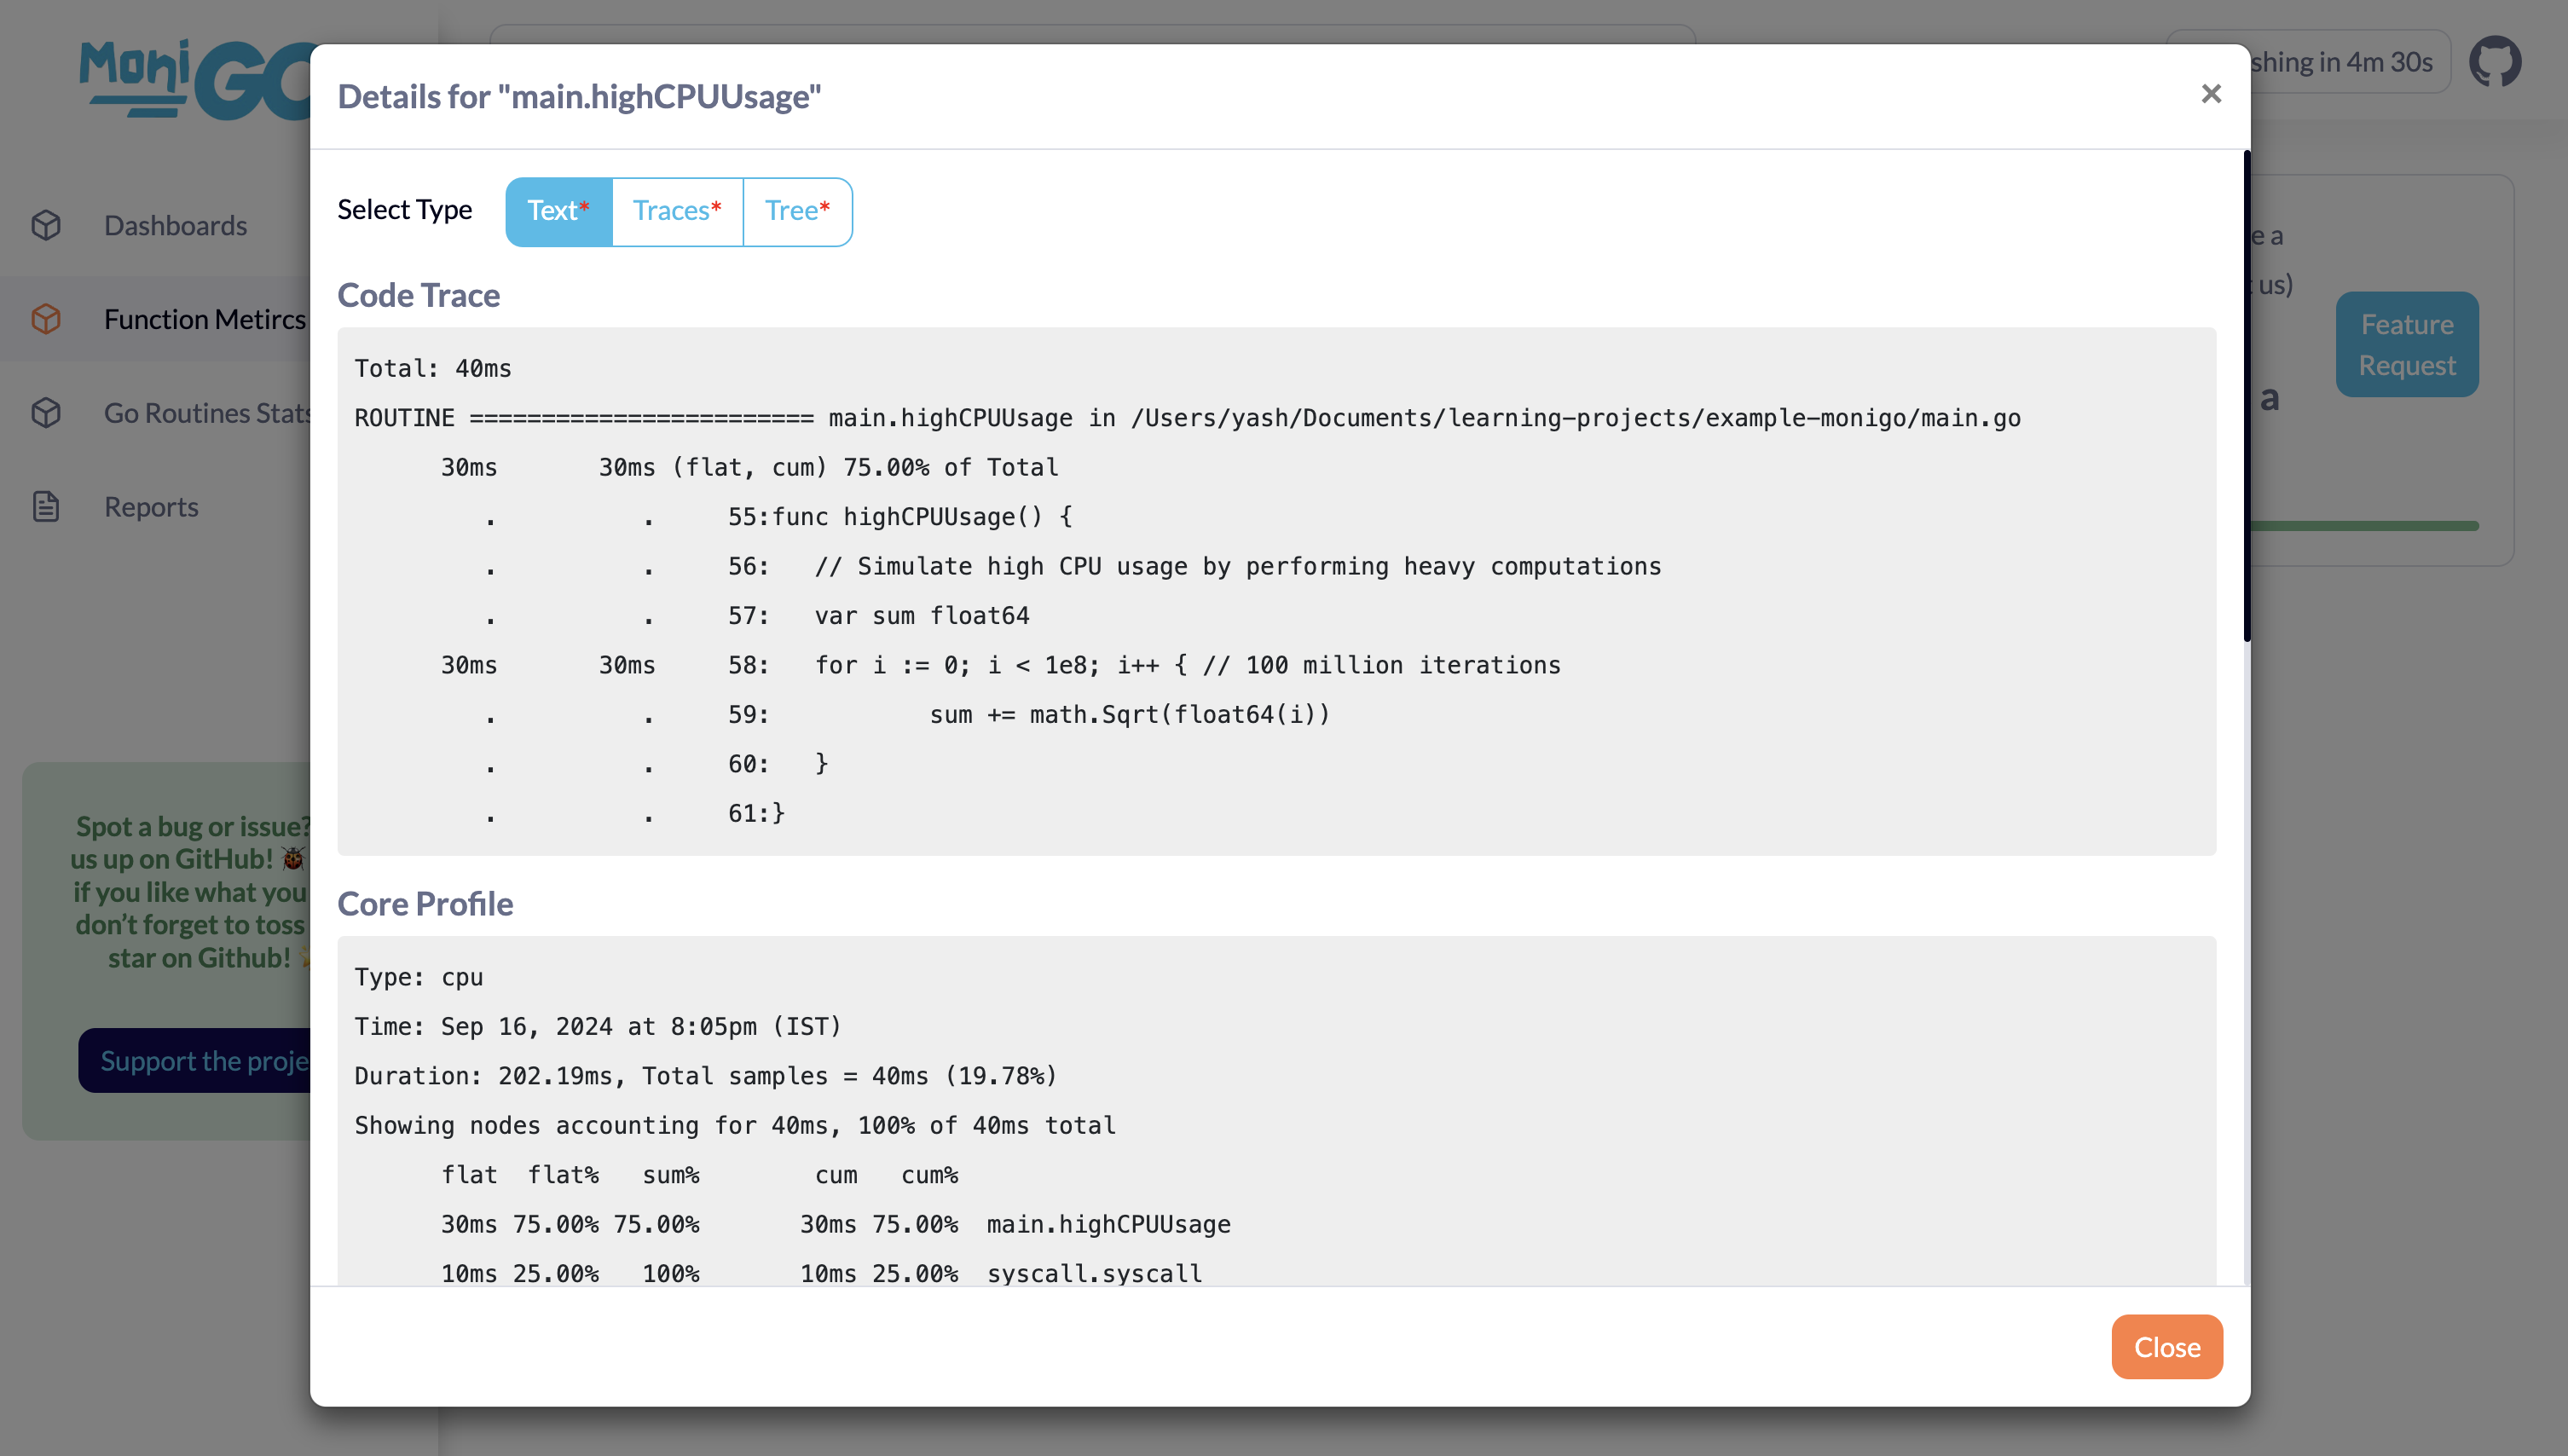
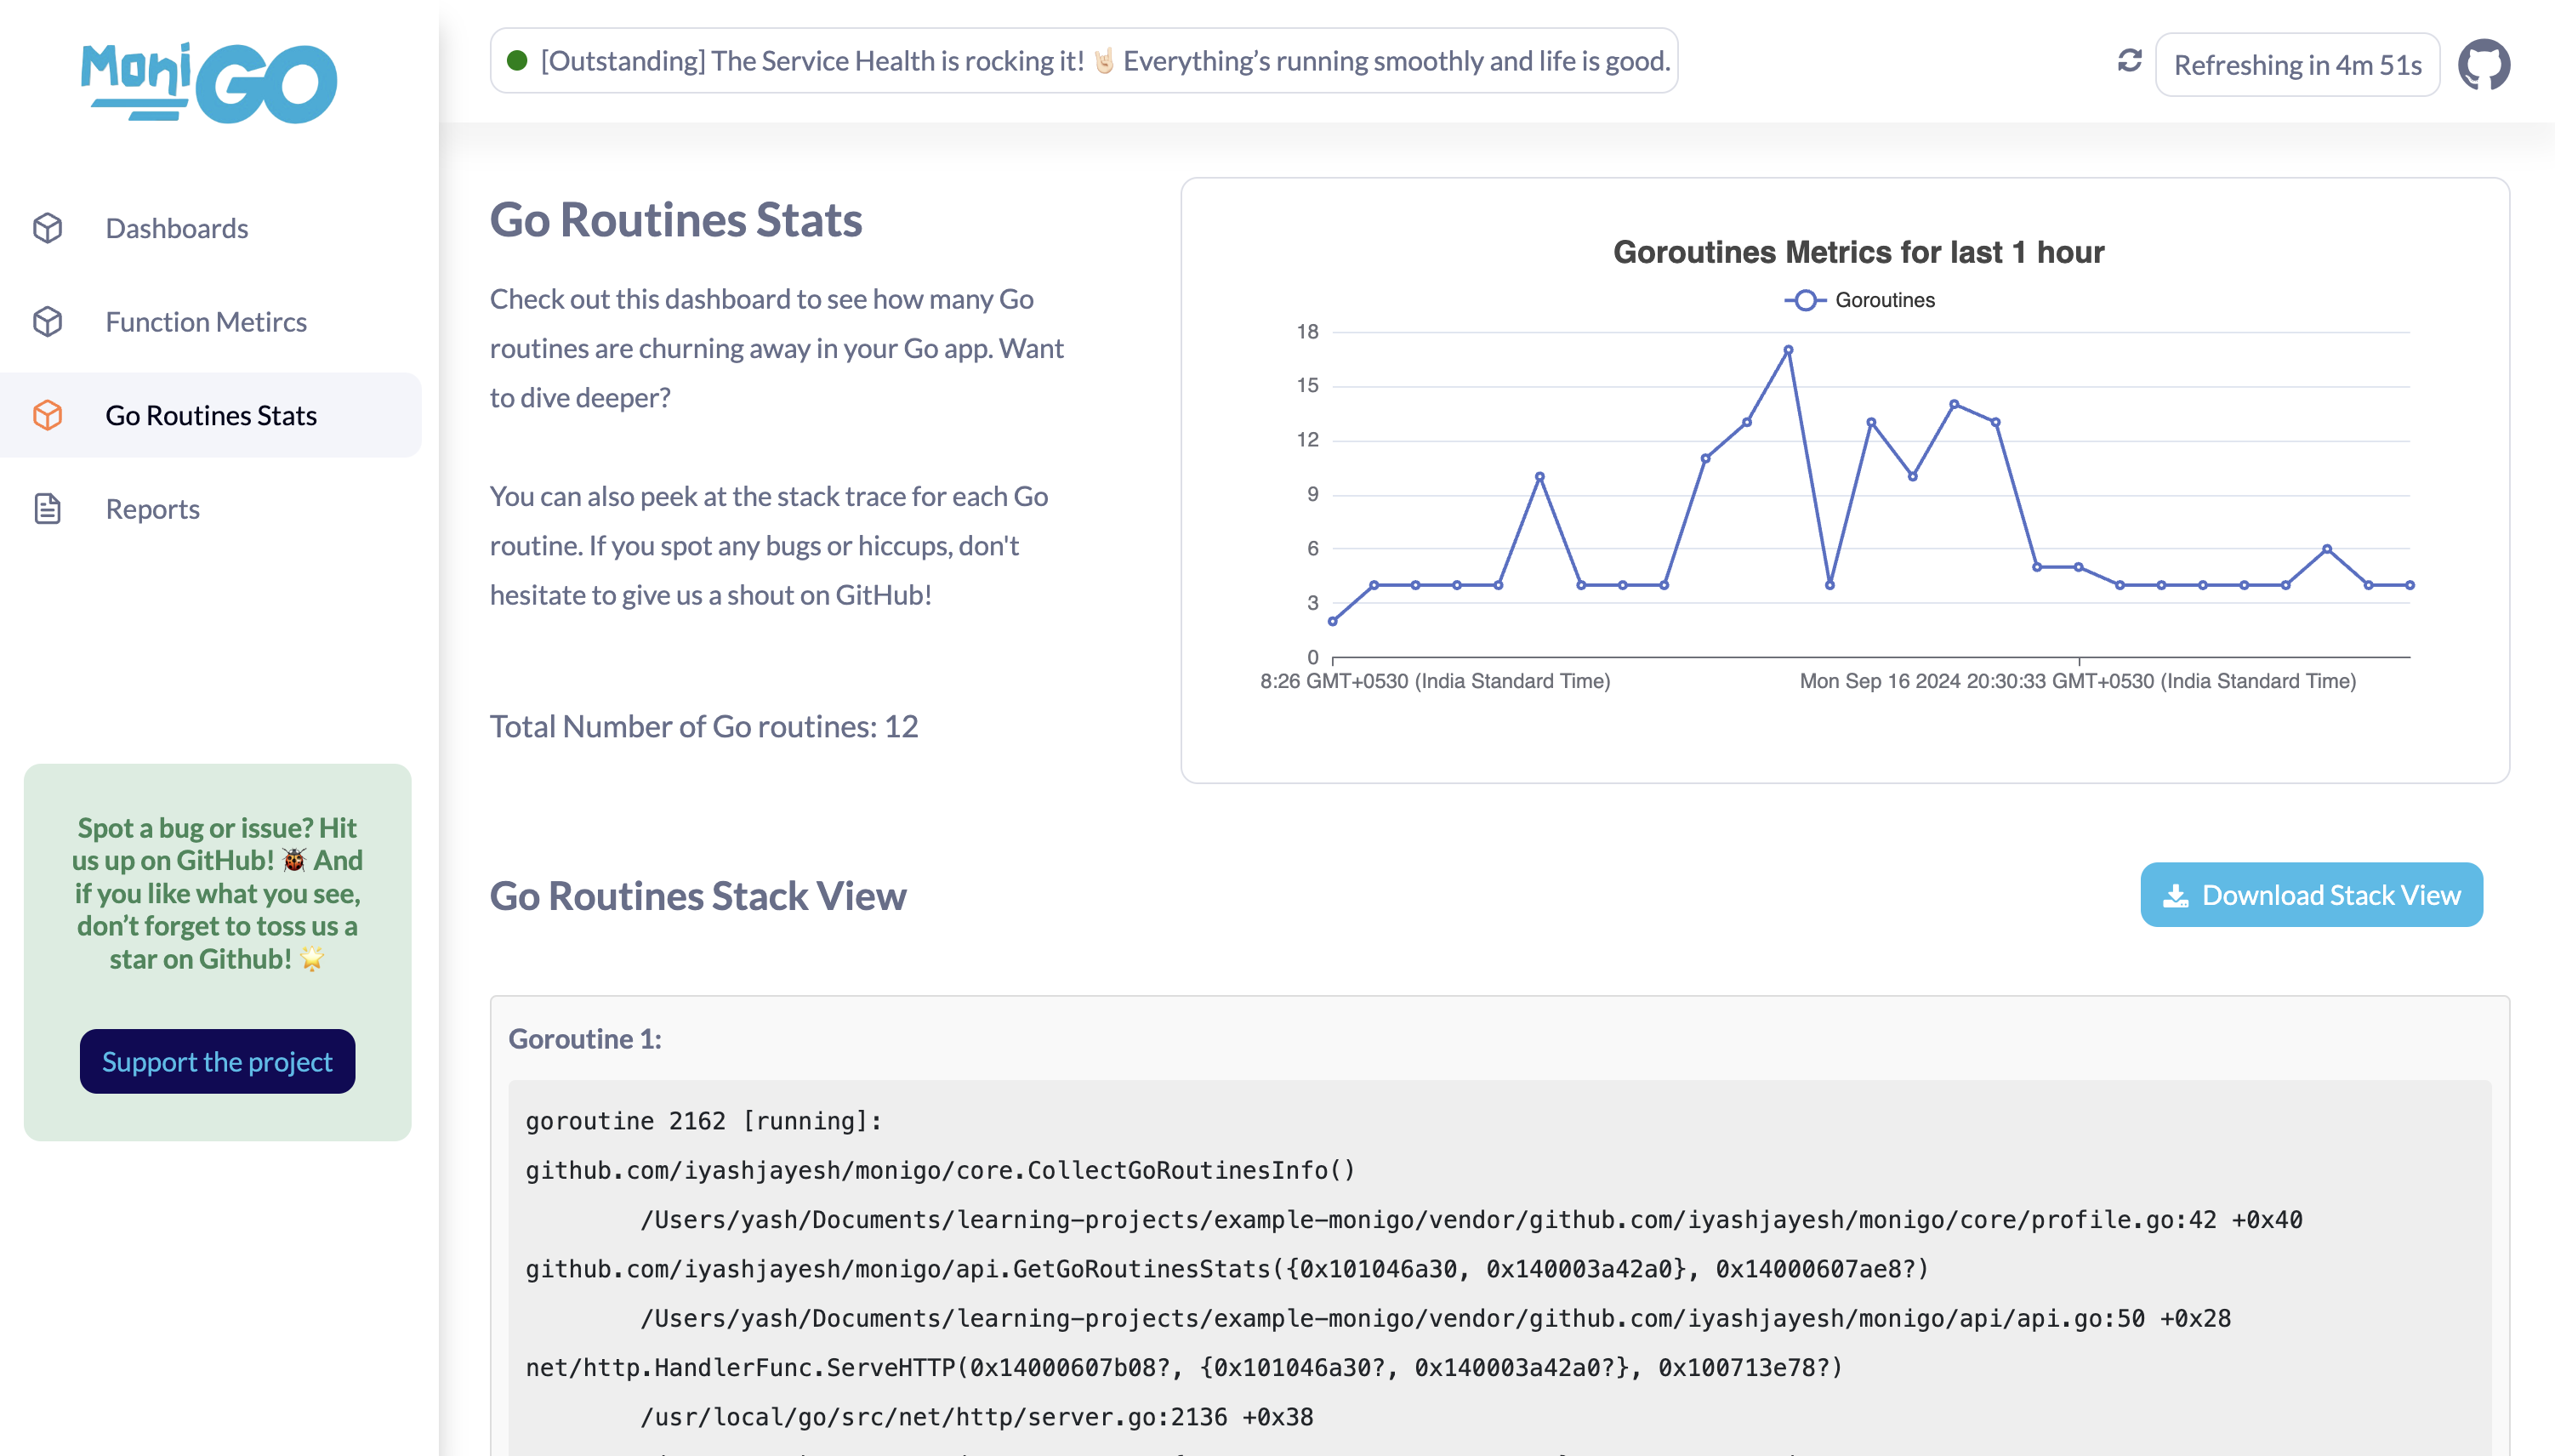
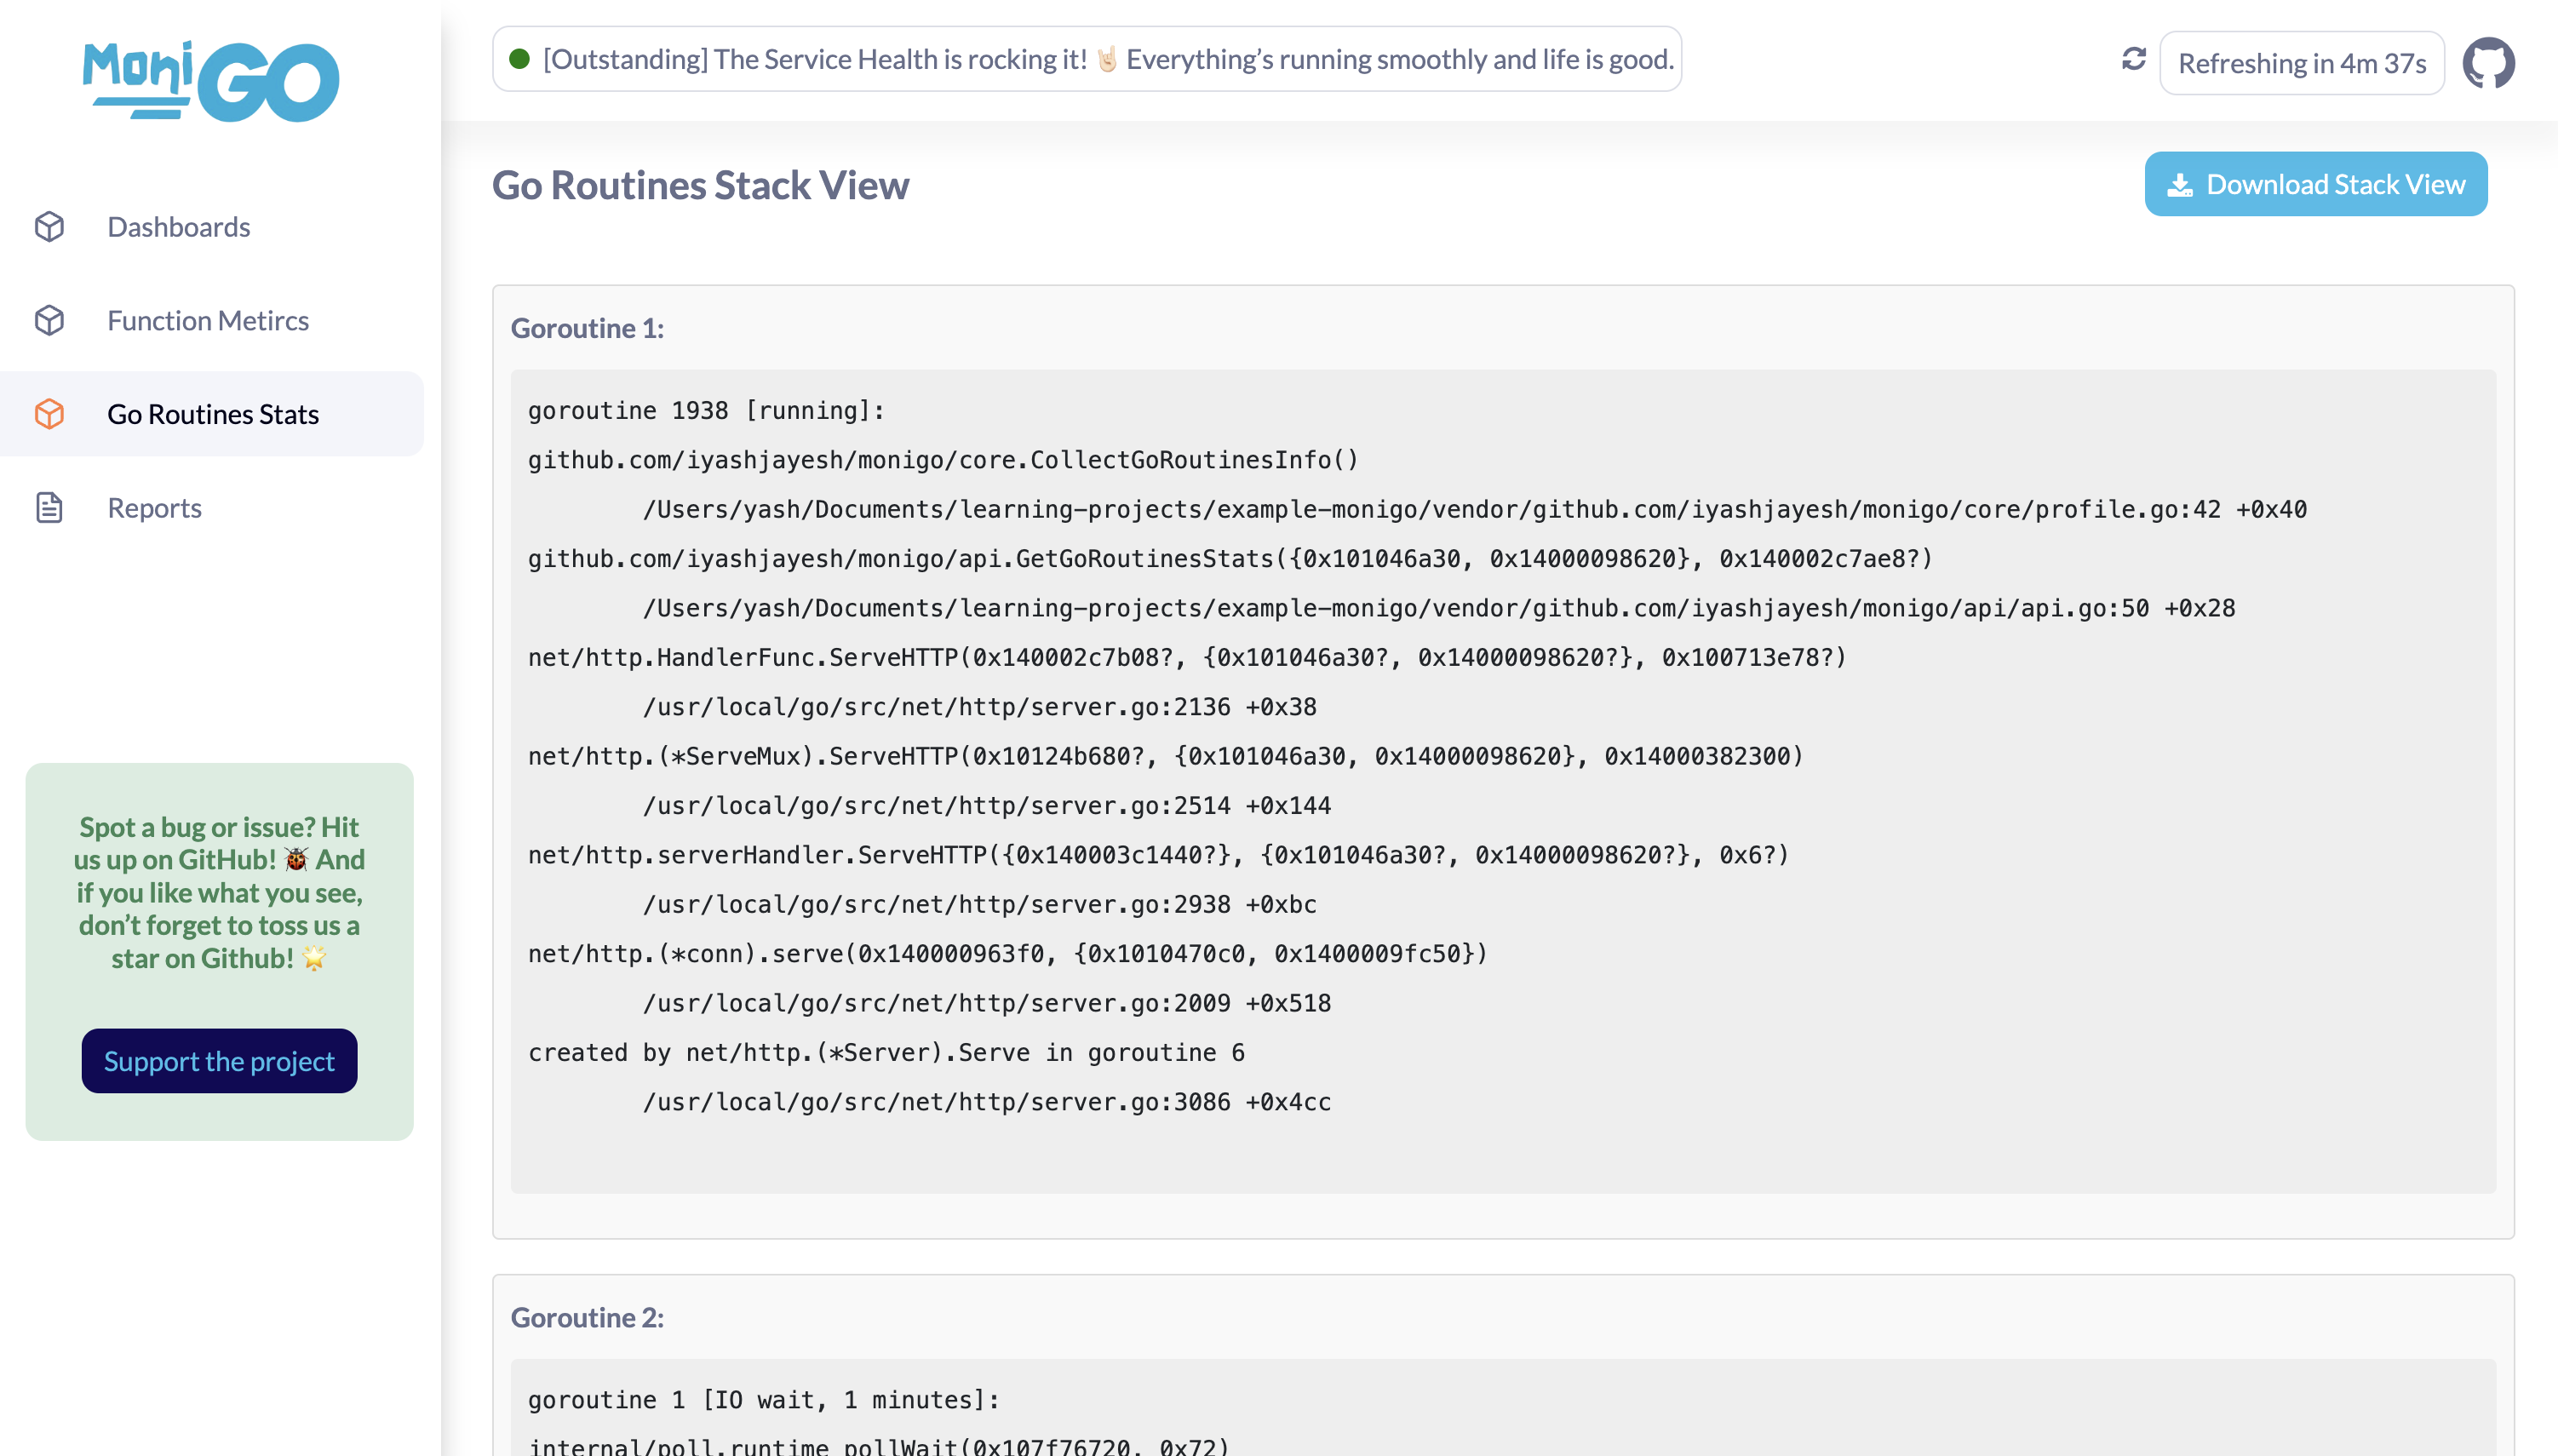
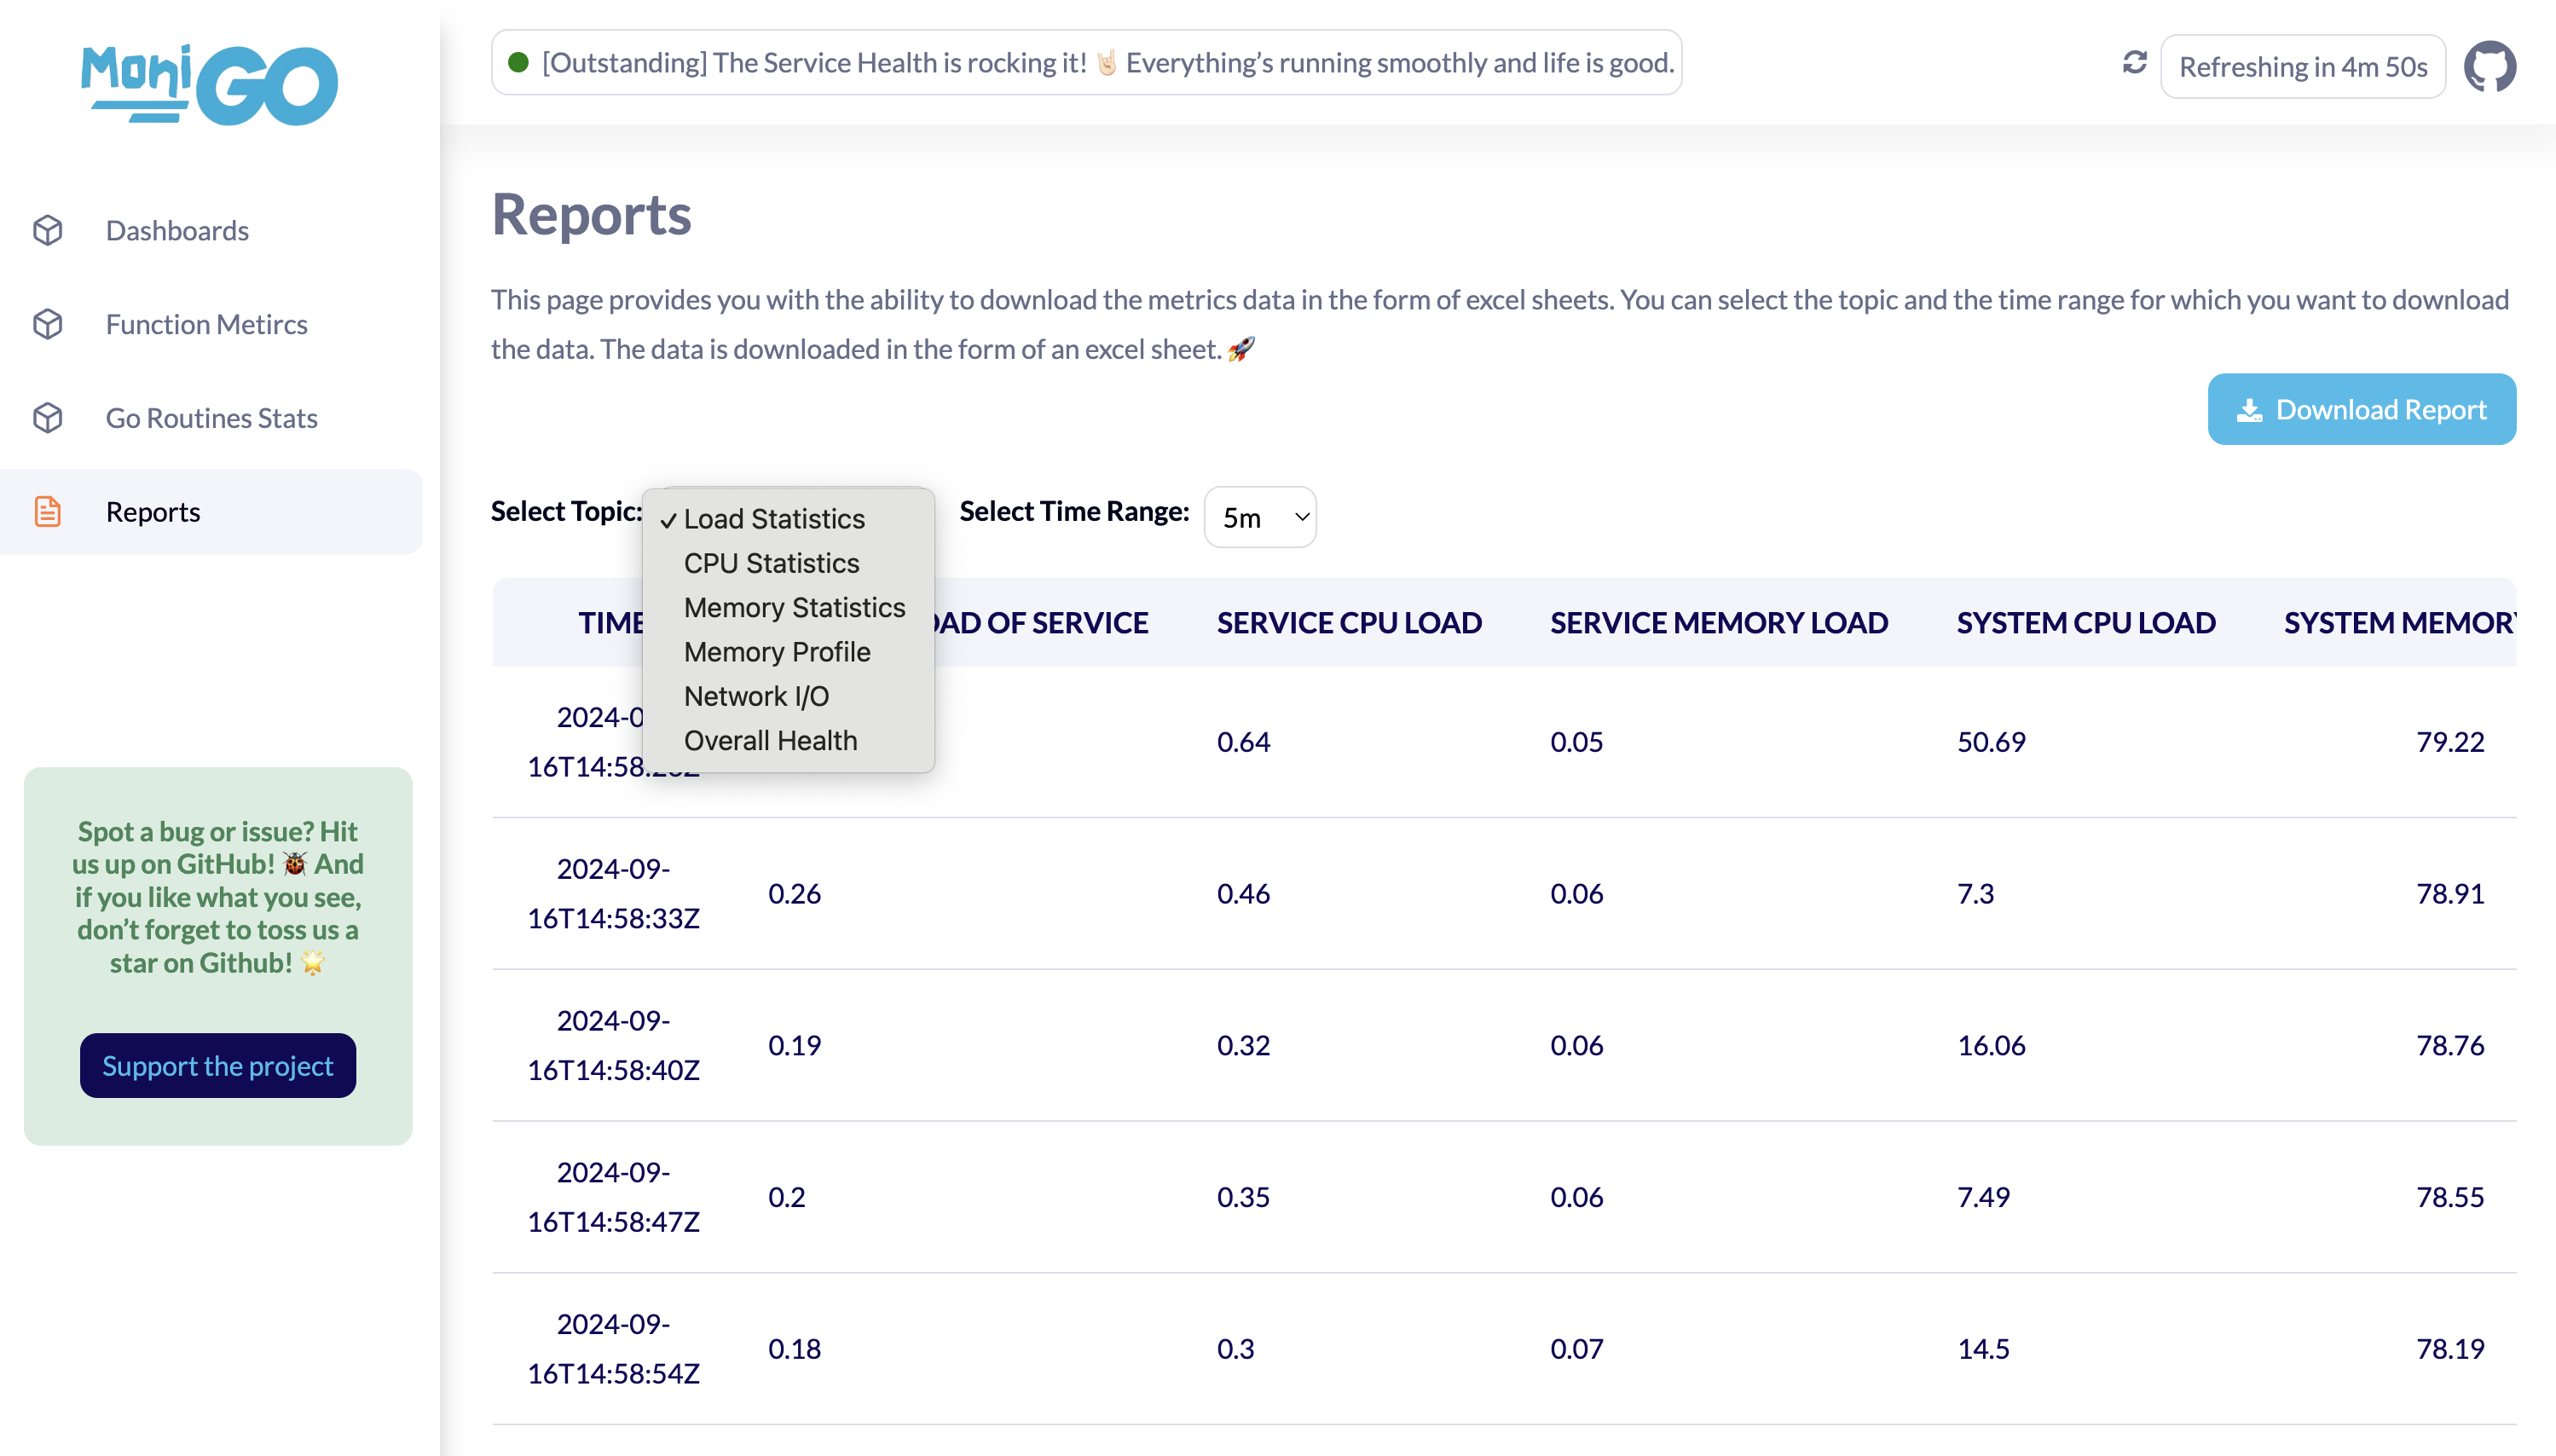
MoniGo is a performance monitoring library for Go applications. It provides real-time insights into application performance with an intuitive user interface, enabling developers to track and optimize both service-level and function-level metrics.
- Real-Time Monitoring: Access up-to-date performance metrics for your Go applications.
- Detailed Insights: Track and analyze both service and function-level performance.
- Customizable Dashboard: Manage performance data with an easy-to-use UI.
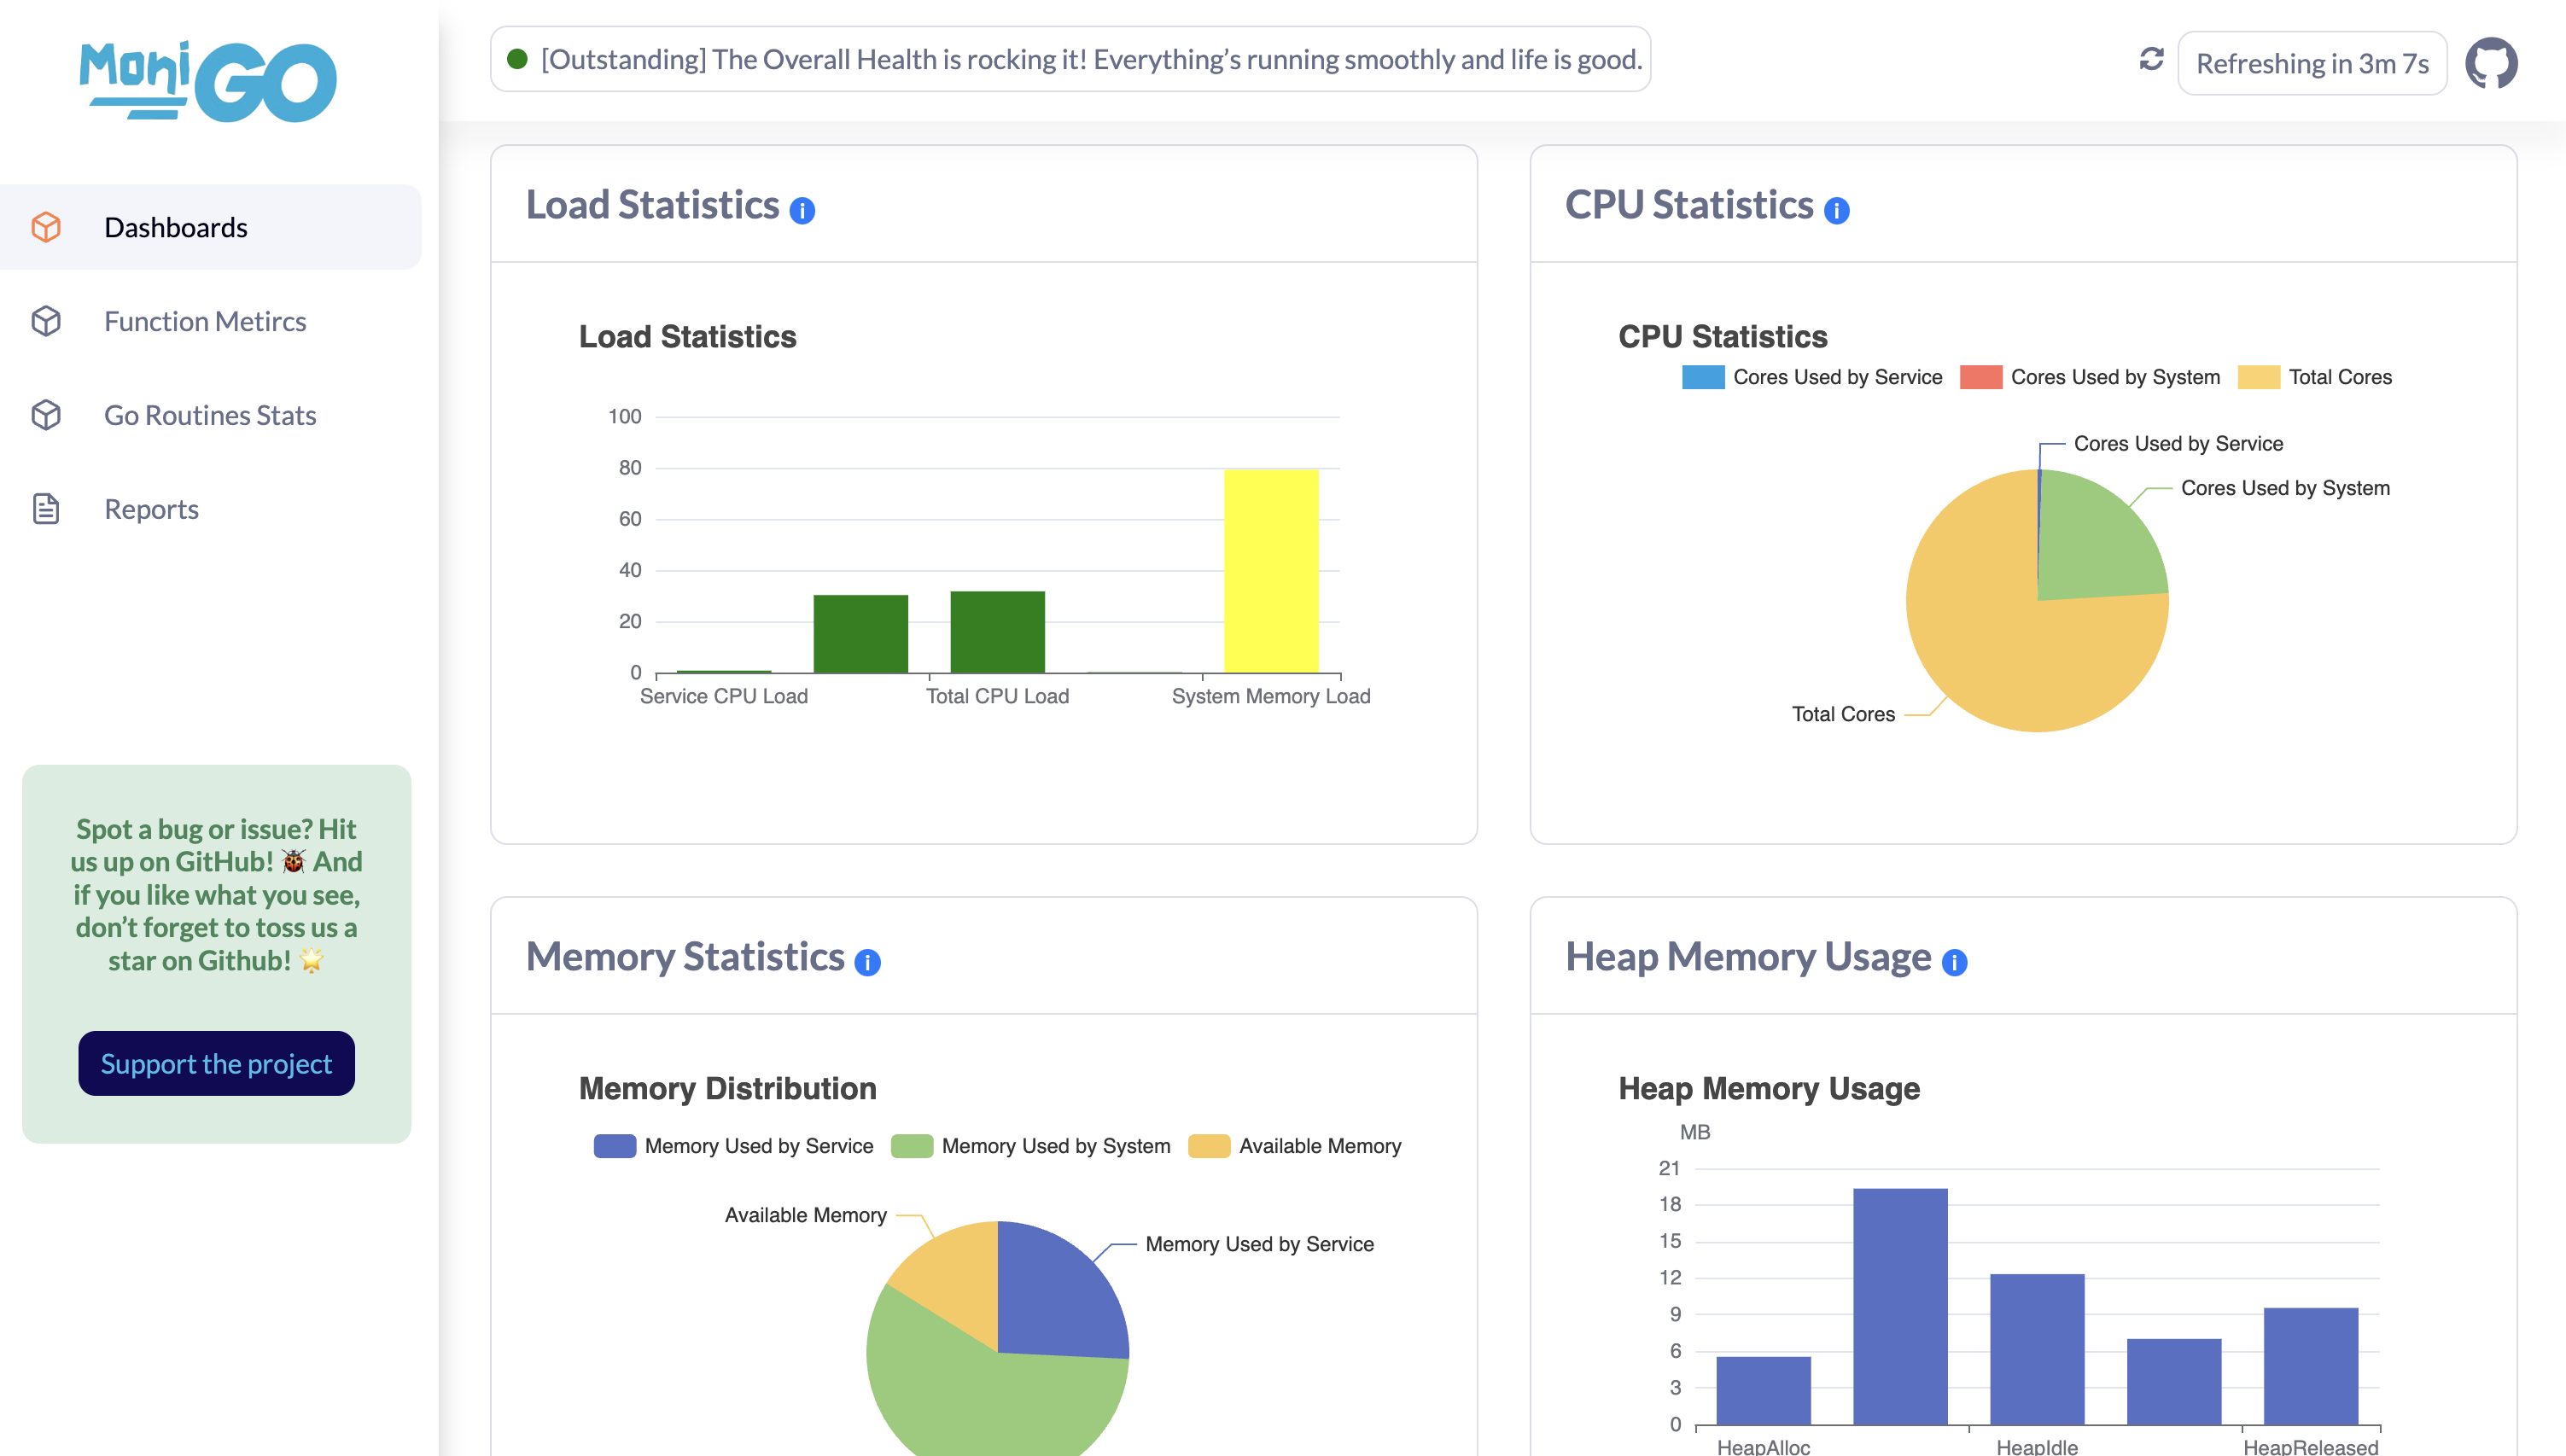
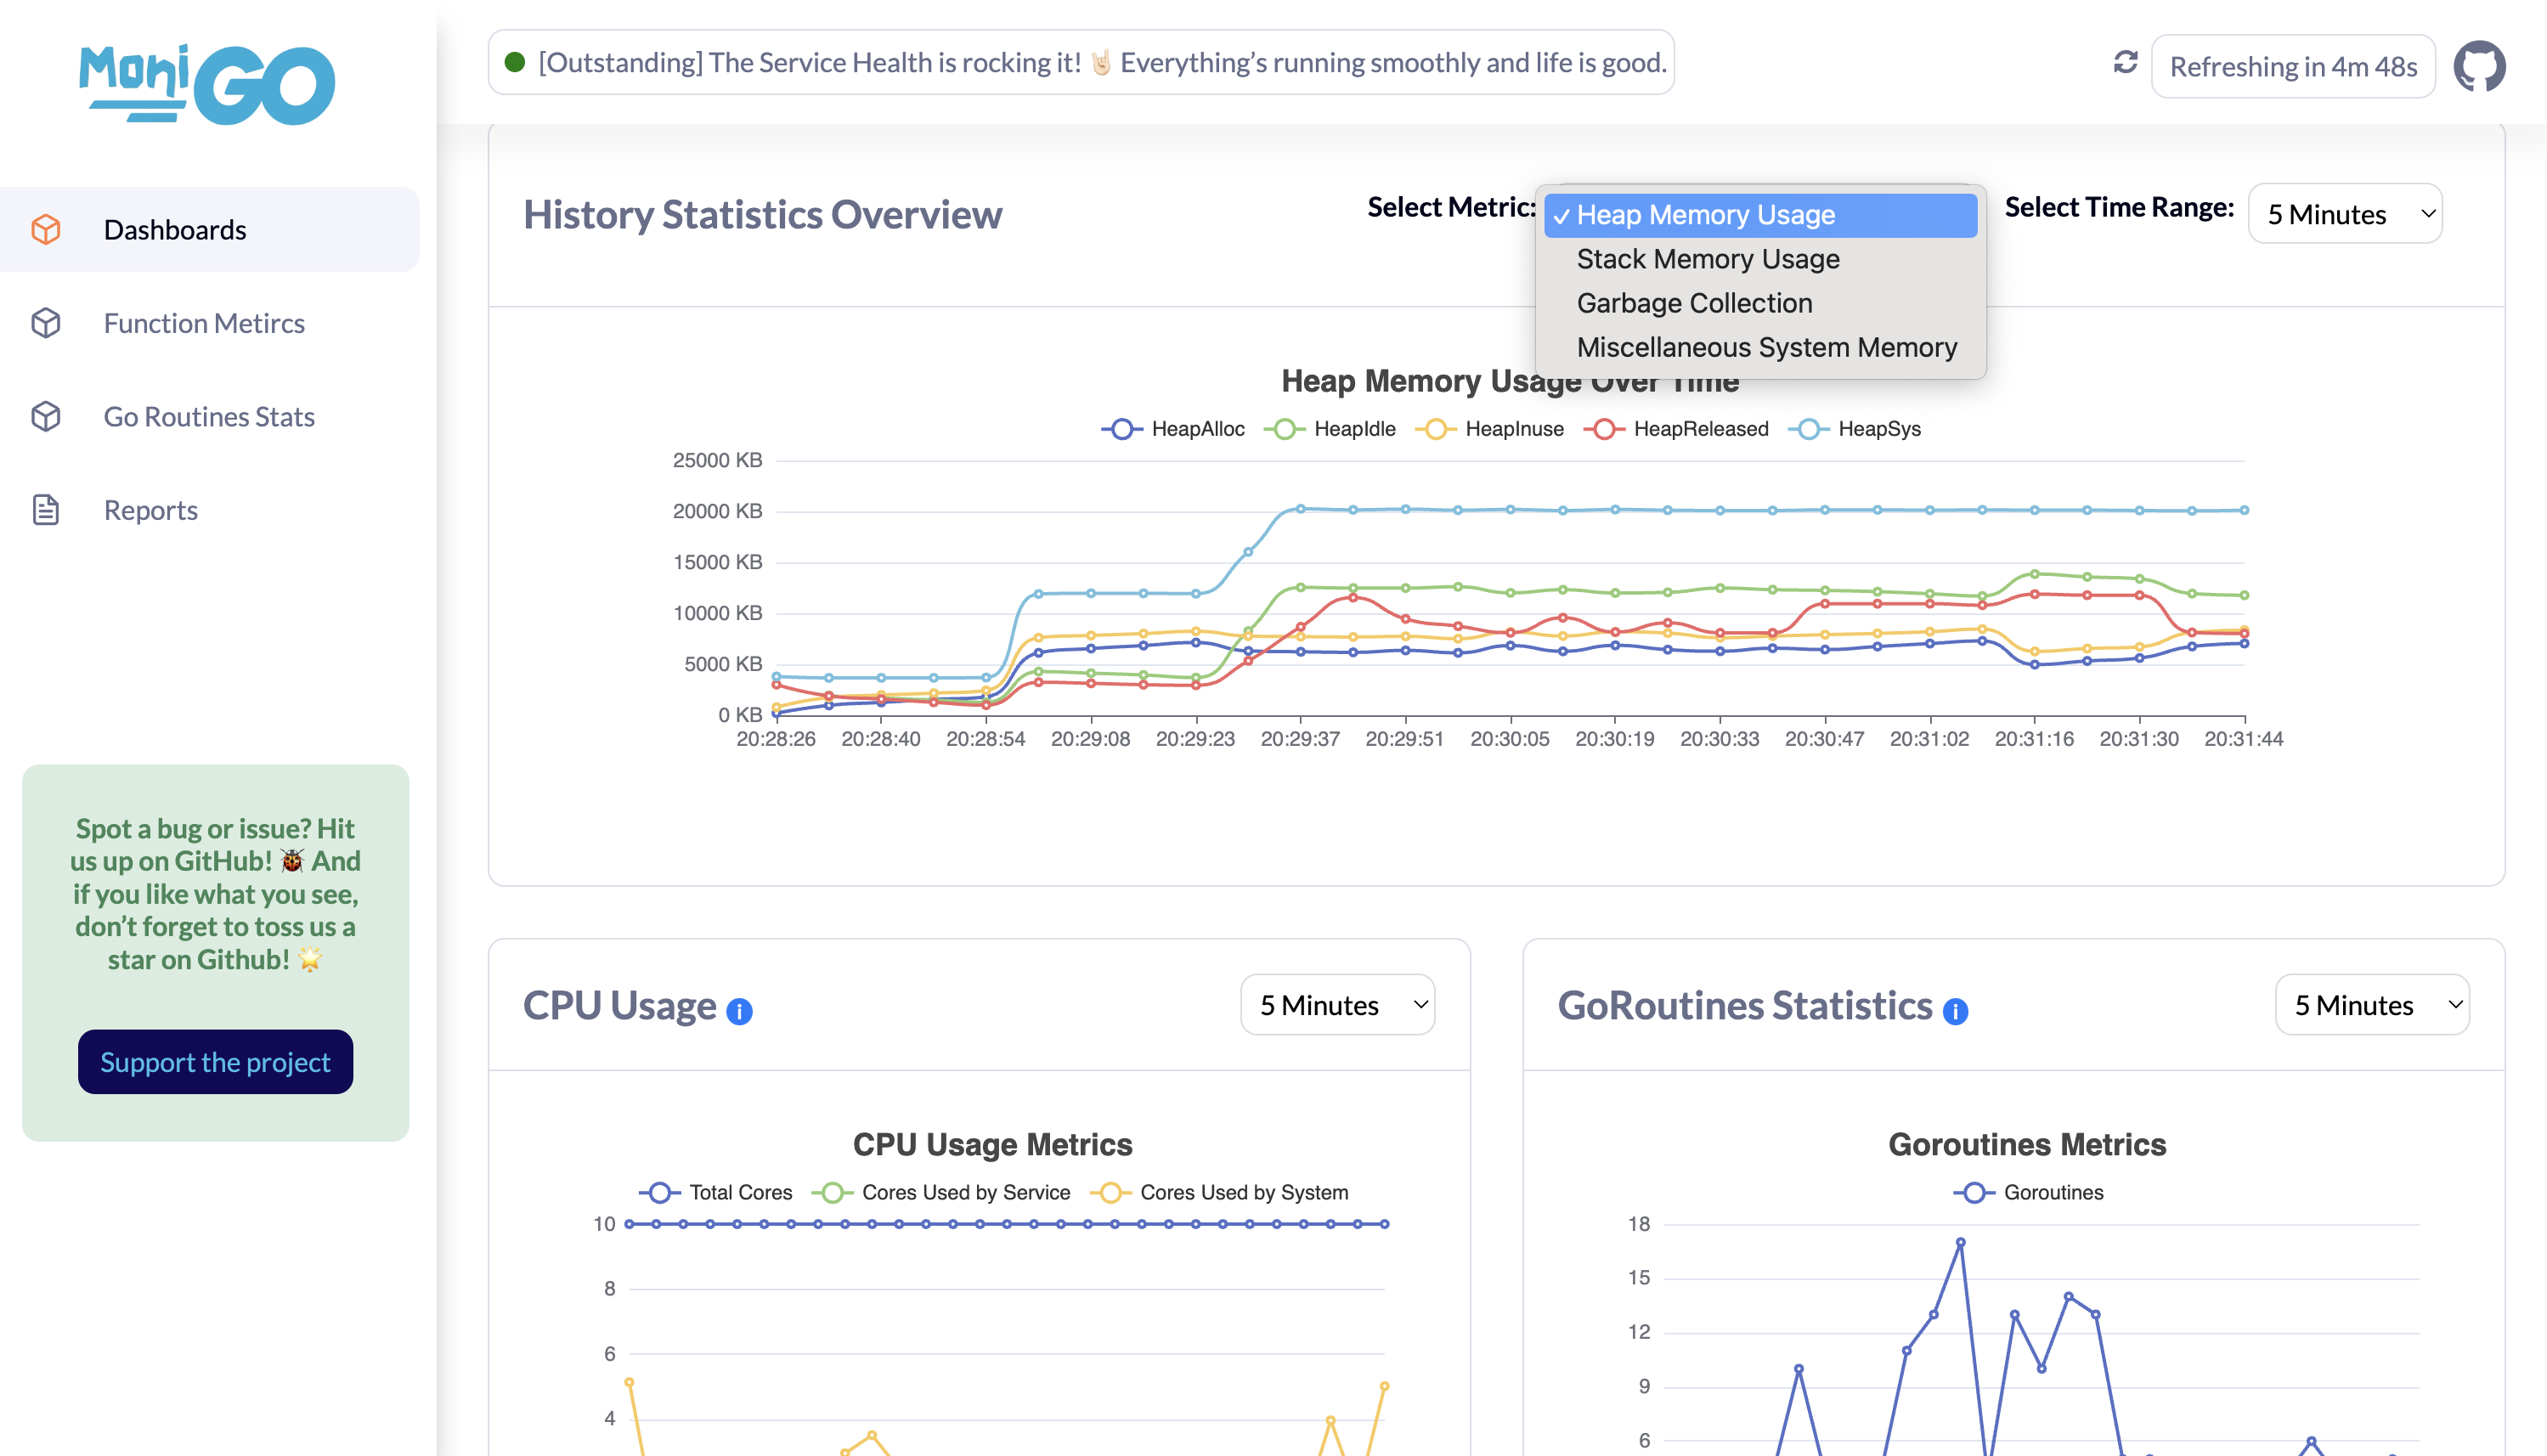
- Visualizations: Utilize graphs and charts to interpret performance trends.
- Custom Thresholds: Configure custom thresholds for your application's performance and resource usage.
To install MoniGo, use the following command:
go get github.com/iyashjayesh/monigo@latestpackage main
import (
"github.com/iyashjayesh/monigo"
)
func main() {
monigoInstance := &monigo.Monigo{
ServiceName: "data-api", // Mandatory field
DashboardPort: 8080, // Default is 8080
DataPointsSyncFrequency: "5s", // Default is 5 Minutes
DataRetentionPeriod: "4d", // Default is 7 days. Supported values: "1h", "1d", "1w", "1m"
TimeZone: "Local", // Default is Local timezone. Supported values: "Local", "UTC", "Asia/Kolkata", "America/New_York" etc. (https://en.wikipedia.org/wiki/List_of_tz_database_time_zones)
// MaxCPUUsage: 90, // Default is 95%
// MaxMemoryUsage: 90, // Default is 95%
// MaxGoRoutines: 100, // Default is 100
}
monigo.TraceFunction(highCPUUsage) // Trace function, when the function is called, it will be traced and the metrics will be displayed on the dashboard
go monigoInstance.Start() // Starting monigo dashboard
log.Println("Monigo dashboard started at port 8080")
// Optional
// routinesStats := monigoInstance.GetGoRoutinesStats() // Get go routines stats
// log.Println(routinesStats)
select {} // To keep the program running
}
// highCPUUsage is a function that simulates high CPU usage
func highCPUUsage() {
// Simulate high CPU usage by performing heavy computations
var sum float64
for i := 0; i < 1e8; i++ { // 100 million iterations
sum += math.Sqrt(float64(i))
}
}For more detailed usage instructions, refer to the documentation.
By default, the dashboard will be available at http://localhost:8080/ else at the port you have provided.
The monigo.TraceFunction(func()) method accept func(){} as a type.
func apiHandler(w http.ResponseWriter, r *http.Request) {
    // Trace function: when the highMemoryUsage function is called, it will be traced.
    monigo.TraceFunction(highMemoryUsage)
    w.Write([]byte("API1 response: memexpensiveFunc"))
}

func highMemoryUsage() {
    // Simulate high memory usage by allocating a large slice
    largeSlice := make([]float64, 1e8) // 100 million elements
    for i := 0; i < len(largeSlice); i++ {
        largeSlice[i] = float64(i)
    }
}- Load Statistics: Provides an overview of the overall load of the service, CPU load, memory load, and system load.
| Field Name | Value (Datatype) |
|---|---|
overall_load_of_service |
float64 |
service_cpu_load |
float64 |
service_memory_load |
float64 |
system_cpu_load |
float64 |
system_memory_load |
float64 |
- CPU Statistics: Displays the total number of cores, cores used by the service, and cores used by the system.
| Field Name | Value (Datatype) |
|---|---|
total_cores |
int |
cores_used_by_service |
int |
cores_used_by_system |
int |
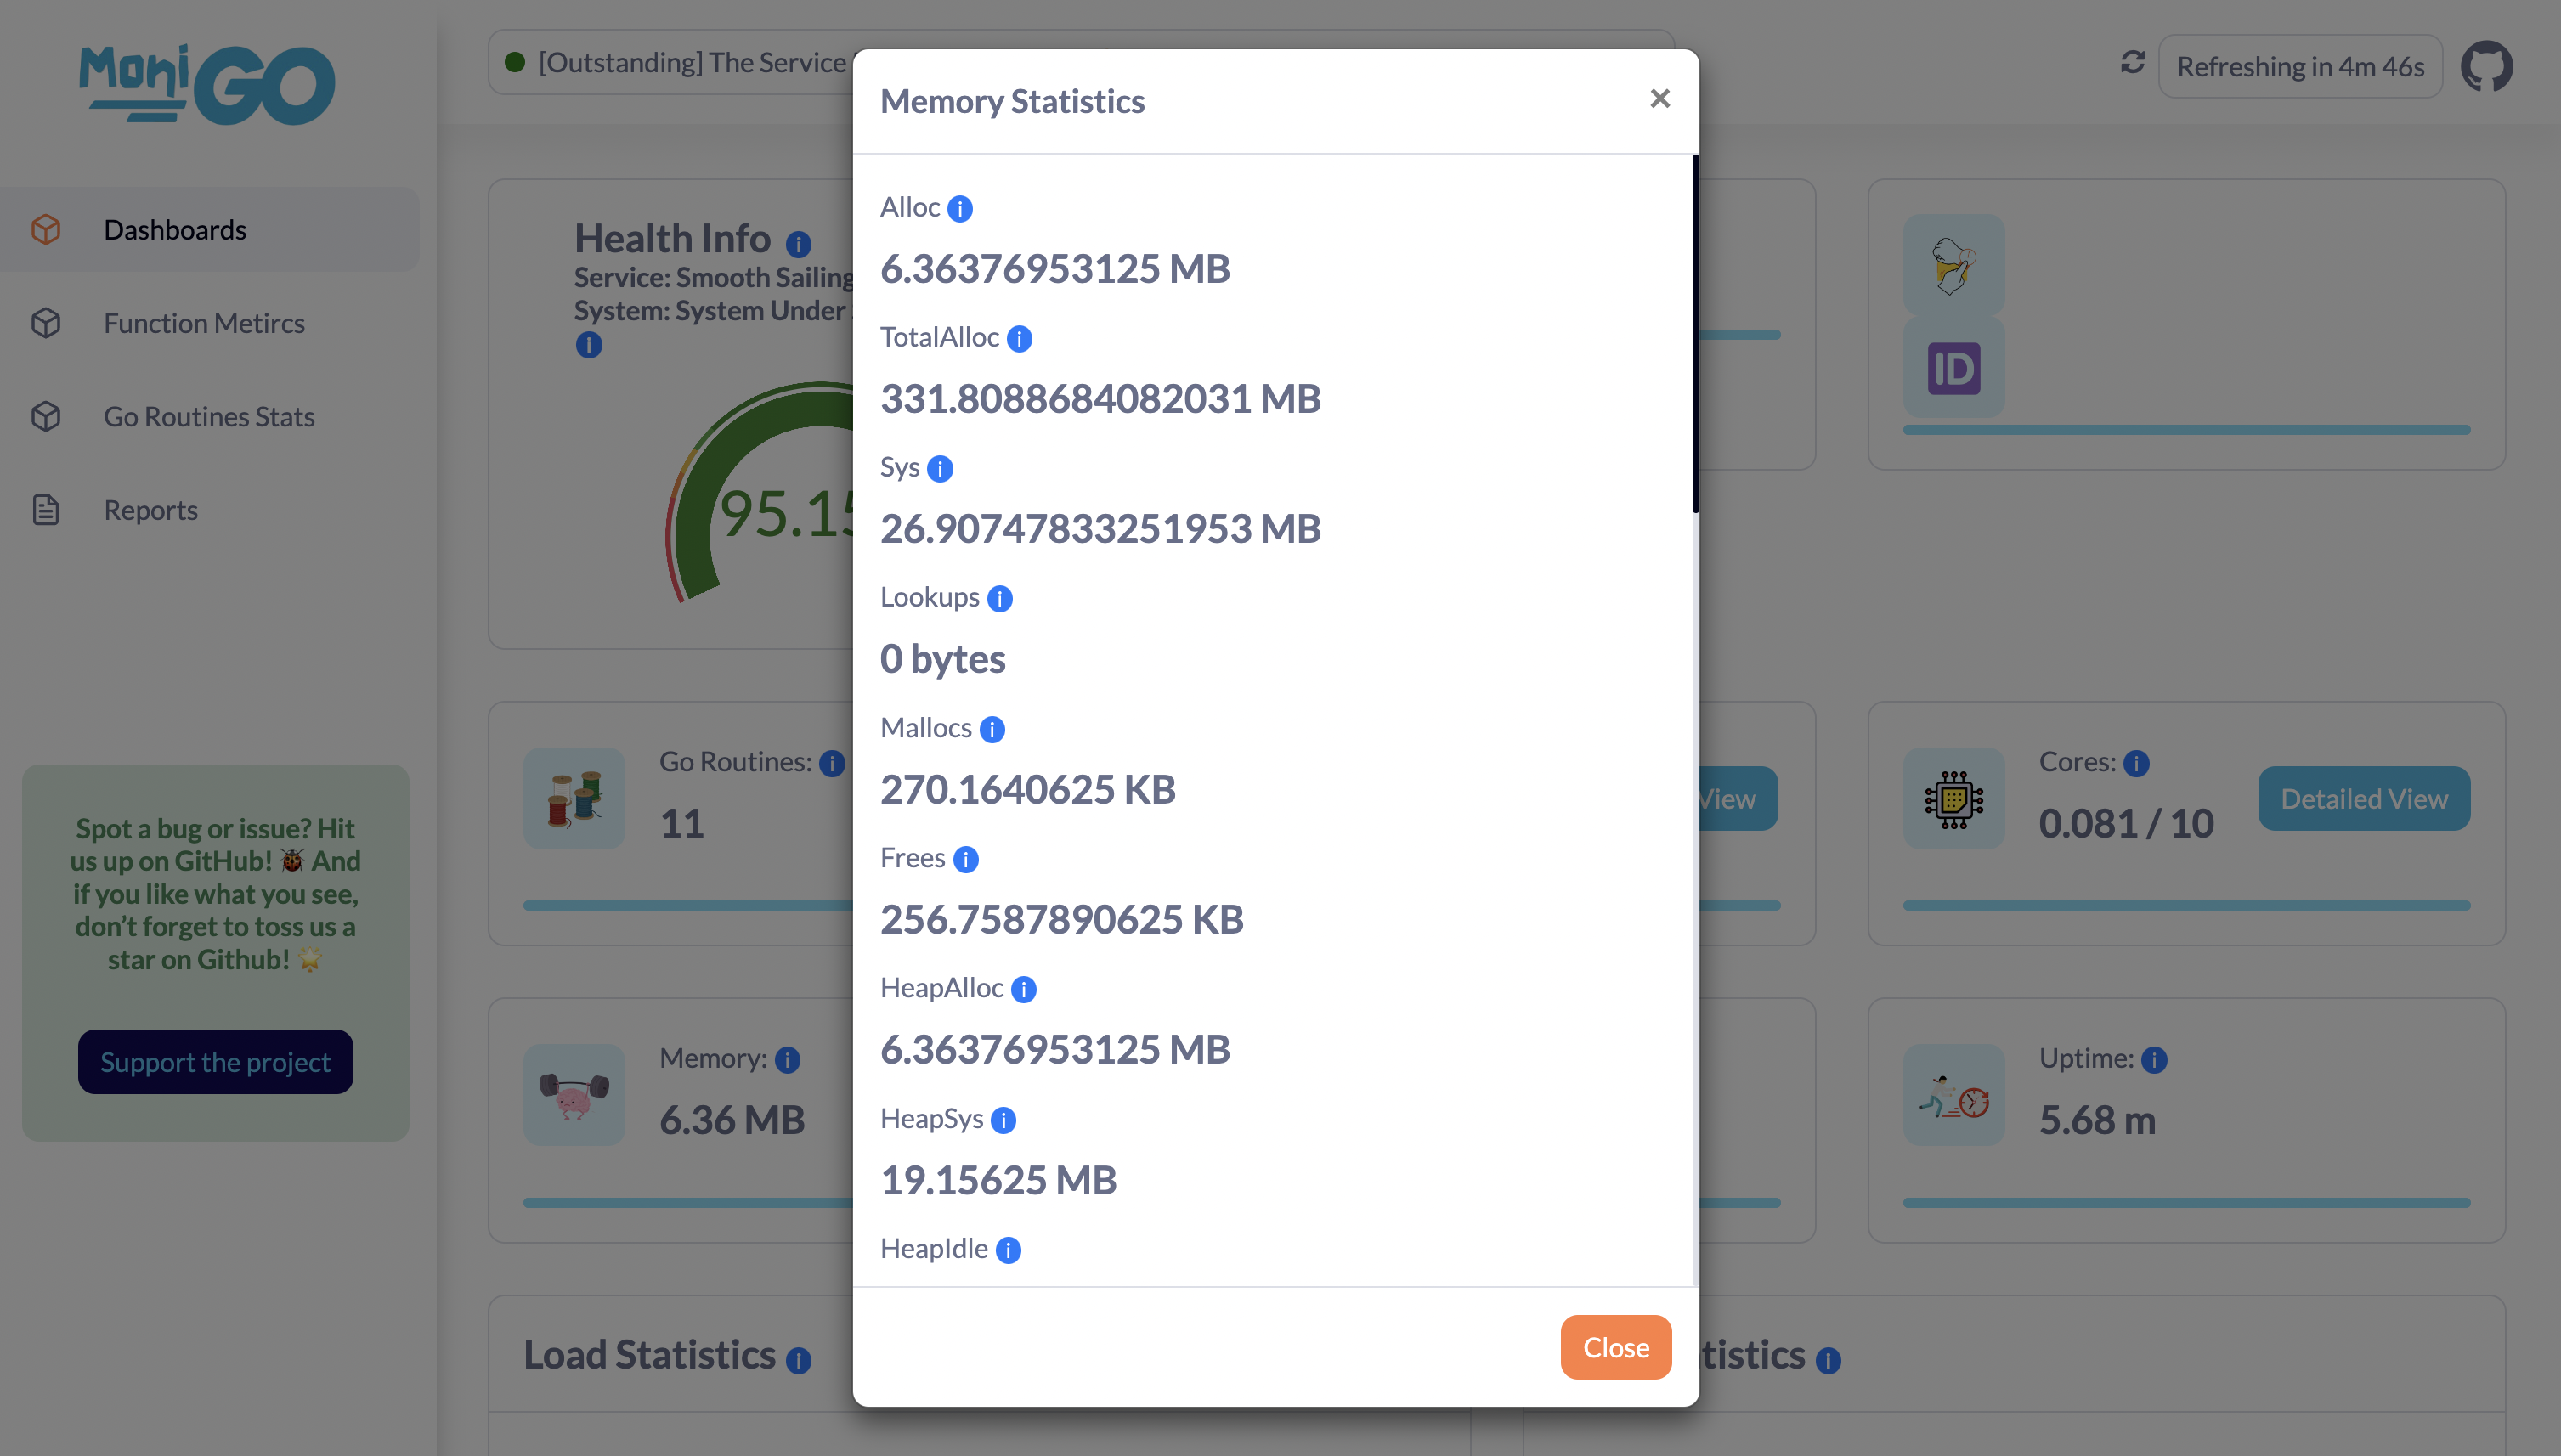
- Memory Statistics: Shows the total system memory, memory used by the system, memory used by the service, available memory, GC pause duration, and stack memory usage.
| Field Name | Value (Datatype) |
|---|---|
total_system_memory |
float64 |
memory_used_by_system |
float64 |
memory_used_by_service |
float64 |
available_memory |
float64 |
gc_pause_duration |
float64 |
stack_memory_usage |
float64 |
- Memory Profile: Provides information on heap allocation by the service, heap allocation by the system, total allocation by the service, and total memory by the OS.
| Field Name | Value (Datatype) |
|---|---|
heap_alloc_by_service |
float64 |
heap_alloc_by_system |
float64 |
total_alloc_by_service |
float64 |
total_memory_by_os |
float64 |
- Network IO: Displays the number of bytes sent and received.
| Field Name | Value (Datatype) |
|---|---|
bytes_sent |
float64 |
bytes_received |
float64 |
- Health Metrics: Provides an overall health percentage for the service.
| Field Name | Value (Datatype) |
|---|---|
service_health_percent |
float64 |
system_health_percent |
float64 |
- You can access the MoniGo API by visiting the following URL: http://localhost:8080/monigo/api/v1/ (replace
<endpoint>with the desired endpoint). - API endpoints are available for the following:
| Endpoint | Description | Method | Request | Response | Example |
|---|---|---|---|---|---|
/monigo/api/v1/metrics |
Get all metrics | GET | None | JSON | Example |
/monigo/api/v1/go-routines-stats |
Get go routines stats | GET | None | JSON | Example |
/monigo/api/v1/service-info |
Get service info | GET | None | JSON | Example |
/monigo/api/v1/service-metrics |
Get service metrics | POST | JSON Example | JSON | Example |
/monigo/api/v1/reports |
Get history data | POST | JSON Example | JSON | Example |
We welcome contributions! If you encounter any issues or have suggestions, please submit a pull request or open an issue.
If you find MoniGo useful, consider giving it a star! ⭐
For questions or feedback, please open an issue or contact me at iyashjayesh@gmail.com or at LinkedIn
This project is licensed under the Apache 2.0 License - see the LICENSE file for details.


