A Kohonen SOM based clustering application.
Report Bug
·
Request Feature
This project made as a class assignment. Its purpose is basically parsing the given csv data , preprocessed it and then training the som for clustering it.
Features:
- You can cluster the given csv data.
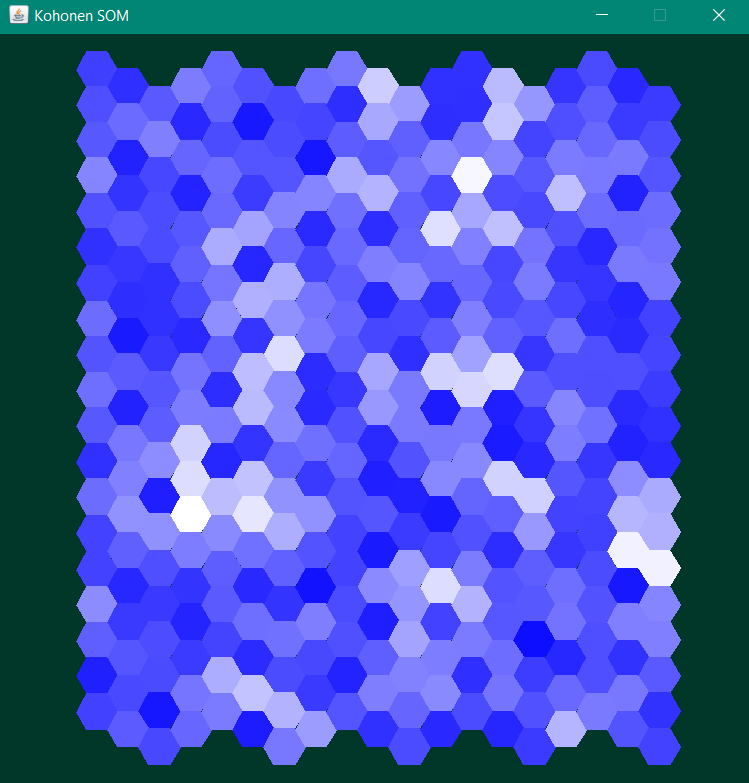
- You can visualize the result by U-Matrix or Hit-Map that represented on heat map.
- You can print each points best matching unit and weights of neurons in a csv file.
- There is 2 different topological neighbourhood function (Gauss and Mexican Hat)
A self-organizing map (SOM) or self-organizing feature map (SOFM) is a type of artificial neural network (ANN) that is trained using unsupervised learning to produce a low-dimensional (typically two-dimensional), discretized representation of the input space of the training samples, called a map, and is therefore a method to do dimensionality reduction. Self-organizing maps differ from other artificial neural networks as they apply competitive(or cooperative) learning as opposed to error-correction learning (such as backpropagation with gradient descent), and in the sense that they use a neighborhood function to preserve the topological properties of the input space.
This makes SOMs useful for visualization by creating low-dimensional views of high-dimensional data, akin to multidimensional scaling. The artificial neural network introduced by the Finnish professor Teuvo Kohonen in the 1980s is sometimes called a Kohonen map or network. The Kohonen net is a computationally convenient abstraction building on biological models of neural systems from the 1970s and morphogenesis models dating back to Alan Turing in the 1950s.
To get a local copy up and running follow these simple steps.
- Clone the repo
git clone https://github.com/izzettunc/Kohonen-SOM.git-
Open src folder in a Java Editor
-
Make changes, run it, use it whatever you like 😄
I used JHeatChart for visualization of hit values. It's basic and easy to use tool. Go check it out 😄
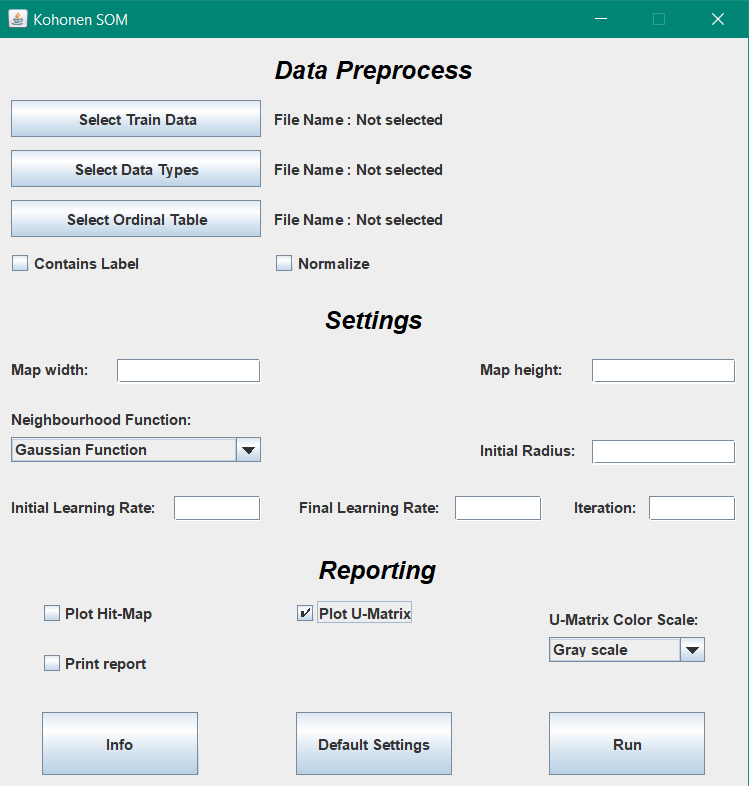
Well, there is no UI for now so you have to change the setting in code. But when I add the UI I will update here.
Now we have one.
And it is pretty self explanatory.
And these are examples of results
Data input is a classic csv file. Just don't forget to check contains label box if your data contains labels
label,label1,label2
val,val1,val2
val3,val4,val5
This is a special input for data class in order to remove users dependence to code now you need to give each columns data type in a csv file without any labels
Eg: Data file:
x,y,z,w,q
1,a,0,low,1.35
3,b,1,med,1.27
4,c,0,high,98
Eg: Data Types File:
INTEGER,CATEGORICAL,BOOL,ORDINAL,DOUBLE
As you can guess ordinal values like low, medium, high are categorical values. But unlike the categorical values they have orders like medium is bigger than low and lesser then high. So in this file you have to denote which column is ordinal and what these ordinal values means.
Structure
column index,value,order,value,order,value,order,...,...,...,...,value,order
Eg: Data file:
x,w,y,z
low,0.98,small,severe
medium,0.21,average,standard
high,0.1,big,mild
Eg: Data Types File:
ORDINAL,DOUBLE,ORDINAL,ORDINAL
Eg: Ordinal Values Table File:
0,low,1,medium,2,high,3
2,small,1,average,2.5,big,4
3,mild,1,standad,4,severe,16
See the open issues for a list of proposed features (and known issues).
Distributed under the MIT License. See LICENSE for more information.
İzzet Tunç - izzet.tunc1997@gmail.com


