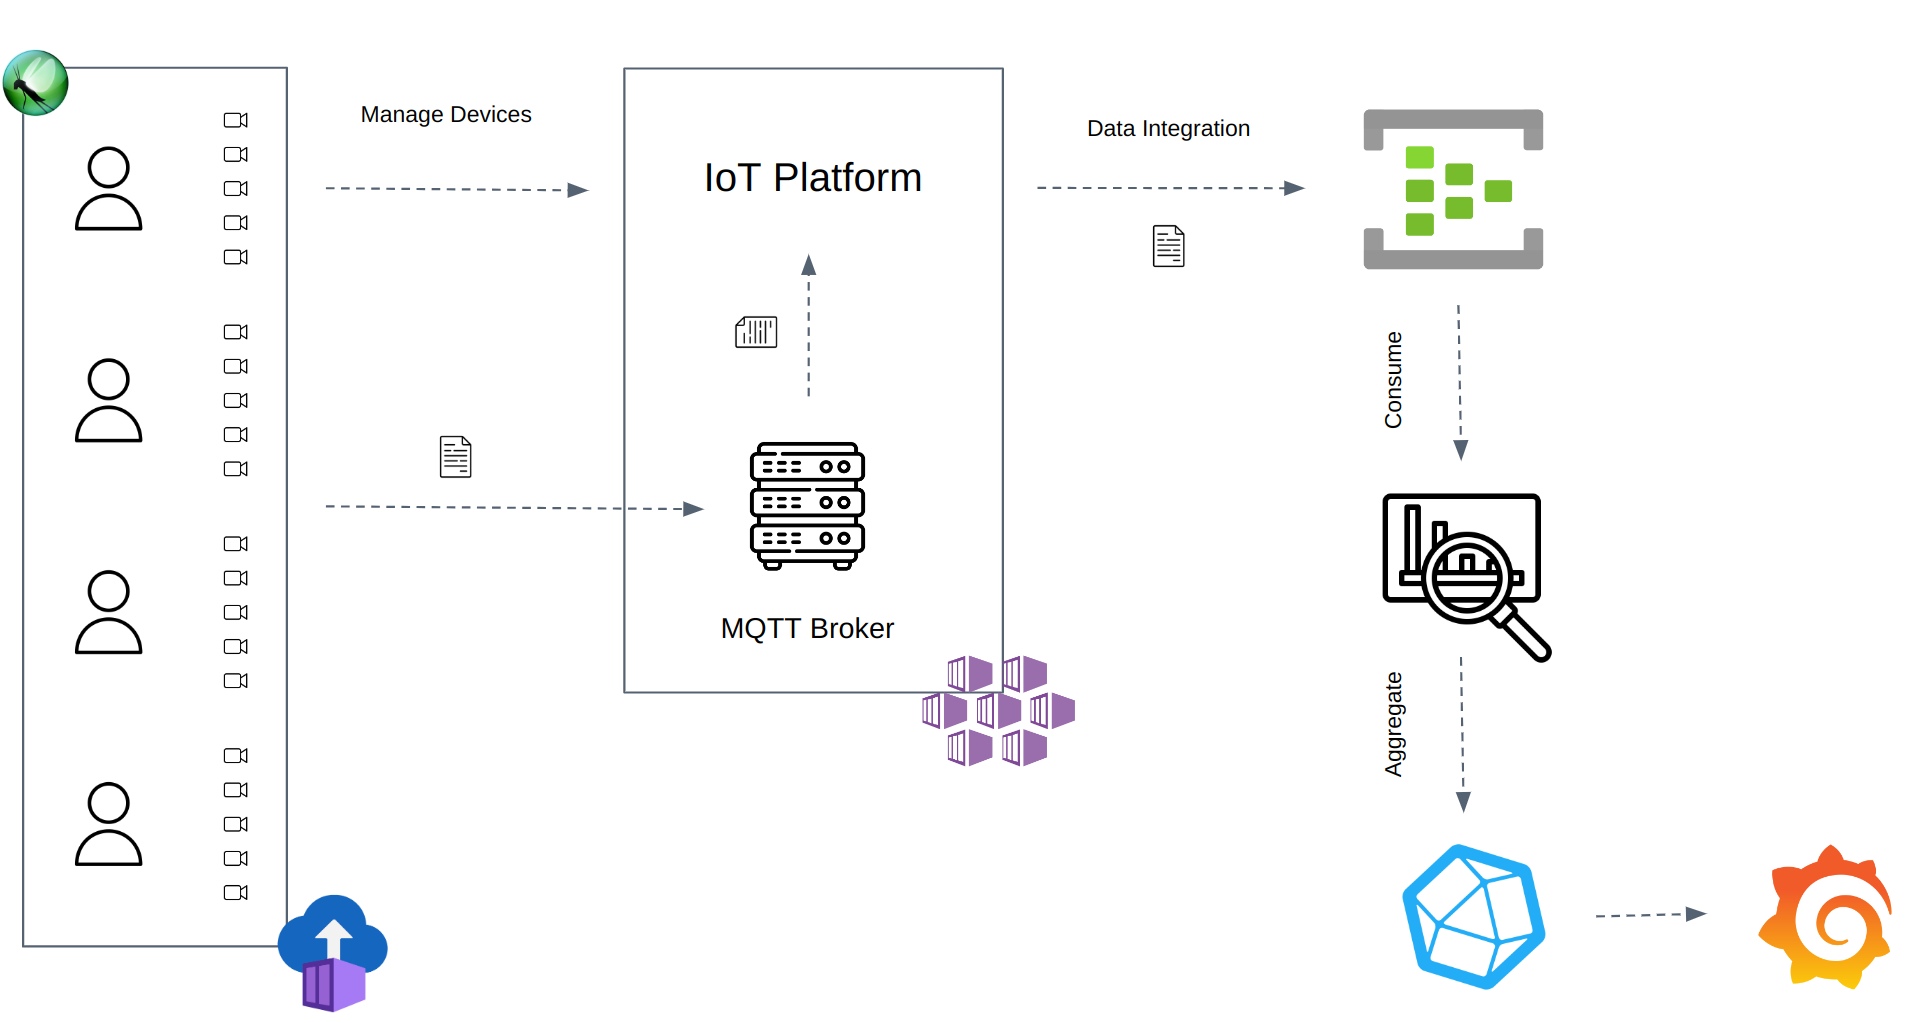
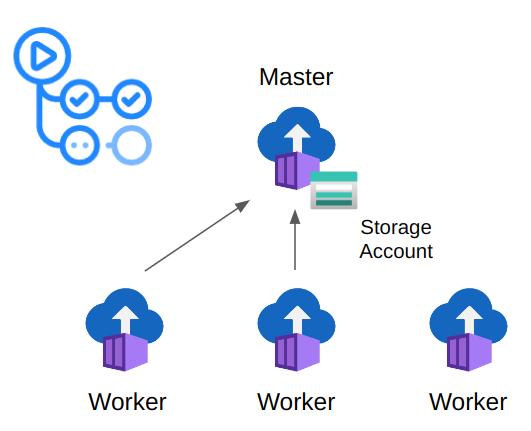
This repository is a framework example to test an IoT system performance using Locust. The framework uses Azure Container Instances to execute Locust in distributed mode.
Each device uses the Paho-MQTT client to publish telemetries to the MQTT Broker. The Consumer reads the outgoing messages from the Azure Eventhub and uploads the aggregated statistics to a time-series database InfluxDB.
Finally, Grafana reads the aggregated statistics to display the final dashboard with the test results.
This repository contains an example. You might need to adapt the code and workflows to your requirements and configuration. It might not work as it is.
The Producer wraps the Locust User class with the Paho-MQTT Client to publish telemetries via the MQTT protocol.
$ pip install -r producer/requirements.txtCheck the Paho-MQTT library to configure the MQTT User to match your broker configuration.
Use Locust Command Line to run the Producer:
$ locust -f producer/locustfile.py --headless -u 1 -r 1 -t 2m -H test.mqtt.comCreate an Azure Storage account with a file share named locust. Inside the file share, create two directories: stats and logs.
Dispatch the Run Locust On Azure workflow to deploy the Producer to Azure Container Instances.
Uncomment the cd.yaml workflow to release the producer docker.
The Consumer receives the Azure Eventhub outgoing messages, aggregates the events statistics, and dumps the data into the InfluxDB.
$ pip install -r consumer/requirements.txtSet up the following environment variables before starting the consumer:
$ export STORAGE_CONNECTION_STRING=""
$ export EVENTHUB_CONNECTION_STRING=""
$ export CONSUMER_GROUP=""
$ export EVENTHUB_NAME=""
$ export INFLUXDB_HOST=""
$ export INFLUXDB_TOKEN=""
$ export INFLUXDB_ORG=""
$ export NUM_PARTITION=1 # Consumer partition. ex: [0, 1] -> 1.
$ export TOTAL_PARTITION=2 # Total number of Consumers. ex: 2.Uncomment the cd.yaml workflow to release the Consumer docker.
Run the Deploy Consumer workflow to deploy the Consumer to Azure Container Instances.
Install the Locust Helm Chart using the CLI:
$ helm install locust charts/locust --set registry.user=username --set registry.pass=password --set node.worker.replicas=4 --set runId=docs --set locust.host=test.mqtt.com --set locust.numUsers=500 --set locust.runTime 1800 [...]Or using a values.yaml file:
$ helm install locust charts/locust -f values.yaml---
registry:
user: username
pass: password
node:
worker:
replicas: 2
runId: Docs
locust:
host: test.mqtt.com
numUsers: 500
spawnRate: 5
runTime: 1800
influx:
host: https://influxdb.com
token: INFLUXDB_TOKEN
organization: my_organization
consumer:
eventhub:
name: performance
consumerGroup: $Default
connectionString: EVENTHUB_CONN_STRING
storage:
connectionString: STORAGE_CONN_STRING
replicas: 2Uninstall the Helm Chart:
$ helm uninstall locustUse the Run Azure K8s workflow to schedule or automatize your tests:
---
name: Staging Run MQTT Performance Test

on:
  workflow_dispatch:

jobs:
  deploy-locust-to-aks:
    name: Deploy Locust to AKS
    uses: ./.github/workflows/run_azure_k8s.yaml
    with:
      run-id: Staging
      run-time: 3600
      spawn-rate: 10
      num-users: 10
      num-users-per-worker: 300
      mqtt-host: mqtt.staging.com
      eventhub-name: eventhub-staging
    secrets:
      client-id: SECRET_AZURE_CLIENT_ID
      client-secret: SECRET_AZURE_CLIENT_SECRET
      subscription-id: SECRET_AZURE_SUBSCRIPTION_ID
      tenant-id: SECRET_AZURE_TENANT_ID
      ghcr-username: SECRET_GHCR_USERNAME
      ghcr-password: SECRET_GHCR_PASSWORD
      storage-connection-string: SECRET_STORAGE_CONN_STRING
      eventhub-connection-string: SECRET_EVENTHUB_CONN_STRING
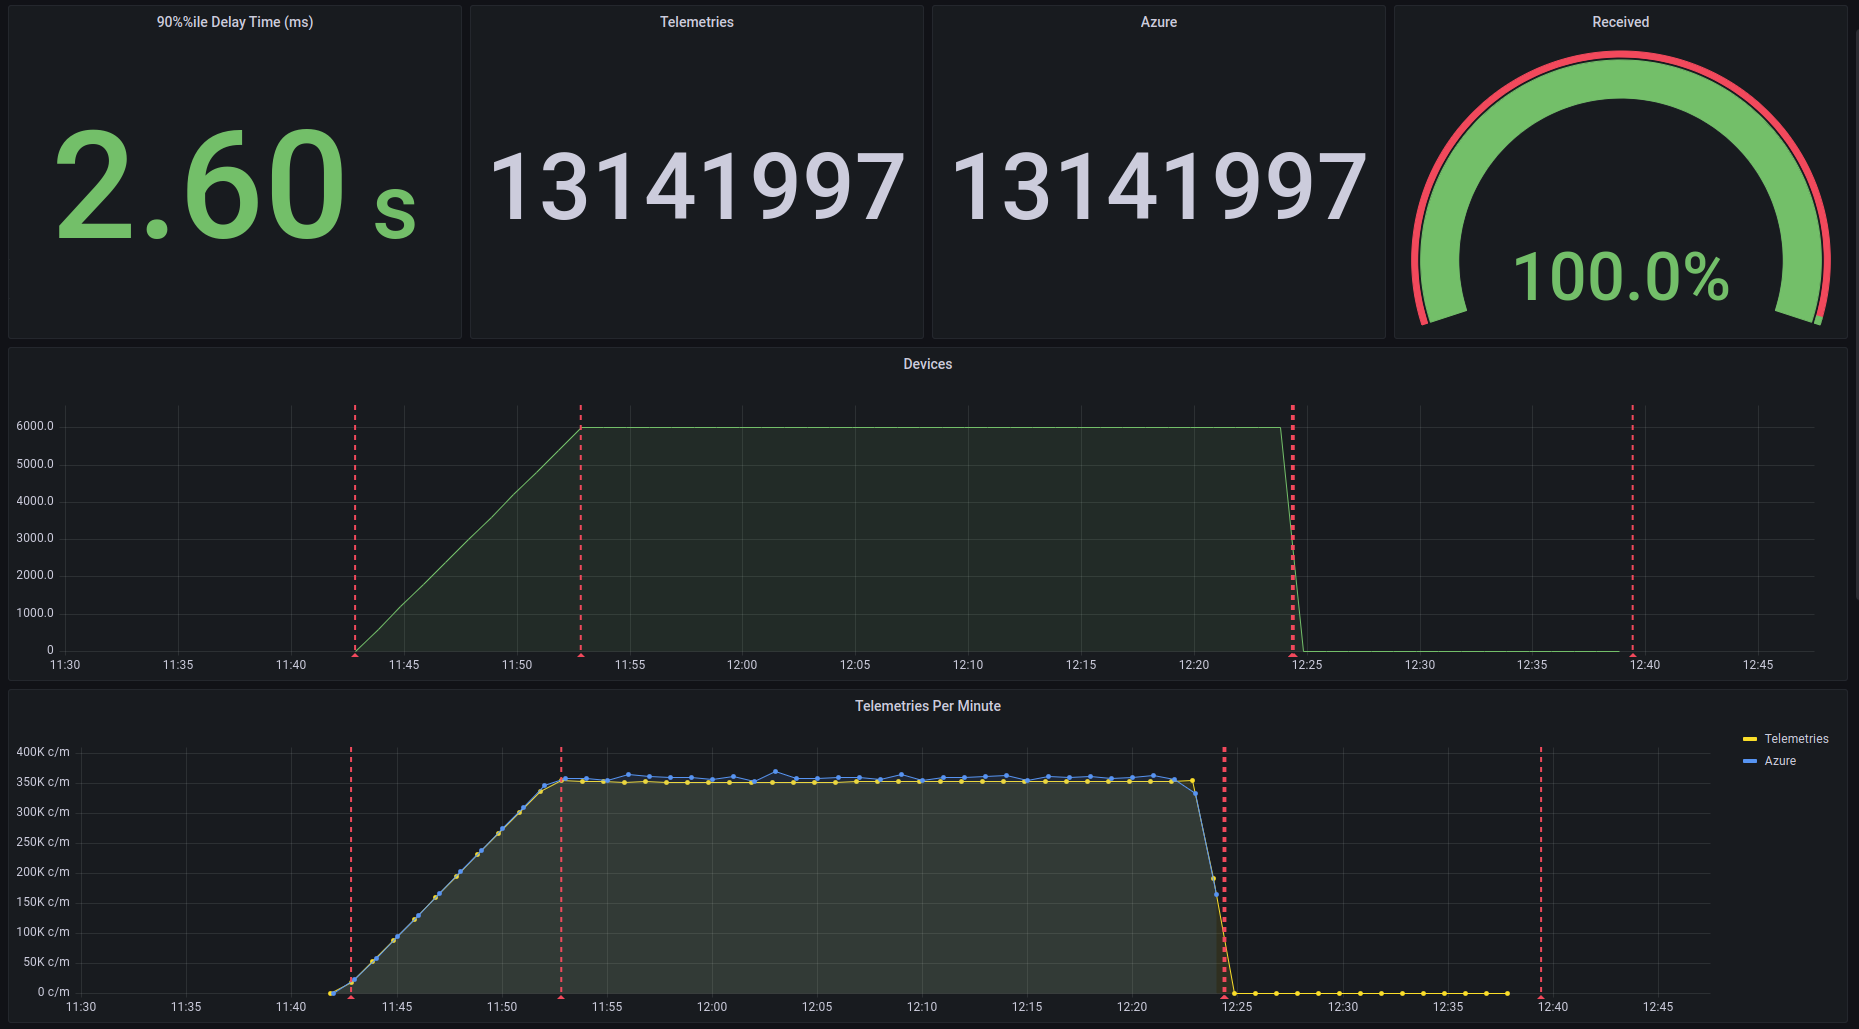
influx-token: SECRET_INFLUXDB_TOKENImport the JSON file from the Grafana folder. Grafana uses InfluxDB to aggregate the statistics and measure the event ingestion delay time (ms) and the count of the EventHub outgoing messages.
Locust uses a self-developed plugin to dump into InfluxDb the number of telemetries and devices. The following image shows the final result using the plug-in, but the JSON file only contains the EventHub results.
The ingestion delay time is measured as the event enqueue time minus the event sent time. Each telemetry has its send timestamp.
Azure EventHub outgoing messages count.


