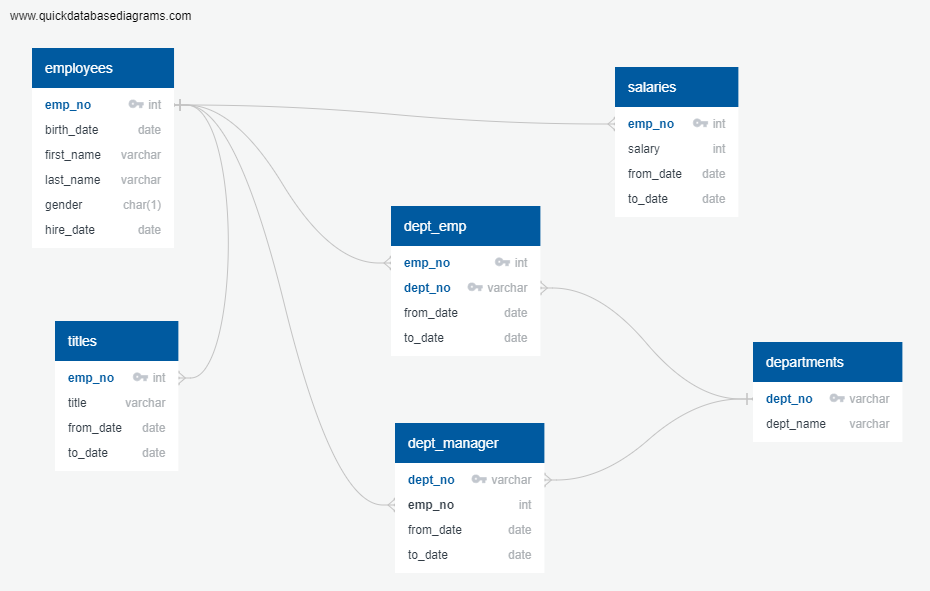
Inspect the CSVs and sketch out an ERD of the tables. Feel free to use a tool like http://www.quickdatabasediagrams.com.
- Use the information you have to create a table schema for each of the six CSV files, specifying data types, primary keys, foreign keys, and other constraints.
- Import each CSV file into the corresponding SQL table.
- List the following details of each employee: employee number, last name, first name, gender, and salary.
- List employees who were hired in 1986.
- List the manager of each department with the following information: department number, department name, the manager's employee number, last name, first name, and start and end employment dates.
- List the department of each employee with the following information: employee number, last name, first name, and department name.
- List all employees whose first name is "Hercules" and last names begin with "B."
- List all employees in the Sales department, including their employee number, last name, first name, and department name.
- List all employees in the Sales and Development departments, including their employee number, last name, first name, and department name.
- In descending order, list the frequency count of employee last names, i.e., how many employees share each last name.
-from sqlalchemy import create_engine -engine = create_engine('postgresql://localhost:5432/<your_db_name>') -connection = engine.connect()
Copyright Trilogy Education Services © 2019. All Rights Reserved.

