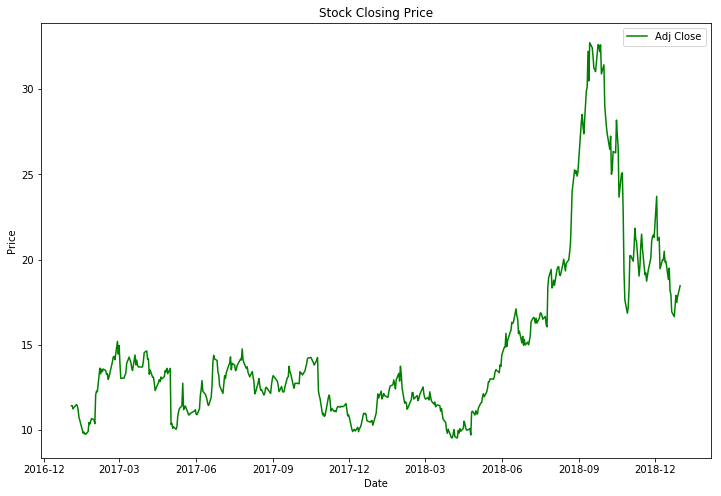
This is a tutorial for Simple Stock Analysis in jupyter and python. There are two versions for tutorials. One is a jupyter version and the other one is a python. Jupyter also makes jupyter notebooks, which used to be called iPython notebooks. However, Python is an interpreted high-level programming language. It is very simple and easy to understand for beginners that want to learn about stock analysis and want to become a quant. In addition, this tutorial is for people that want to learn coding in python to analyze the stock market. However, if you already know about stock analyzing or coding in python, this will not be for you. You can check out more advanced coding: https://github.com/LastAncientOne/Stock_Analysis_For_Quant.
You learn number 1 first and you go in order. Once you have finished, you will know how to write code in python and understand finance and the stock market. ㊗️
Python 3.5+
Jupyter Notebook Python 3
- fix_yahoo_finance or yfinance
- TensorFlow 1.10.0
- Pandas
- Numpy
- ta-lib
- matlibplot
- sklearn
Pick a symbol, you want to analyze.
Pick a 'start' date and 'end' date for certain time frame to analyze.
# Libraries
import numpy as np
import pandas as pd
import matplotlib.pyplot as plt

import warnings
warnings.filterwarnings("ignore")

# fix_yahoo_finance is used to fetch data
import fix_yahoo_finance as yf
yf.pdr_override()

# input
symbol = 'AAPL' # Apple Company
start = '2018-01-01'
end = '2019-01-01'

# Read data
df = yf.download(symbol,start,end)

# View Columns
df.head()In command DOS drive 'C:\ '
Find where you put the code .py in?
How to run python scripts in command prompt(cmd) or Windows PowerShell?
- How to get data from yahoo, quandl, or other sites?
- How to scrape historical data, fundamental data, and news data?
- How to analyze the stock data?
- How to make a trendlines?
- How to use Technical Analysis and Fundamental Analysis?
- How to add and save to csv file?
- How to customize table and make beautiful plot?
- How to create class and function for stock?
- How to create and run scripts?
- How to applied statistics and timeseries for stock?
- How to create buy and sell signals?
- How to create stock prediction in machine learning and deep learning?
- How to create simple stock strategy?
- Example of python libraries for Technical Analysis and fetching historical stock prices.
❌ If the code does not load or reload, click here: 👉 https://nbviewer.jupyter.org/
Paste the link in the box.
I tried to make it simple as possible to understand finance data and how to analyze the data by using python language.
If you want to learn different simple function for stock analysis, go to: https://github.com/LastAncientOne/100_Day_Challenge
If you want to learn more advance stock analysis or different language in finance, go to: https://github.com/LastAncientOne/Stock_Analysis_For_Quant
If you into deep learning or machine learning for finance, go to: https://github.com/LastAncientOne/Deep-Learning-Machine-Learning-Stock
If you want to learn about Mathematics behind deep learning or machine learning, go to: https://github.com/LastAncientOne/Mathematics_for_Machine_Learning
https://www.investopedia.com/terms/s/stock-analysis.asp (Basic Stock Analysis)
https://www.investopedia.com/articles/investing/093014/stock-quotes-explained.asp (Understand Stock Data)
https://www.investopedia.com/terms/t/trendline.asp (Understand Trendline)
- Tin Hang
🔻 Do not use this code for investing or trading in the stock market. Stock market is unpredictable. 📈 📉 However, if you are interest in the stock market, you should read many 📚 books that relate to the stock market, investment, or finance. The more books you read, the more you will understand and the more knowledge you gain. On the other hand, if you are into quant or machine learning, read books about 📘 finance engineering, machine trading, algorithmic trading, and quantitative trading.


