- OULA (intelligent grade prediction system)
- Dataset Description
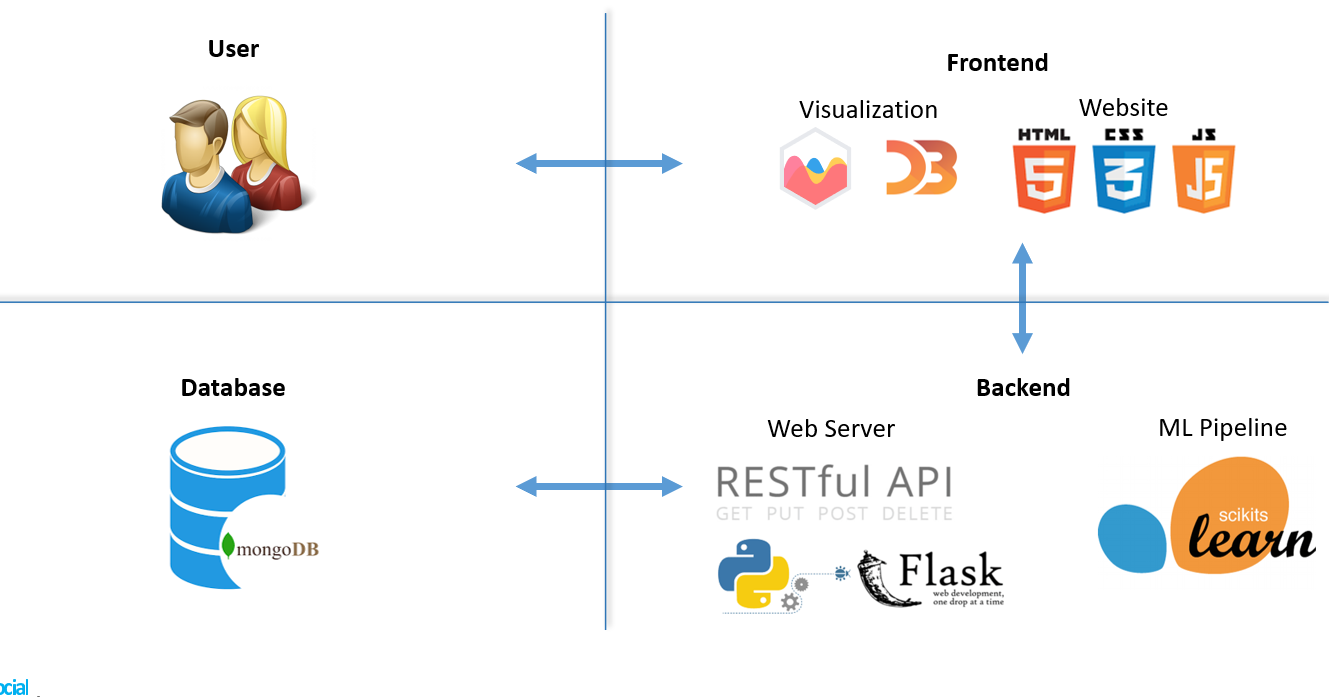
- Implementation Technologies
- App Structure
- Code Description
- To deploy the project
- Contributors

A Youtube video shows a demo
Open University Learning Analytics its an intelligent grade prediction system that aims to analyse student performance and predict their results [Distinction, Fail, Pass, Withdrawn].
This project was submited as a final project for Learning Analitics course under Social Computing department at Duisburg-Essen University.
- Multivariate dataset
- It consists of 7 tables in csv format
- Categorized based on 3 main types :
- Demographic - Gender, Age, Region, IMD-band, Highest Education
- Student Activities - Score and Semester
- Module - Code Module and Code Presentation
- There are 32,593 students in 7 different module
- The source of dataset is HERE
This project is based on the following technologies:
- Front-End
- Website
- Javascript
- CSS
- HTML
- Visualisation
- Chartjs
- D3
- Website
- Back-End
- Web Server
- Python
- Flask
- Machine Learning Pipeline
- Scikits Learn
- Database
- mongoDB
- Web Server

The project has the following structure:
App (OULA):
- static (folder)
- datasets (folder)
- images (folder)
- javascript (folder)
- viz.js (main javascript file for chartjs charts functions)
- layout (folder)
- styles (css folder)
- styles (jquery folder)
- template (folder)
- about_us.html (about us page)
- dataset.html (dataset description)
- header.html (header for all pages)
- index.html (home page)
- machinelearning.html (machine Learning description)
- prediction.html (page for showing the prediction result with some charts and Visualization)
- question_form.html (form for getting user input)
- real_time_statistics.html (page to show some visualizations about the website users)
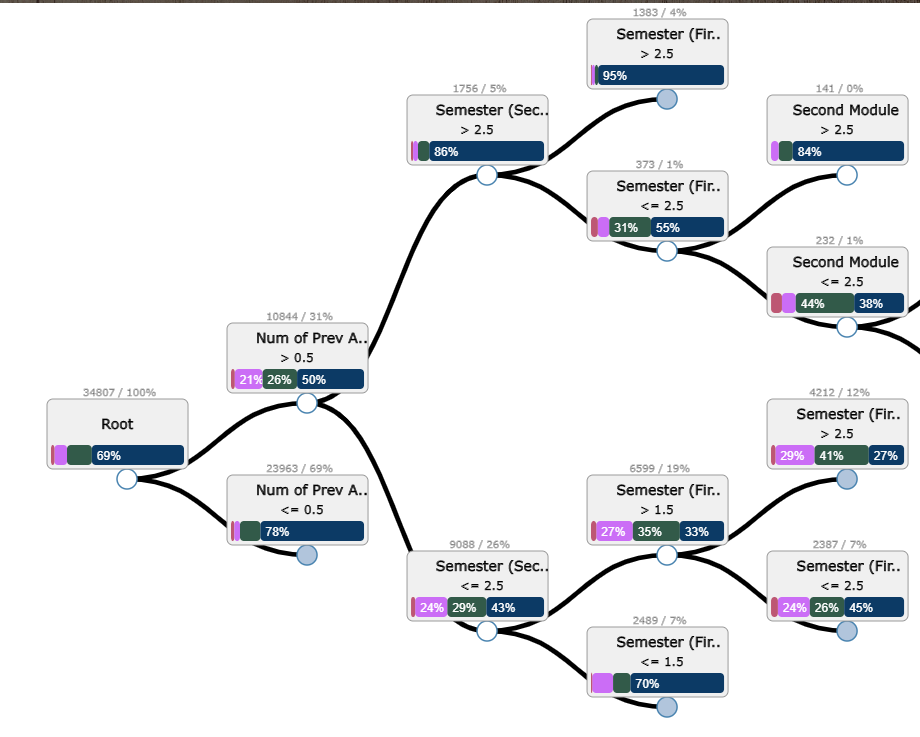
- tree2.html (tidy tree based on D3.js library)
- tree2.html (tidy tree based on D3.js library)
- databaseMongodb.py (database connection)
- evaluateModels.py (evaluating the machine learning models)
- labelEncoder.py (encode the user selection to feed it into machine learning model)
- prediction.py (predict student result by training on any N features)
- predictiveModels.py (machine learning models)
- preprocessData.py (pre-process the data)
- server.py (main file to run the server and render the html templates)
- testingMongo.py (testing the connection to MongoDB)
- traverseJson.py (traverse json file to create the tree-map for visualisation)
- createJsonInteractiveVisualisation.py (extracting json from decision tree)

- Data preprocessing (approx. 12% data reduction) - Merging tables to form a main table - Chi Square test for Feature selection.
- Machine Learning Algorithms - Decision Tree - Random Forest - Naïve Bayes - Gradient Boosting - SVM.
- Evaluation - Accuracy - Confusion Matrix.
Needed libraries:
* Pandas
* Numpy
* SklearnServer.py is the main file for our backend server using "Flask" python framework. The server starts by rendering the Home Page on http://localhost:5000/.
@app.route('/')
@app.route('/home')
def main():
return render_template('index.html')All Visualisation chart is built using:
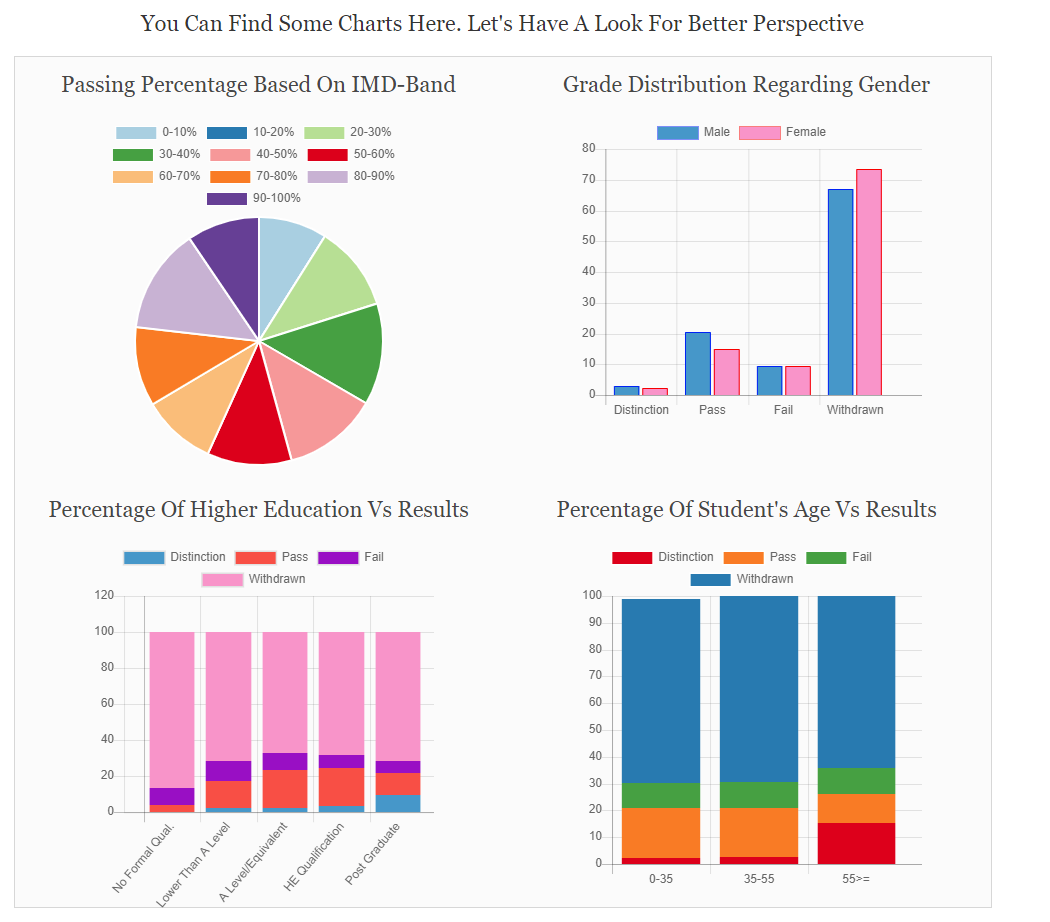
- Chart.js is providing charts for understading the dataset characteristics and to show trends for the users using the website.
Example: prediction_database function: To plot grade distribution regarding gender.
// chart for trends page
function prediction_database(w_male, w_female, p_male, p_female, f_male, f_female, d_male, d_female) {
    var ctx = document.getElementById('prediction_database').getContext('2d');
    var chart = new Chart(ctx, {
        // The type of chart we want to create
        type: 'bar',
        // The data for our dataset
        data:
        {
            labels: ['Distinction', 'Pass', 'Fail', 'Withdrawn'],
            datasets: [{
                    label: 'Male',
                    backgroundColor: ["#3e95cd","#3e95cd","#3e95cd","#3e95cd",],
                    borderColor: 'rgb(0, 0, 255)',
                    borderWidth: 1,
                    data: [ d_male, p_male, f_male, w_male]
                }, {
                    label: 'Female',
                    backgroundColor: ["#ff95cd","#ff95cd","#ff95cd","#ff95cd"],
                    borderColor: 'rgb(255, 0, 0)',
                    borderWidth: 1,
                    data: [ d_female, p_female, f_female, w_female]
                }]
        },
        // configuration options go here
        options: {}
    });
}- D3.js We are using D3 library to Visualise the Decision Tree using Tidy Tree, we are visualising the decision tree to show student path for the predicted result.
First you need to install below requirements:
- Download PyCharm(Community Edition) or your preferred IDE.
- Download latest version of Python
After configuring the python inside your IDE you need to install this project from this repository.
Then you need to install below requirements on our system:
- sci-kit learn == 0.22.1
- Flask == 1.1.1
- Numpy == 1.17.4
- Pandas == 0.25.2
- html5lib == 1.0.1
- pymongo == 3.8.0
- dnspython == 1.16.0
In the end you can simply run the server.py file and then server will run on you localhost. Then just open Browser and access http://localhost:5000/ and enjoy the Web Application.
Sameh Frihat
Aashish Agarwal
Shoeb Ahmed Joarder
Seyedemarzie Mirhashemi

