In this project, I am analyzing SF Bay Area Bike Share dataset. To do so, I am using following datasets:
- Trips Dataset
- Station Dataset
- Weather Dataset
- Yelp Customer Reviews Dataset
Through this analysis, I aim to achieve a better understanding of how different factors affect the bike sharing and how BABS has been performing over the course of time.
Click here to go to the dataset.
- Hadoop MapReduce
- HBase
- Hive
- Pig
- Weka
- Tableau
Note: All the charts are plotted using Tableau
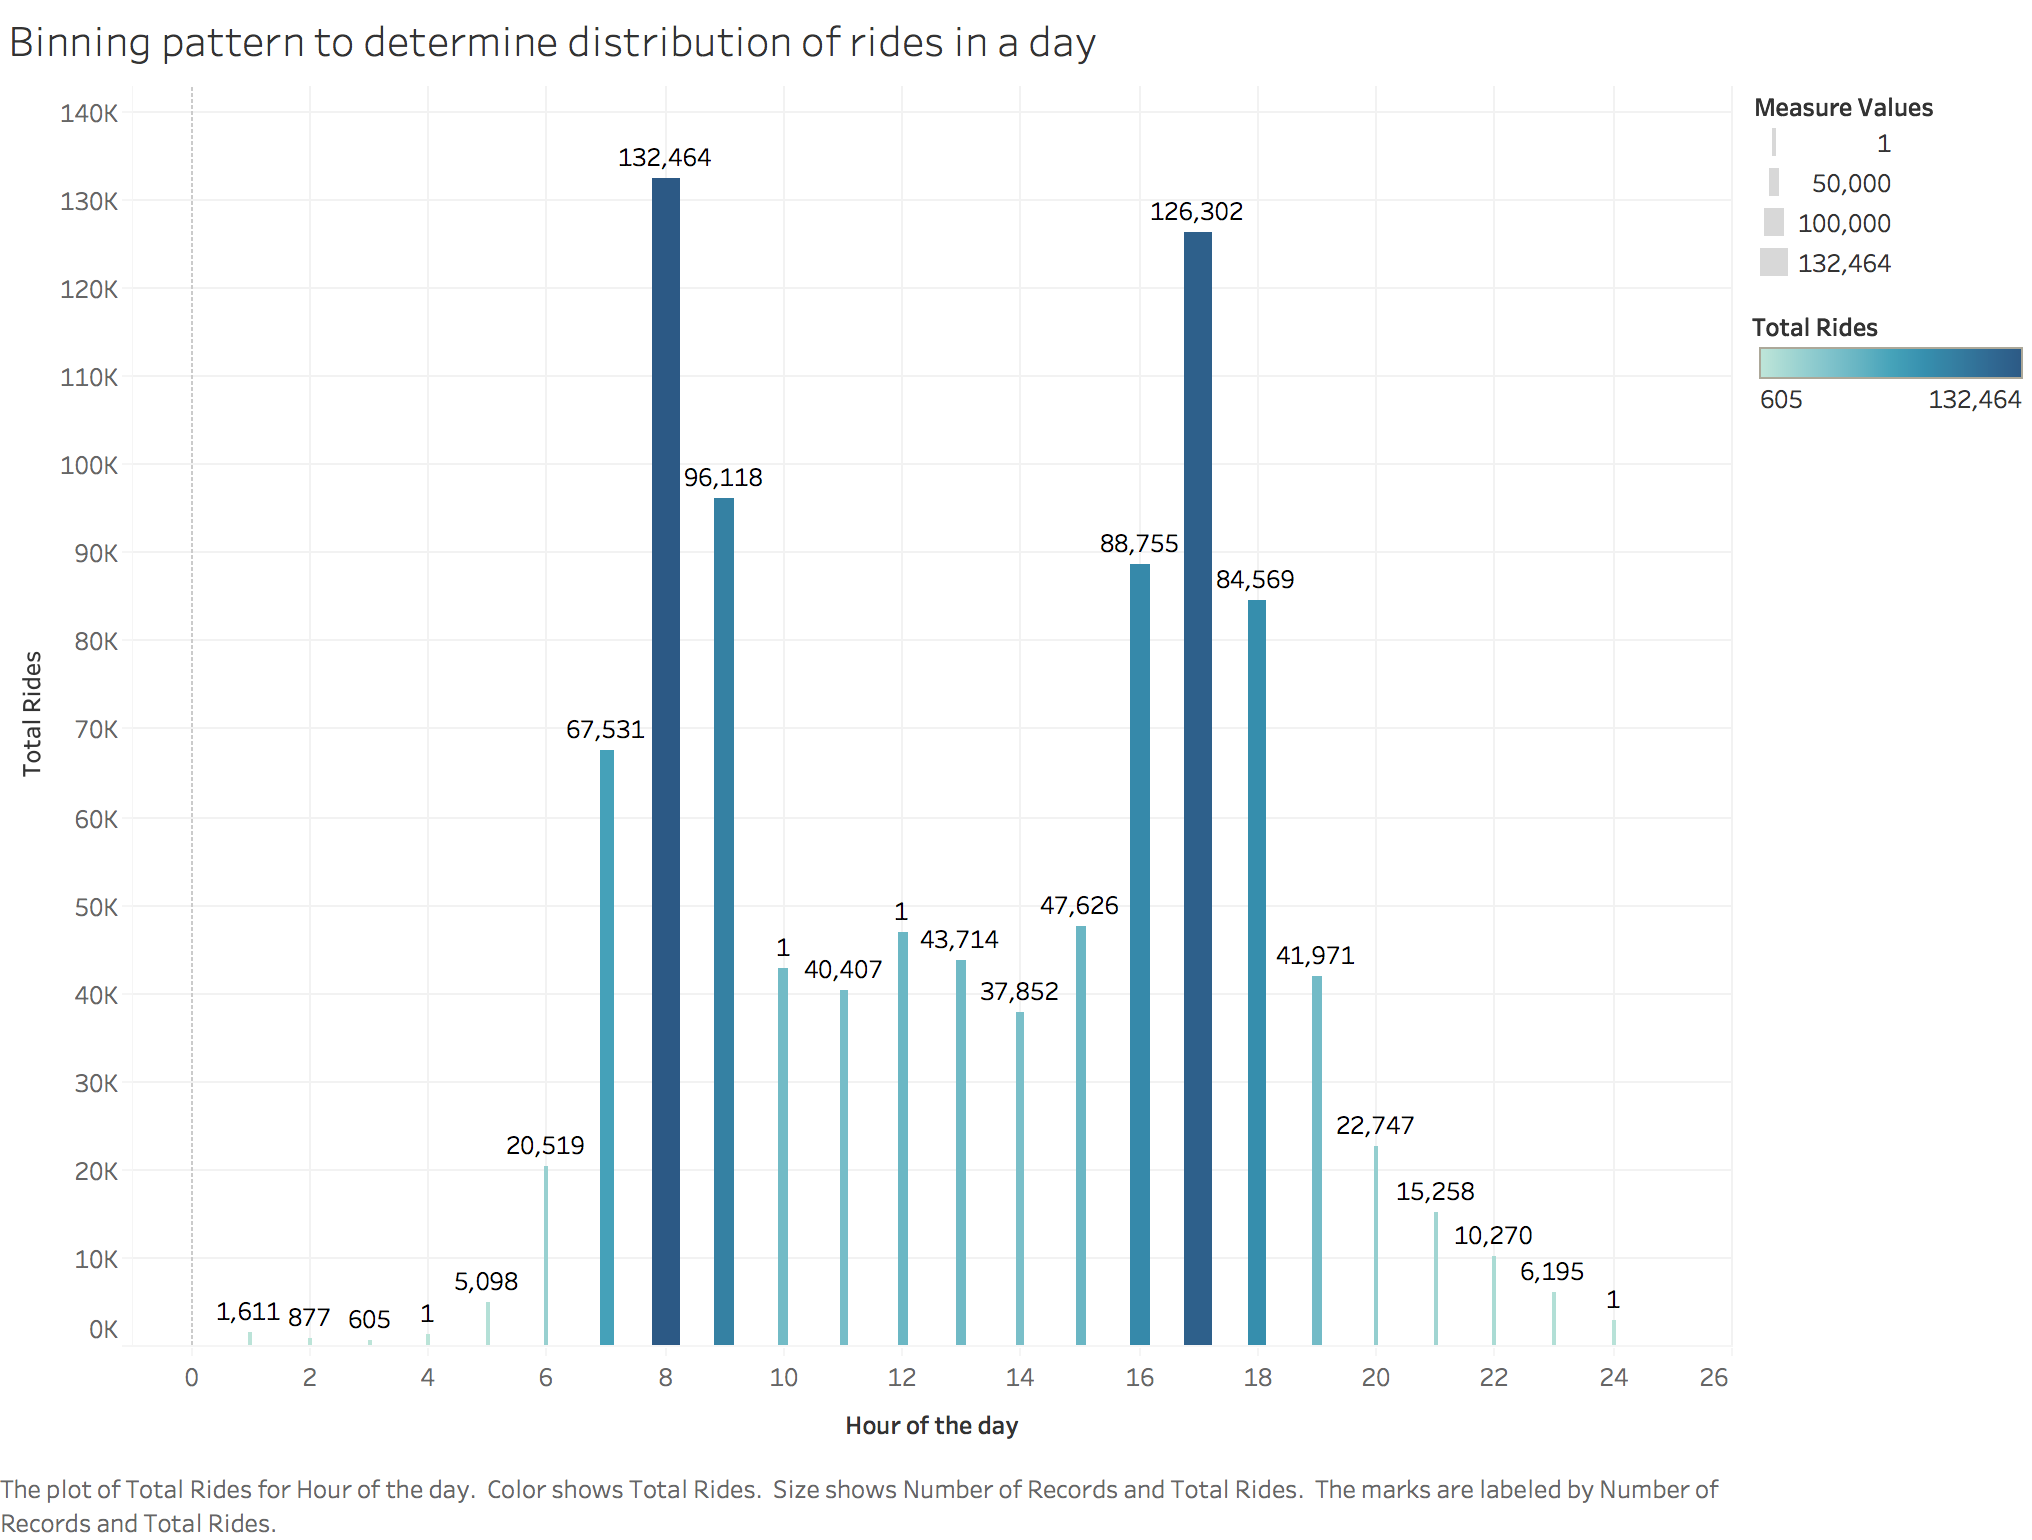
Using this analysis, I aimed at finding the spread of rides over the hours of the day.
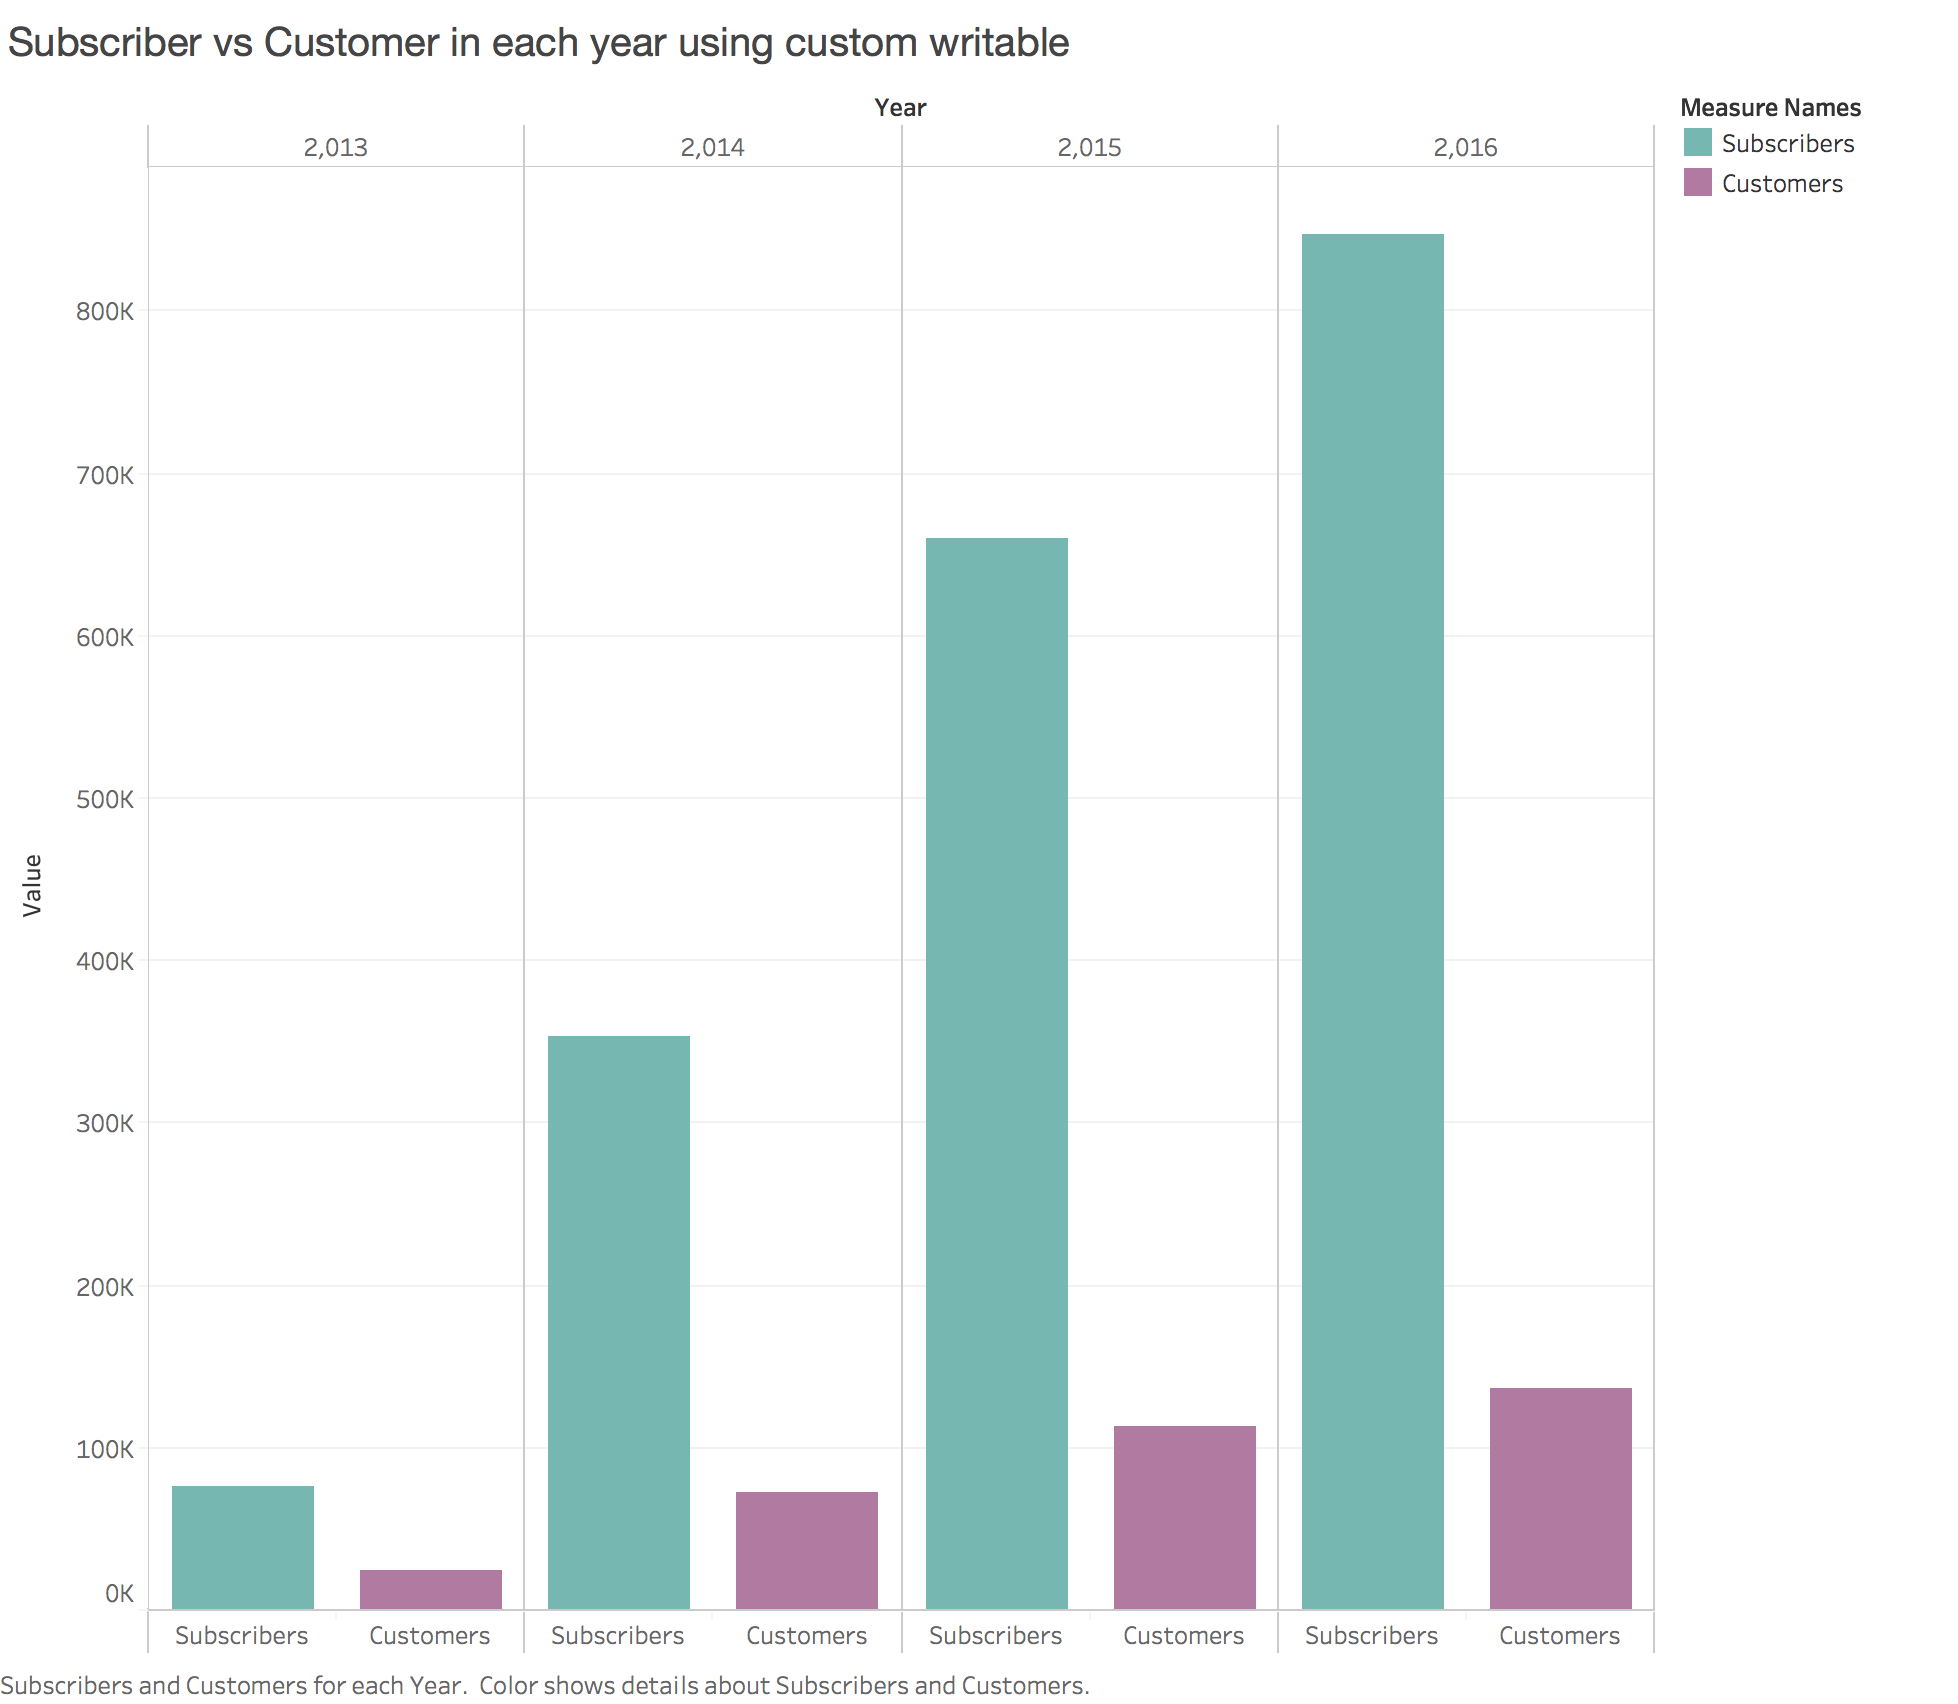
In this analysis, I have used custom writable objects to store the running total of the count for each kind of user. The result obtained can be understood from the following tableau chart:
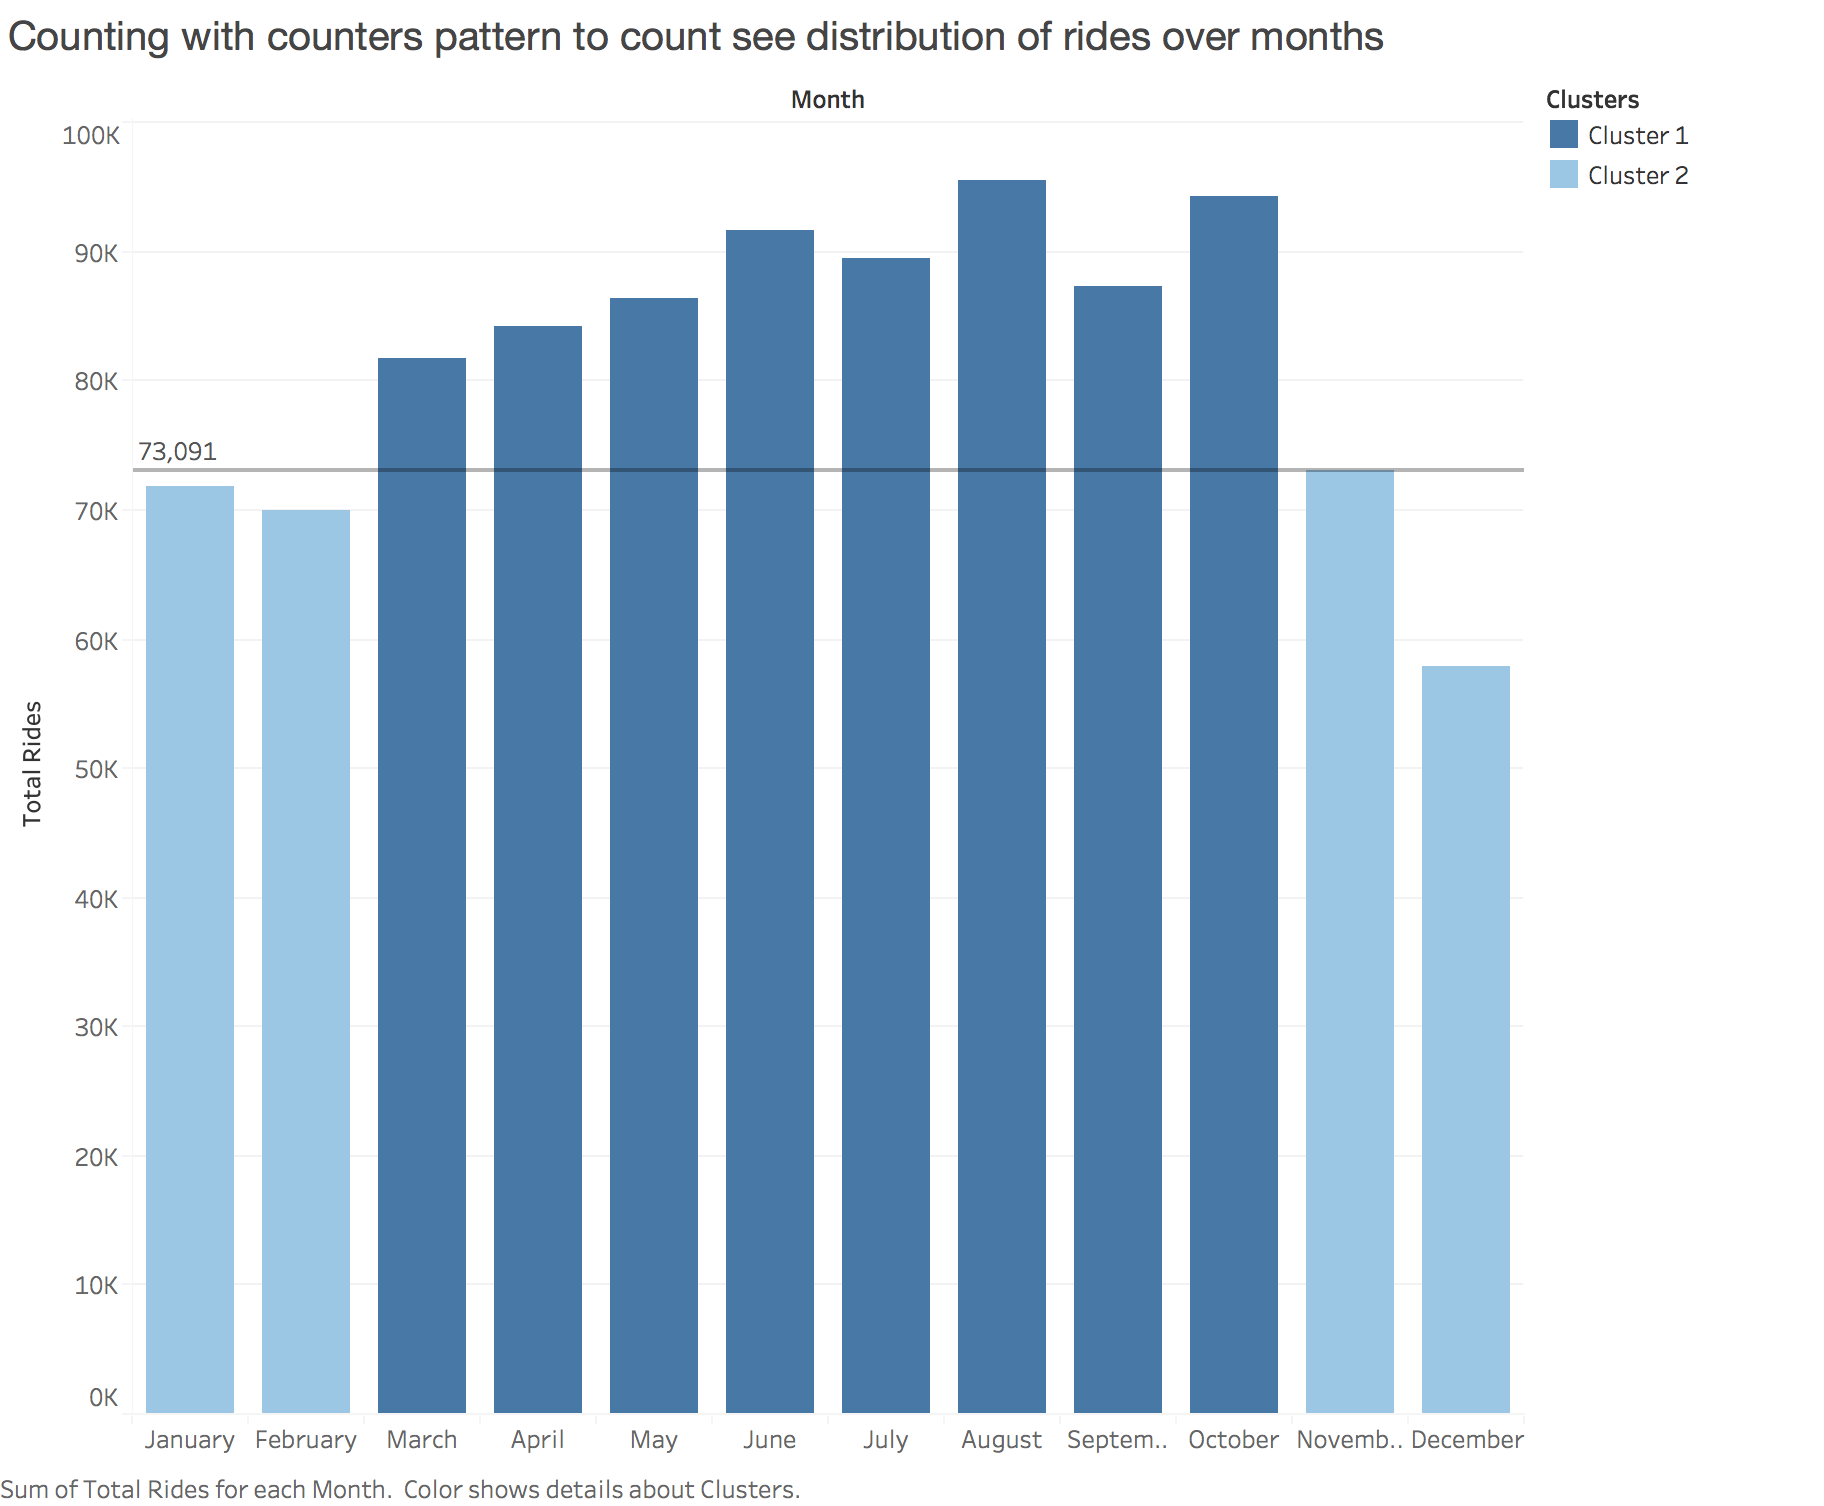
To determine the distribution of rides over the year for each month, I have used counting with counters pattern.
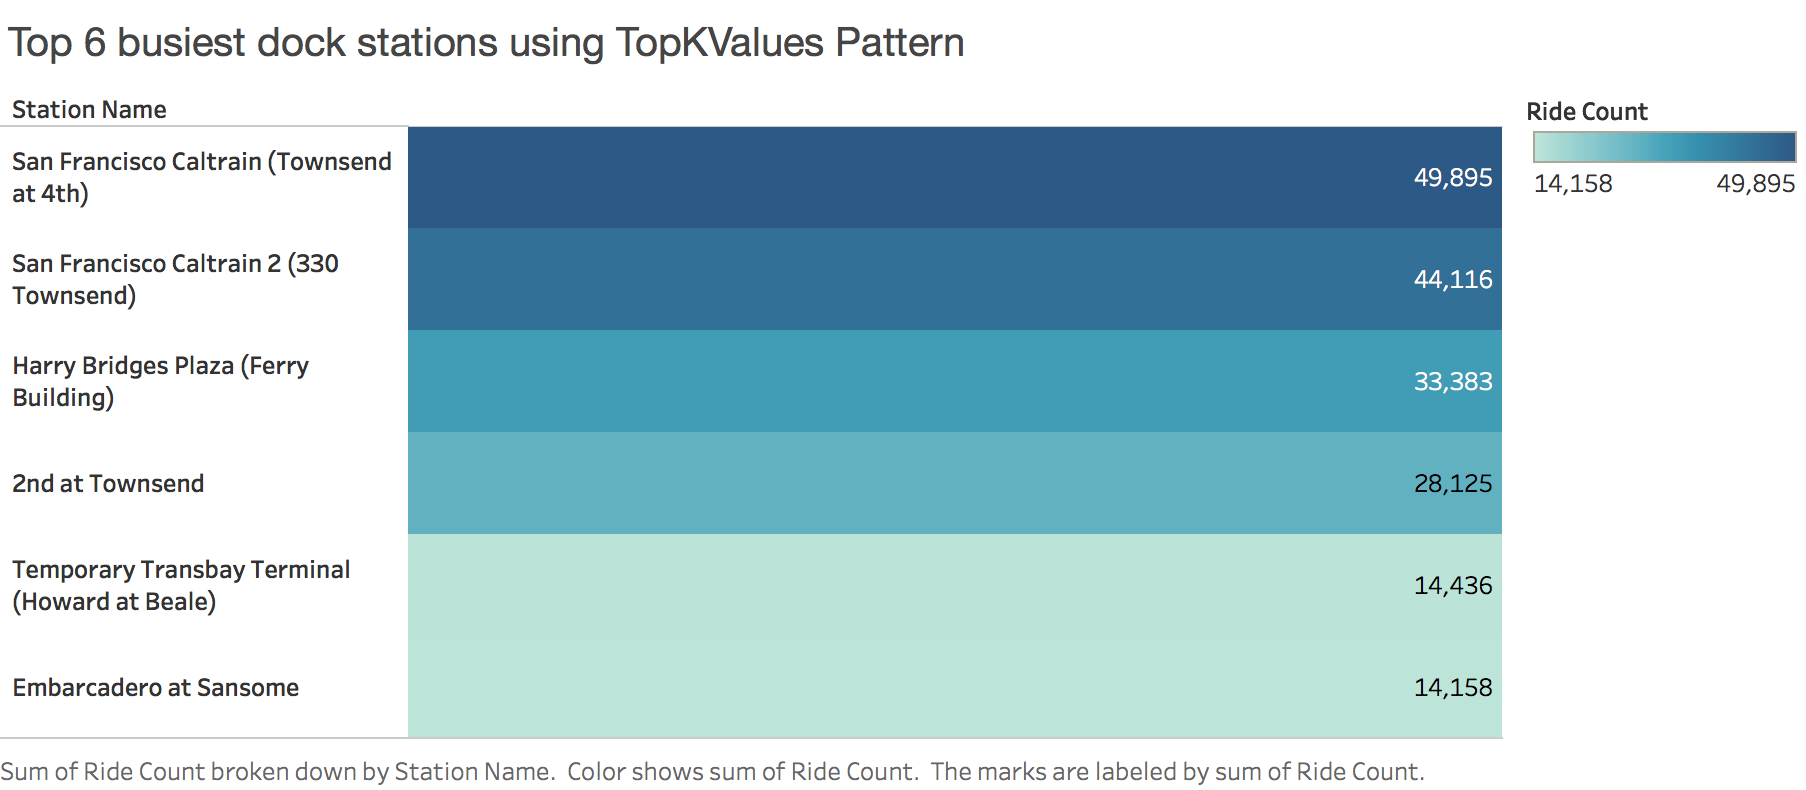
Here, we are employing Top K values pattern to determine top 6 most busiest stations in the bay area. These are the stations from where most number of rides start.
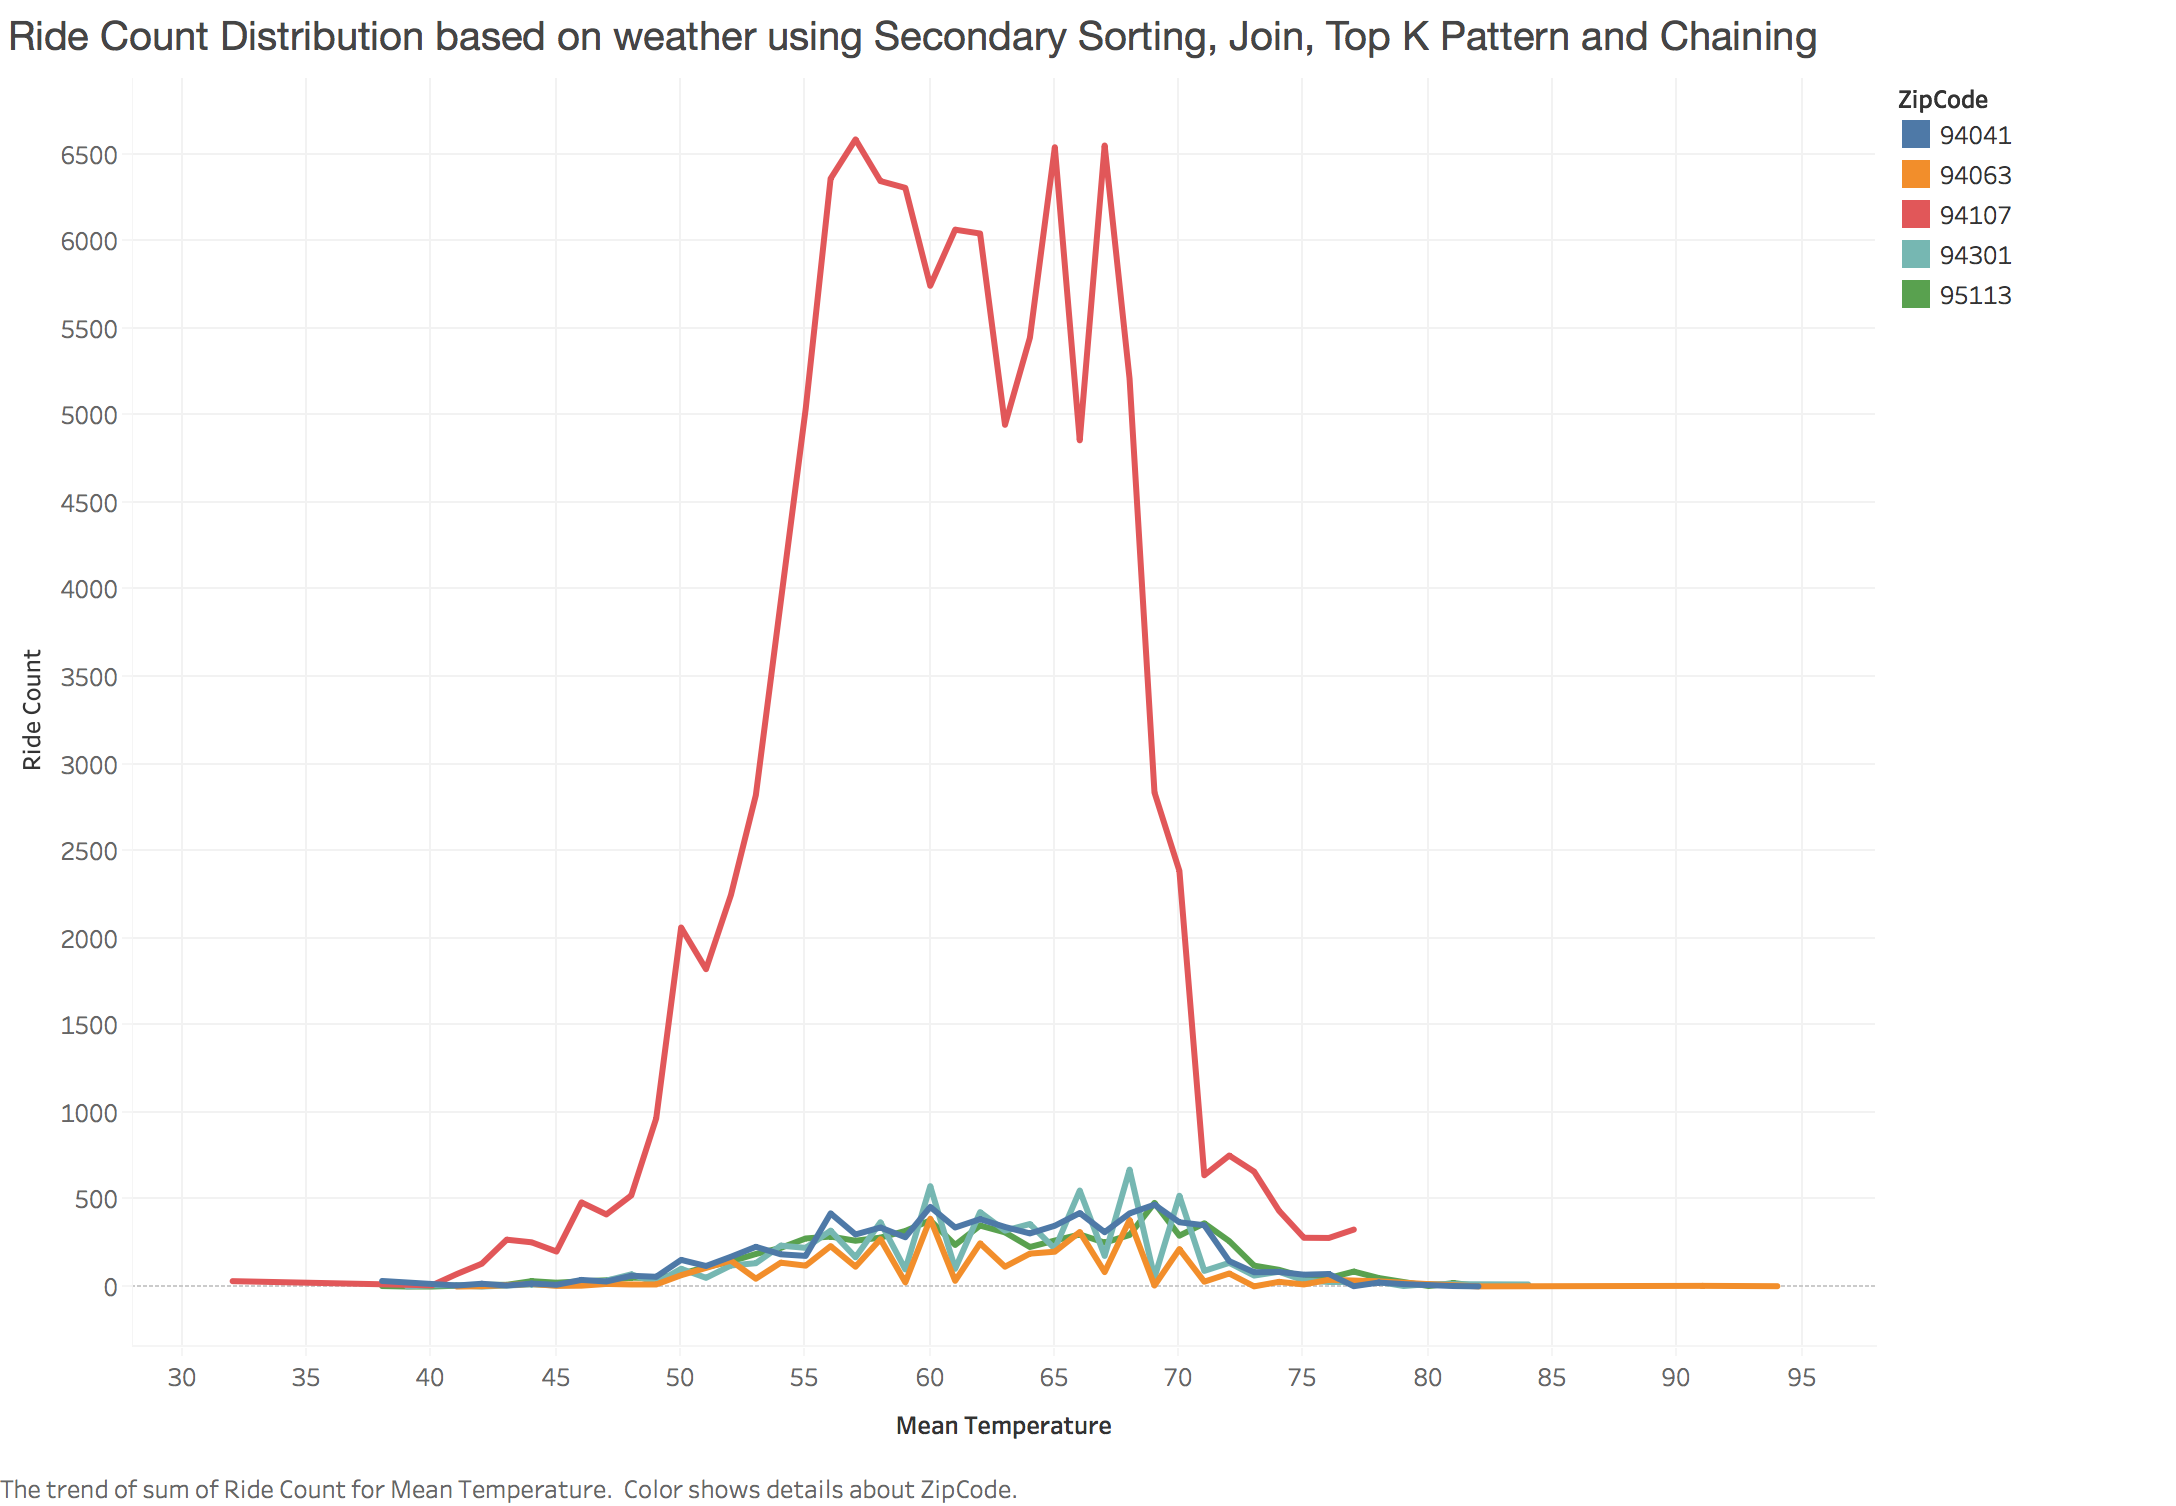
In this analysis, we are determining how the mean temperature of a day affects the turn up of people for bike share. We are making this analysis for top 5 busiest stations.
To achieve this, we are join two datasets using inner join. We are also employing secondary sorting, inner join, top k pattern and chaining techniques.
I have used Yelp API to fetch data of customer’s review for BABS service. A very naïve method is used to analyze sentiments of users.
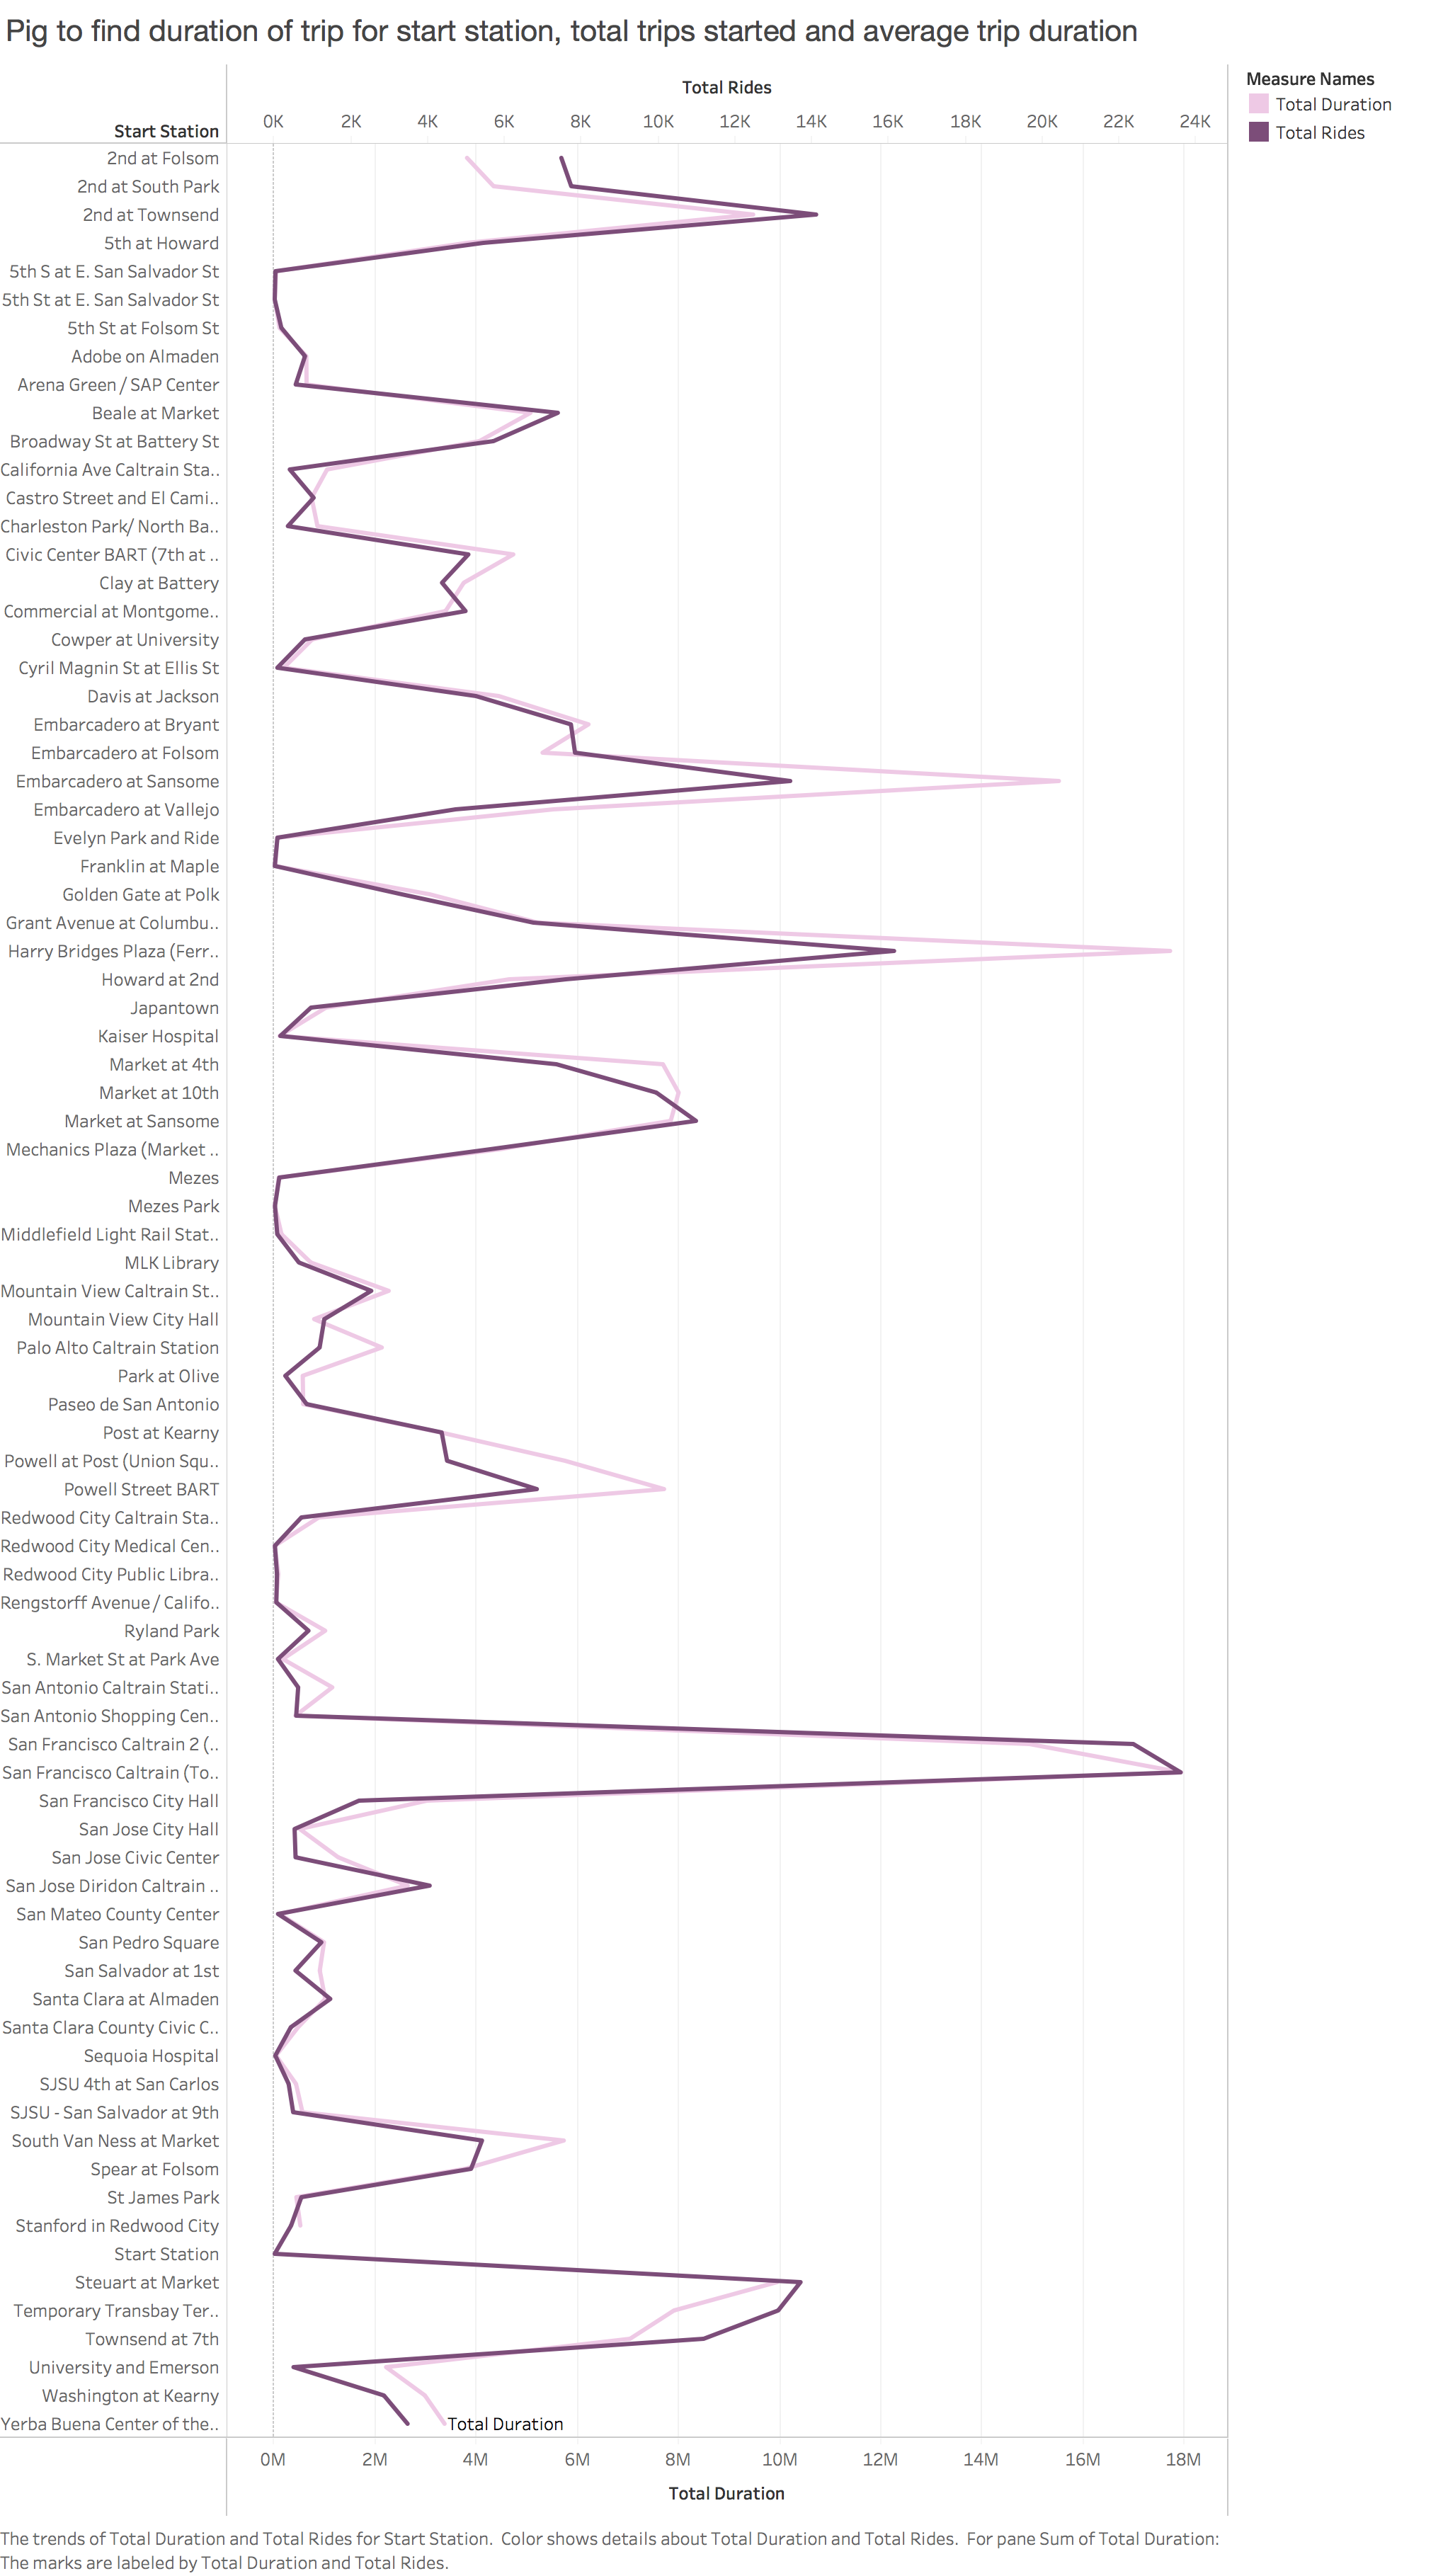
Analysis 7: Using Pig to find duration of trip for start station, total trips started and average trip duration
I have used Pig in local mode for this analysis. Following are the commands
- Start Pig
./pig -x local
- Load table data
tripdata = LOAD '/Users/mansijain/Desktop/BABS-Dataset/trips/trips.csv' USING PigStorage(',') as (trip_id: int, start_date: chararray, start_station: chararray, start_term: chararray, end_date: chararray, end_station: chararray, end_term: int, bike, zip_code: int);
- Group data by start station column
split_station = GROUP tripdata BY start_station;
- Perform aggregate function
results = FOREACH split_station GENERATE GROUP AS start_station, SUM(tripdata.duration), AVG(tripdata.duration), count(trip_id);
- Store results in local fs
STORE results INTO '/Users/mansijain/Desktop/BABS-Dataset/results/start_stn' USING PigStorage(',');
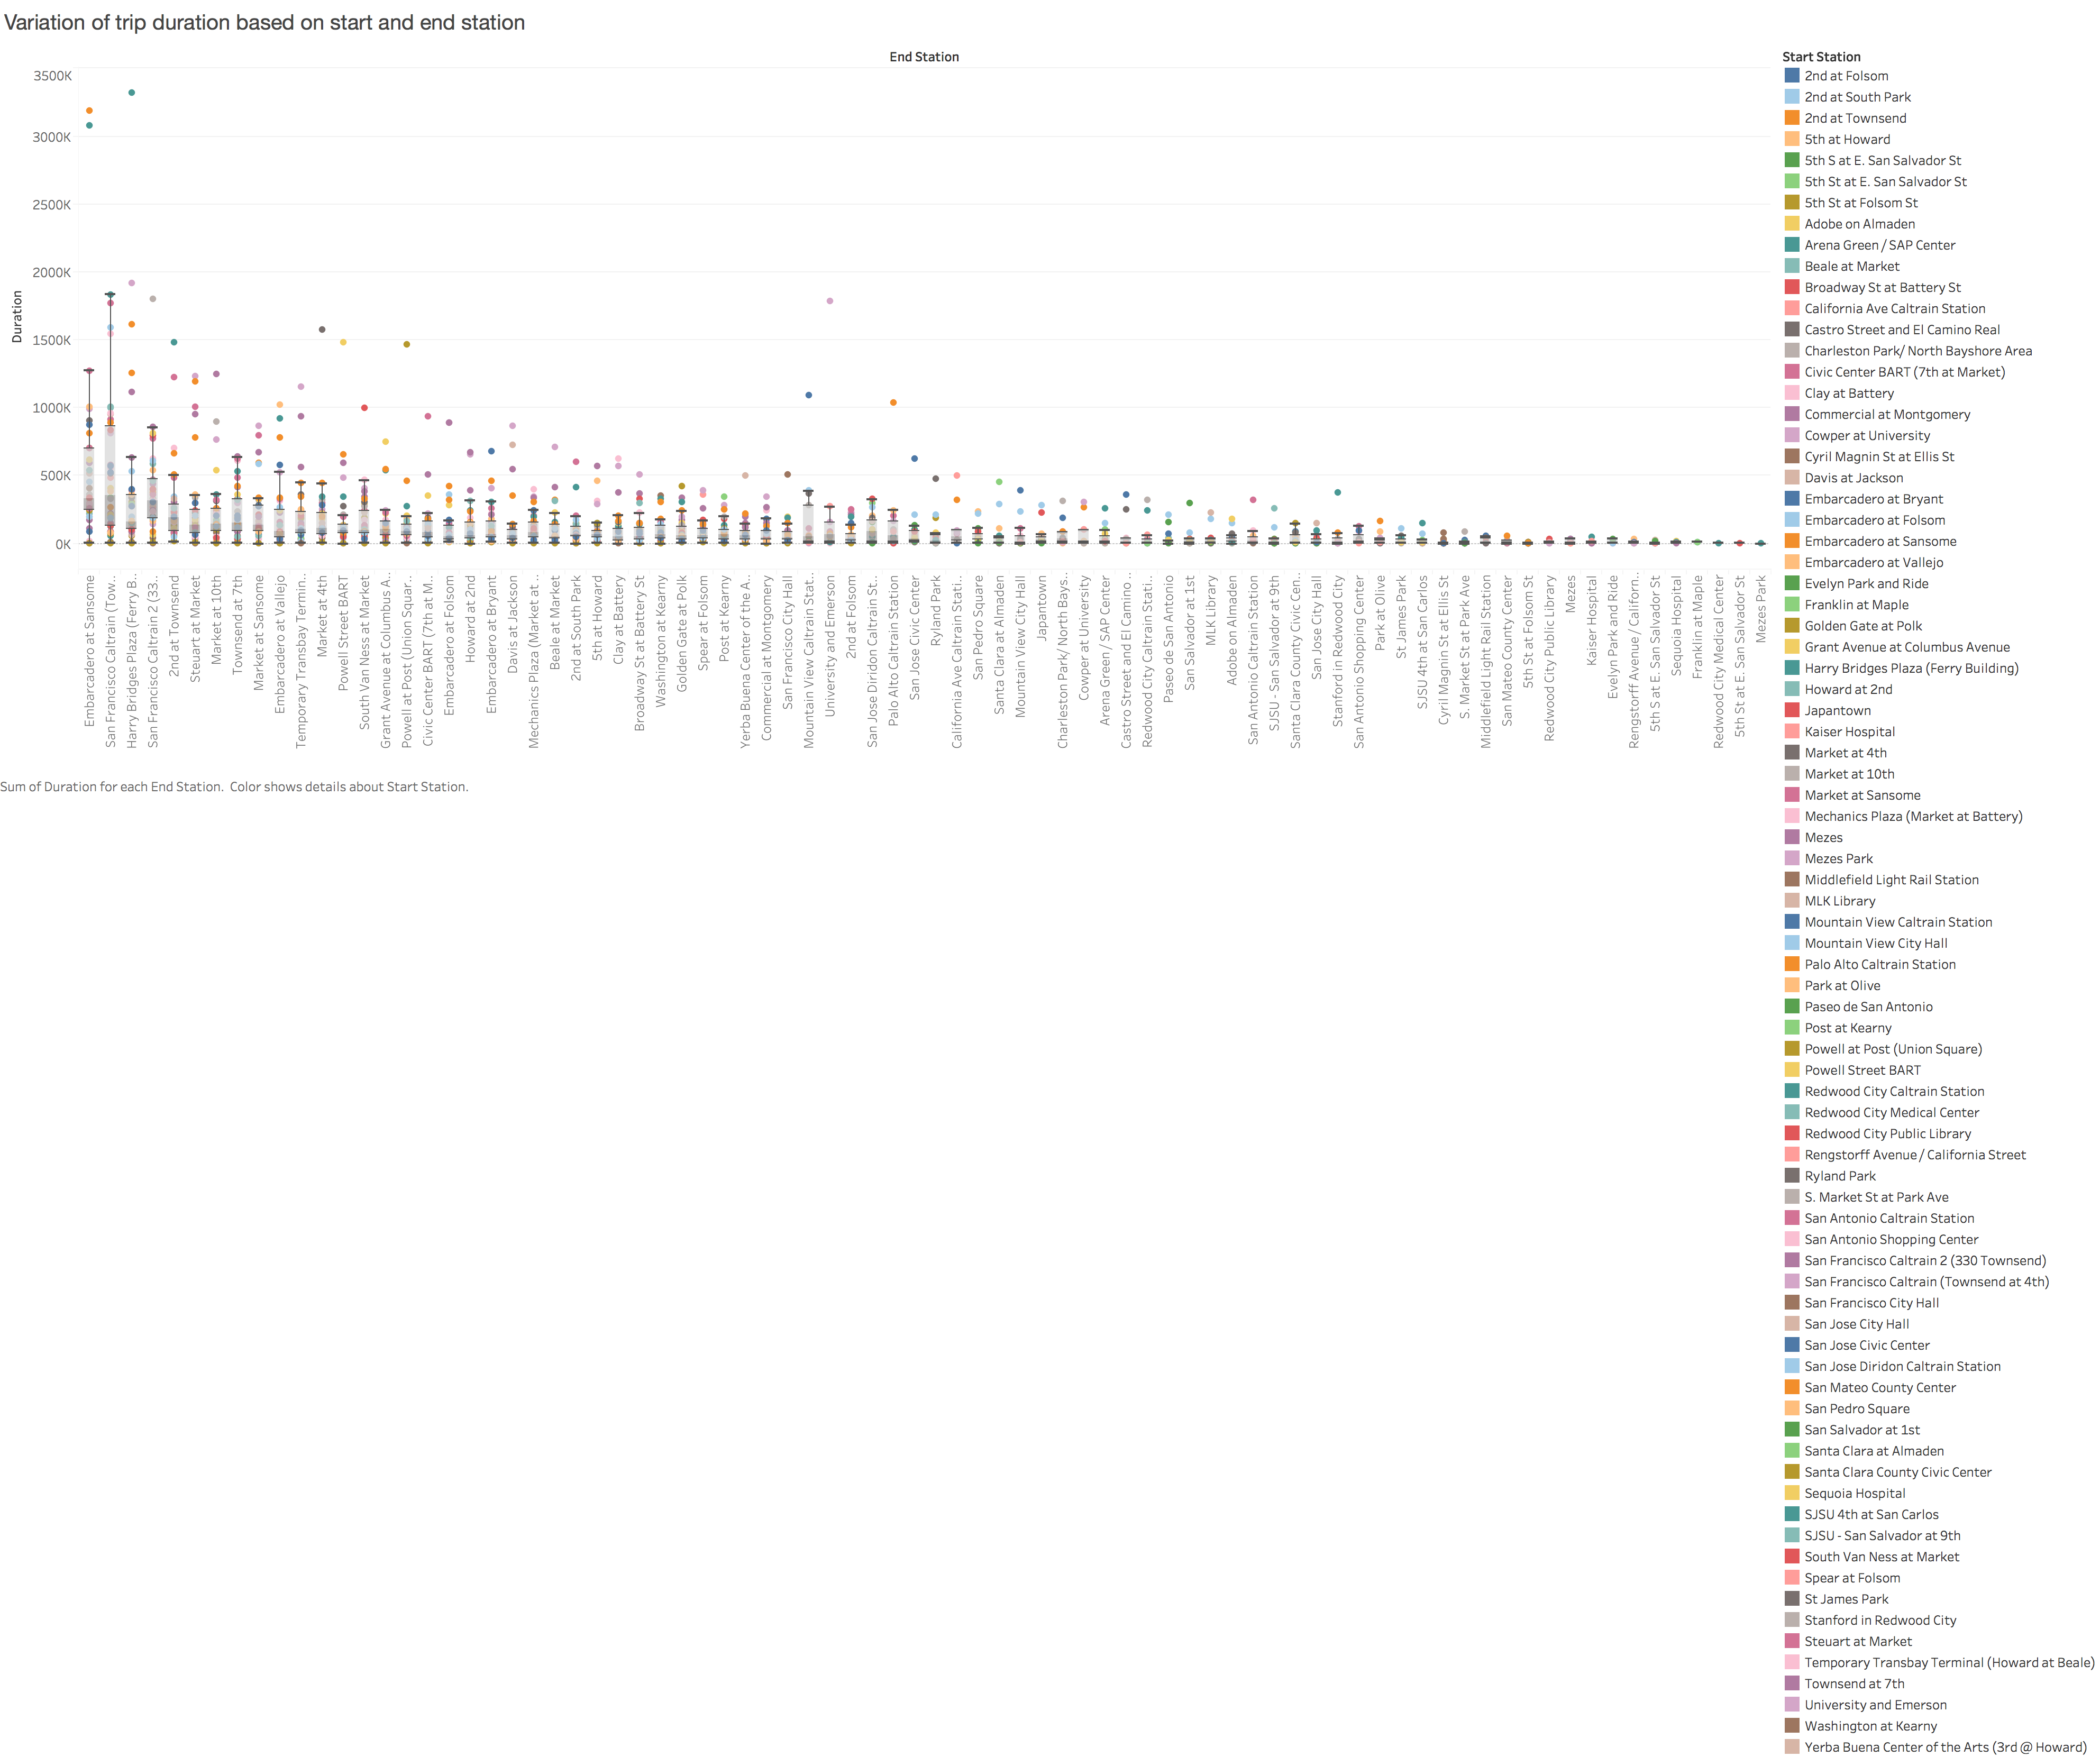
Following chart was obtained:
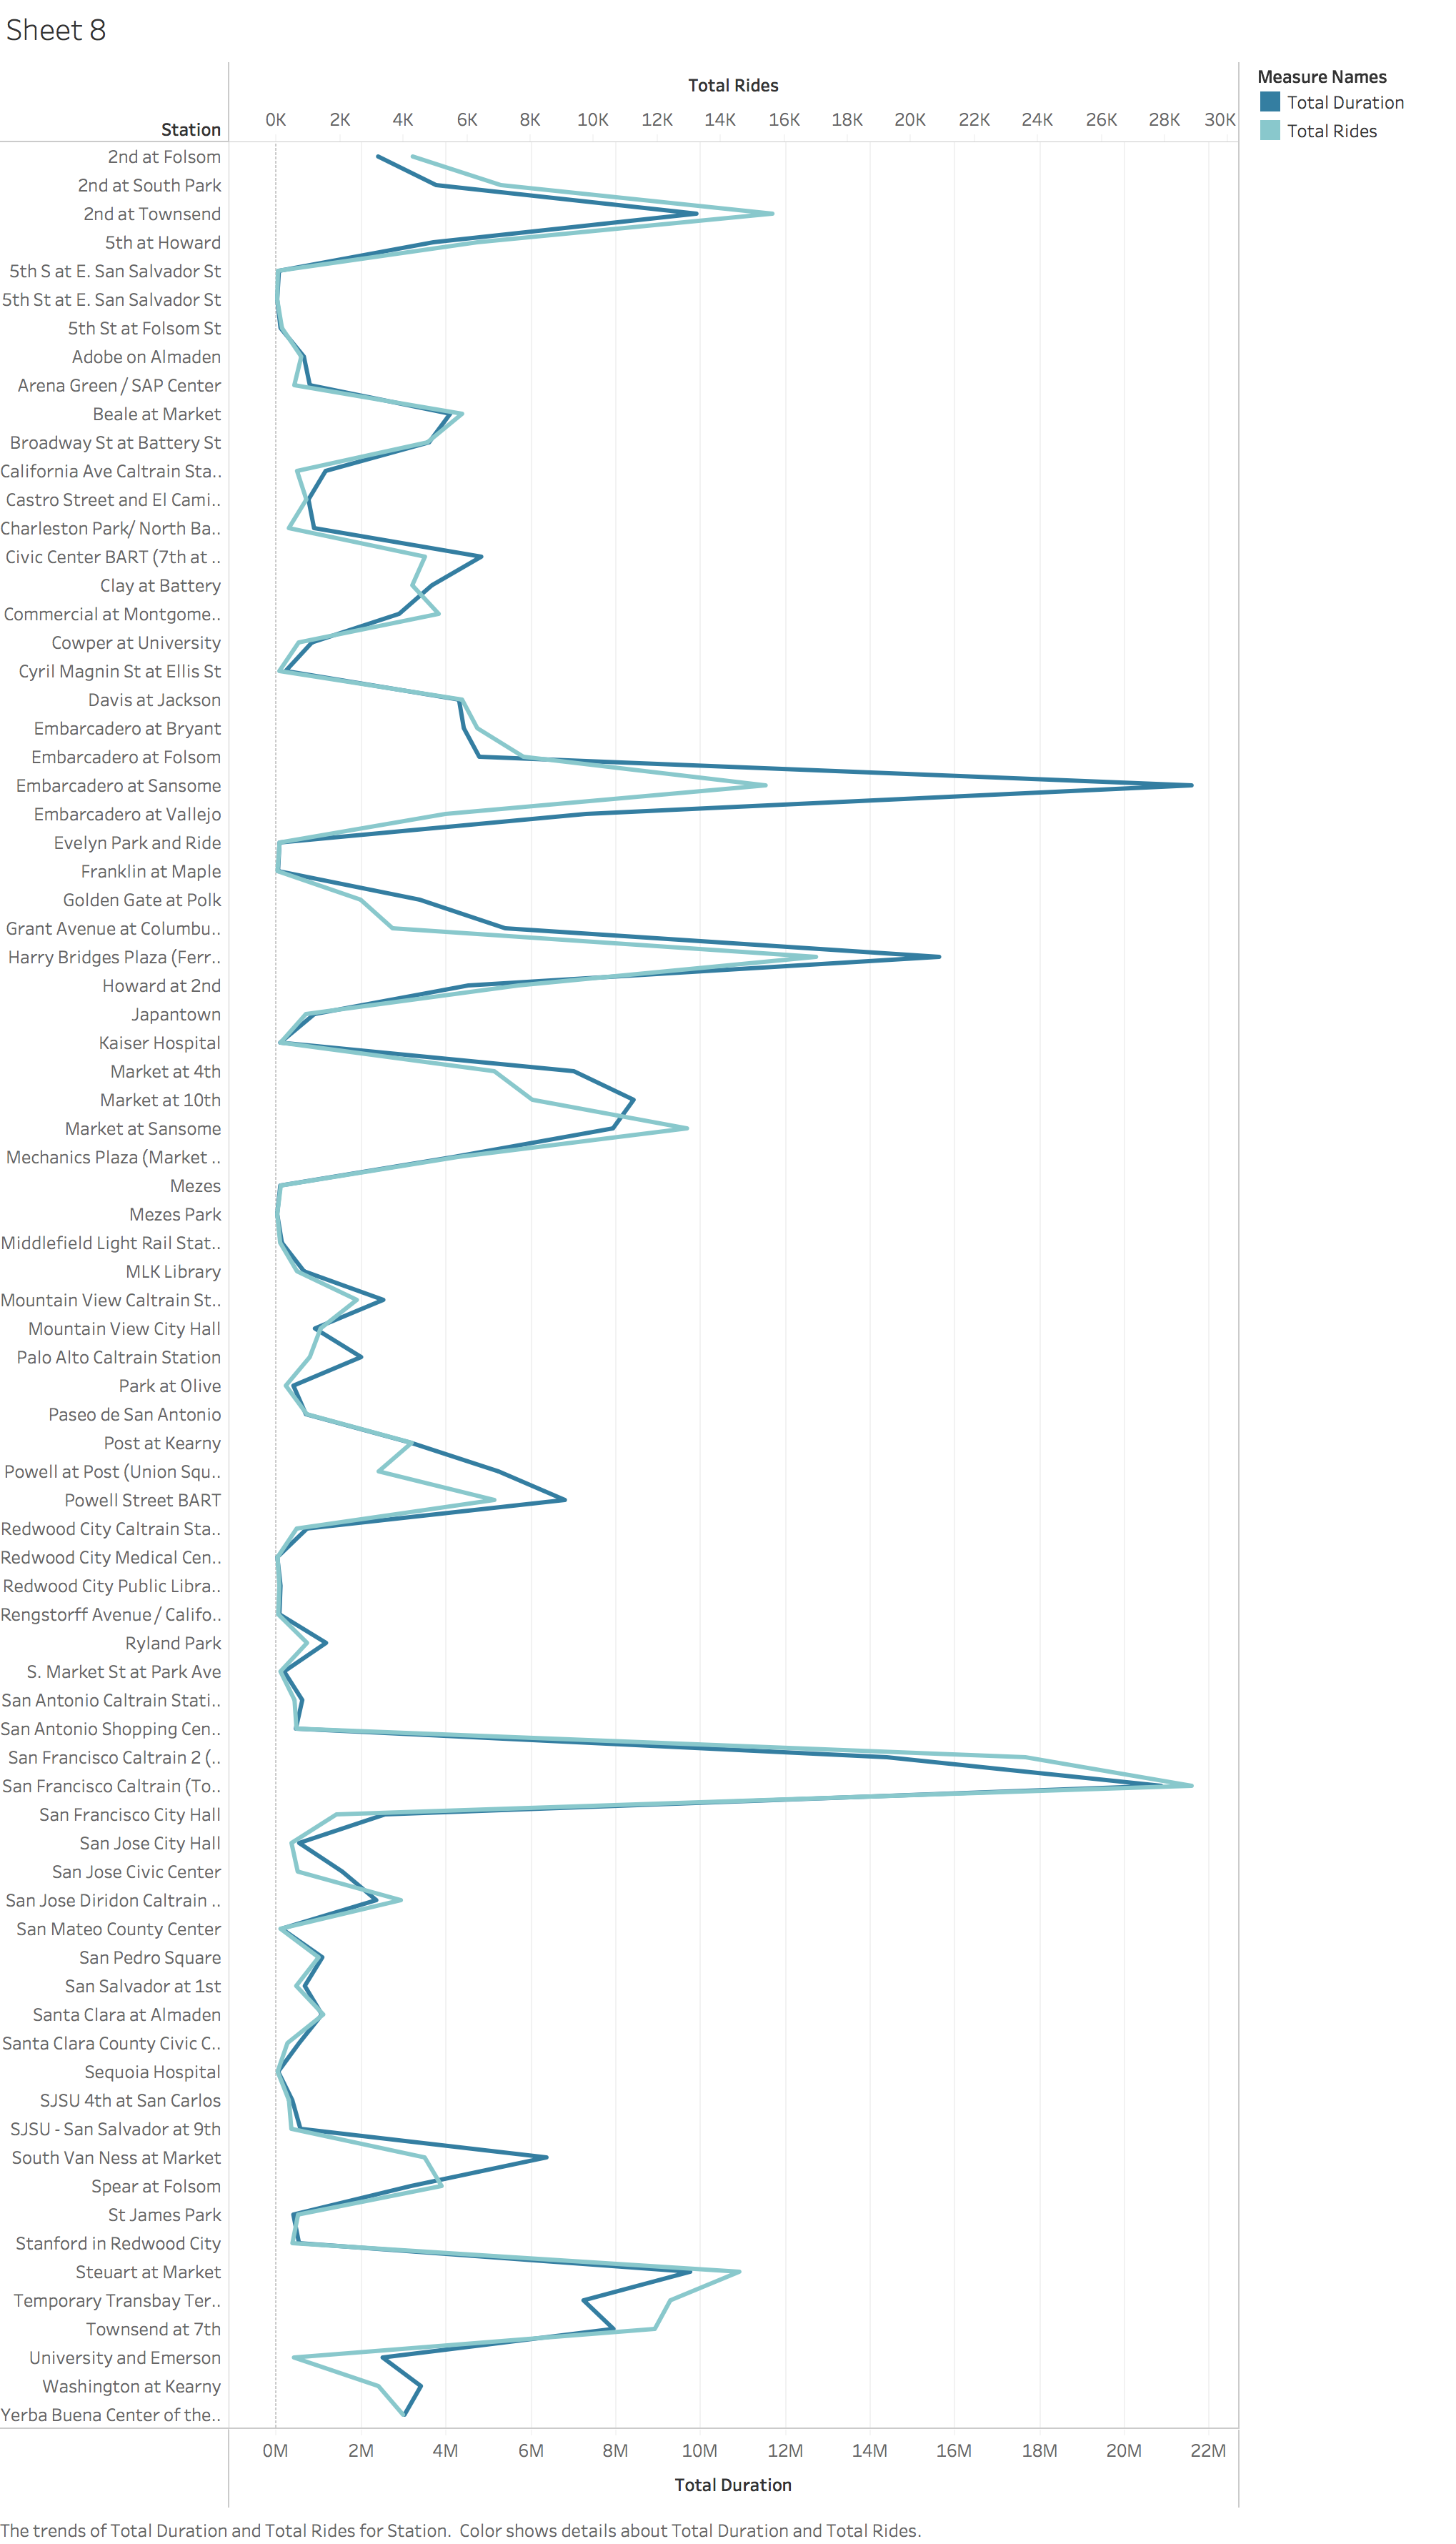
Analysis 8: Using Pig to find duration of trip for end station, total trips started and average trip duration
A similar pig query is used to determine data associated with the end station.
- Group data
split_station = GROUP tripdata BY end_station;
- Aggregate data
results = FOREACH split_station GENERATE GROUP AS end_station, SUM(tripdata.duration), AVG(tripdata.duration), count(trip_id);
- Store data
STORE results INTO '/Users/mansijain/Desktop/BABS-Dataset/results/end_stn' USING PigStorage(',');
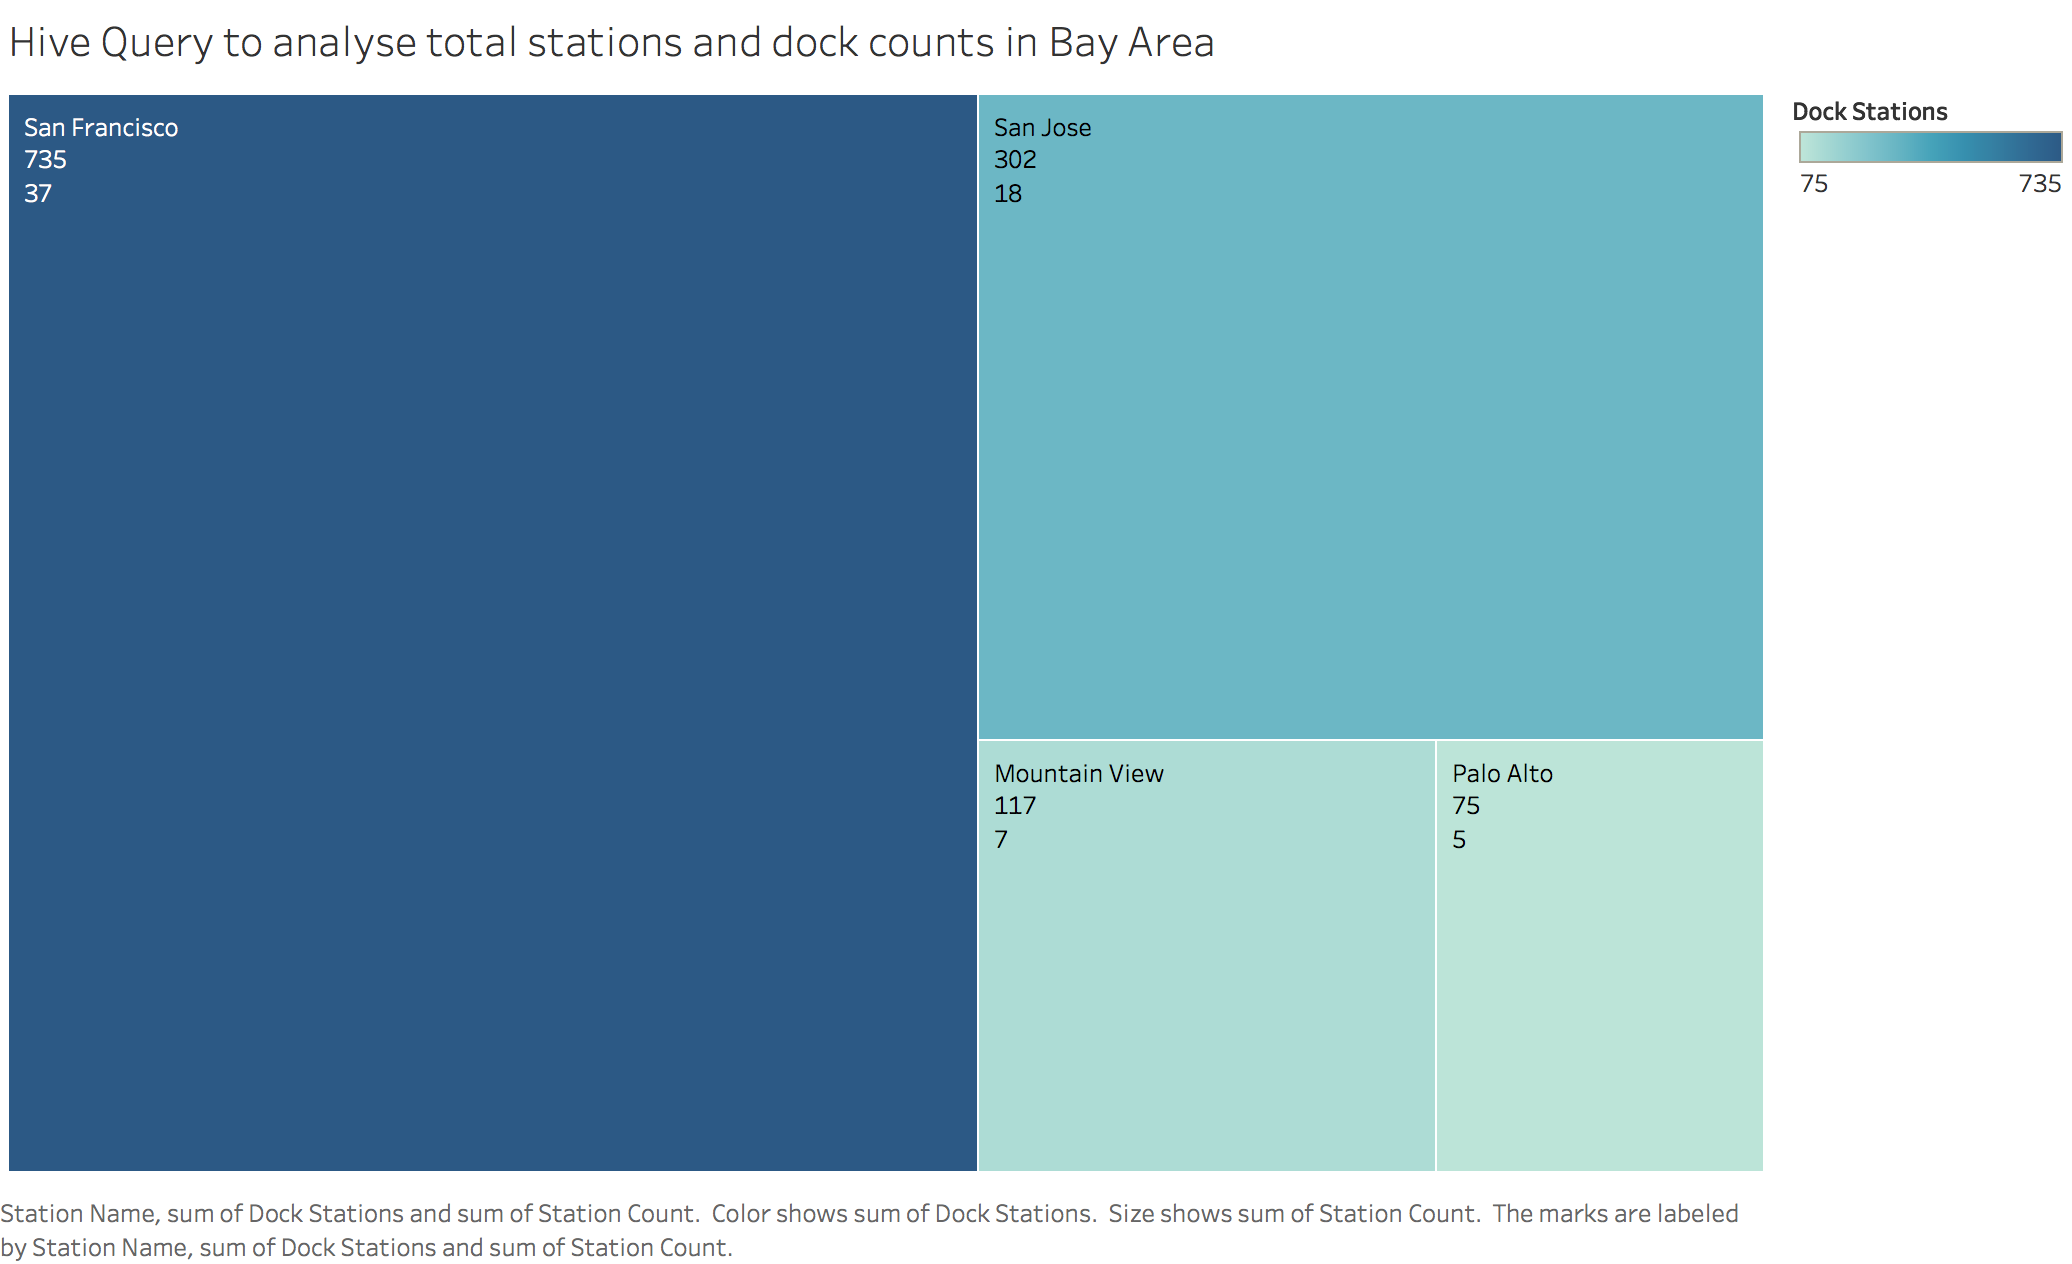
I have used Hive for this analysis. Following are the steps I followed:
- Create table
CREATE TABLE stationTable (id int, name string, lat double, long double, dock_count int, landmark string, date_inst date) row format delimited fields terminated by ',' STORED AS TEXTFILE;
- show tables
show tables;
- Insert vales
INSERT OVERWRITE local directory '/Users/mansijain/Desktop/BABS-Dataset/hive' ROW FORMAT DELIMITED FIELDS TERMINATED BY ',' SELECT landmark, count(id), sum(dock_count) FROM stationTable GROUP BY landmark;
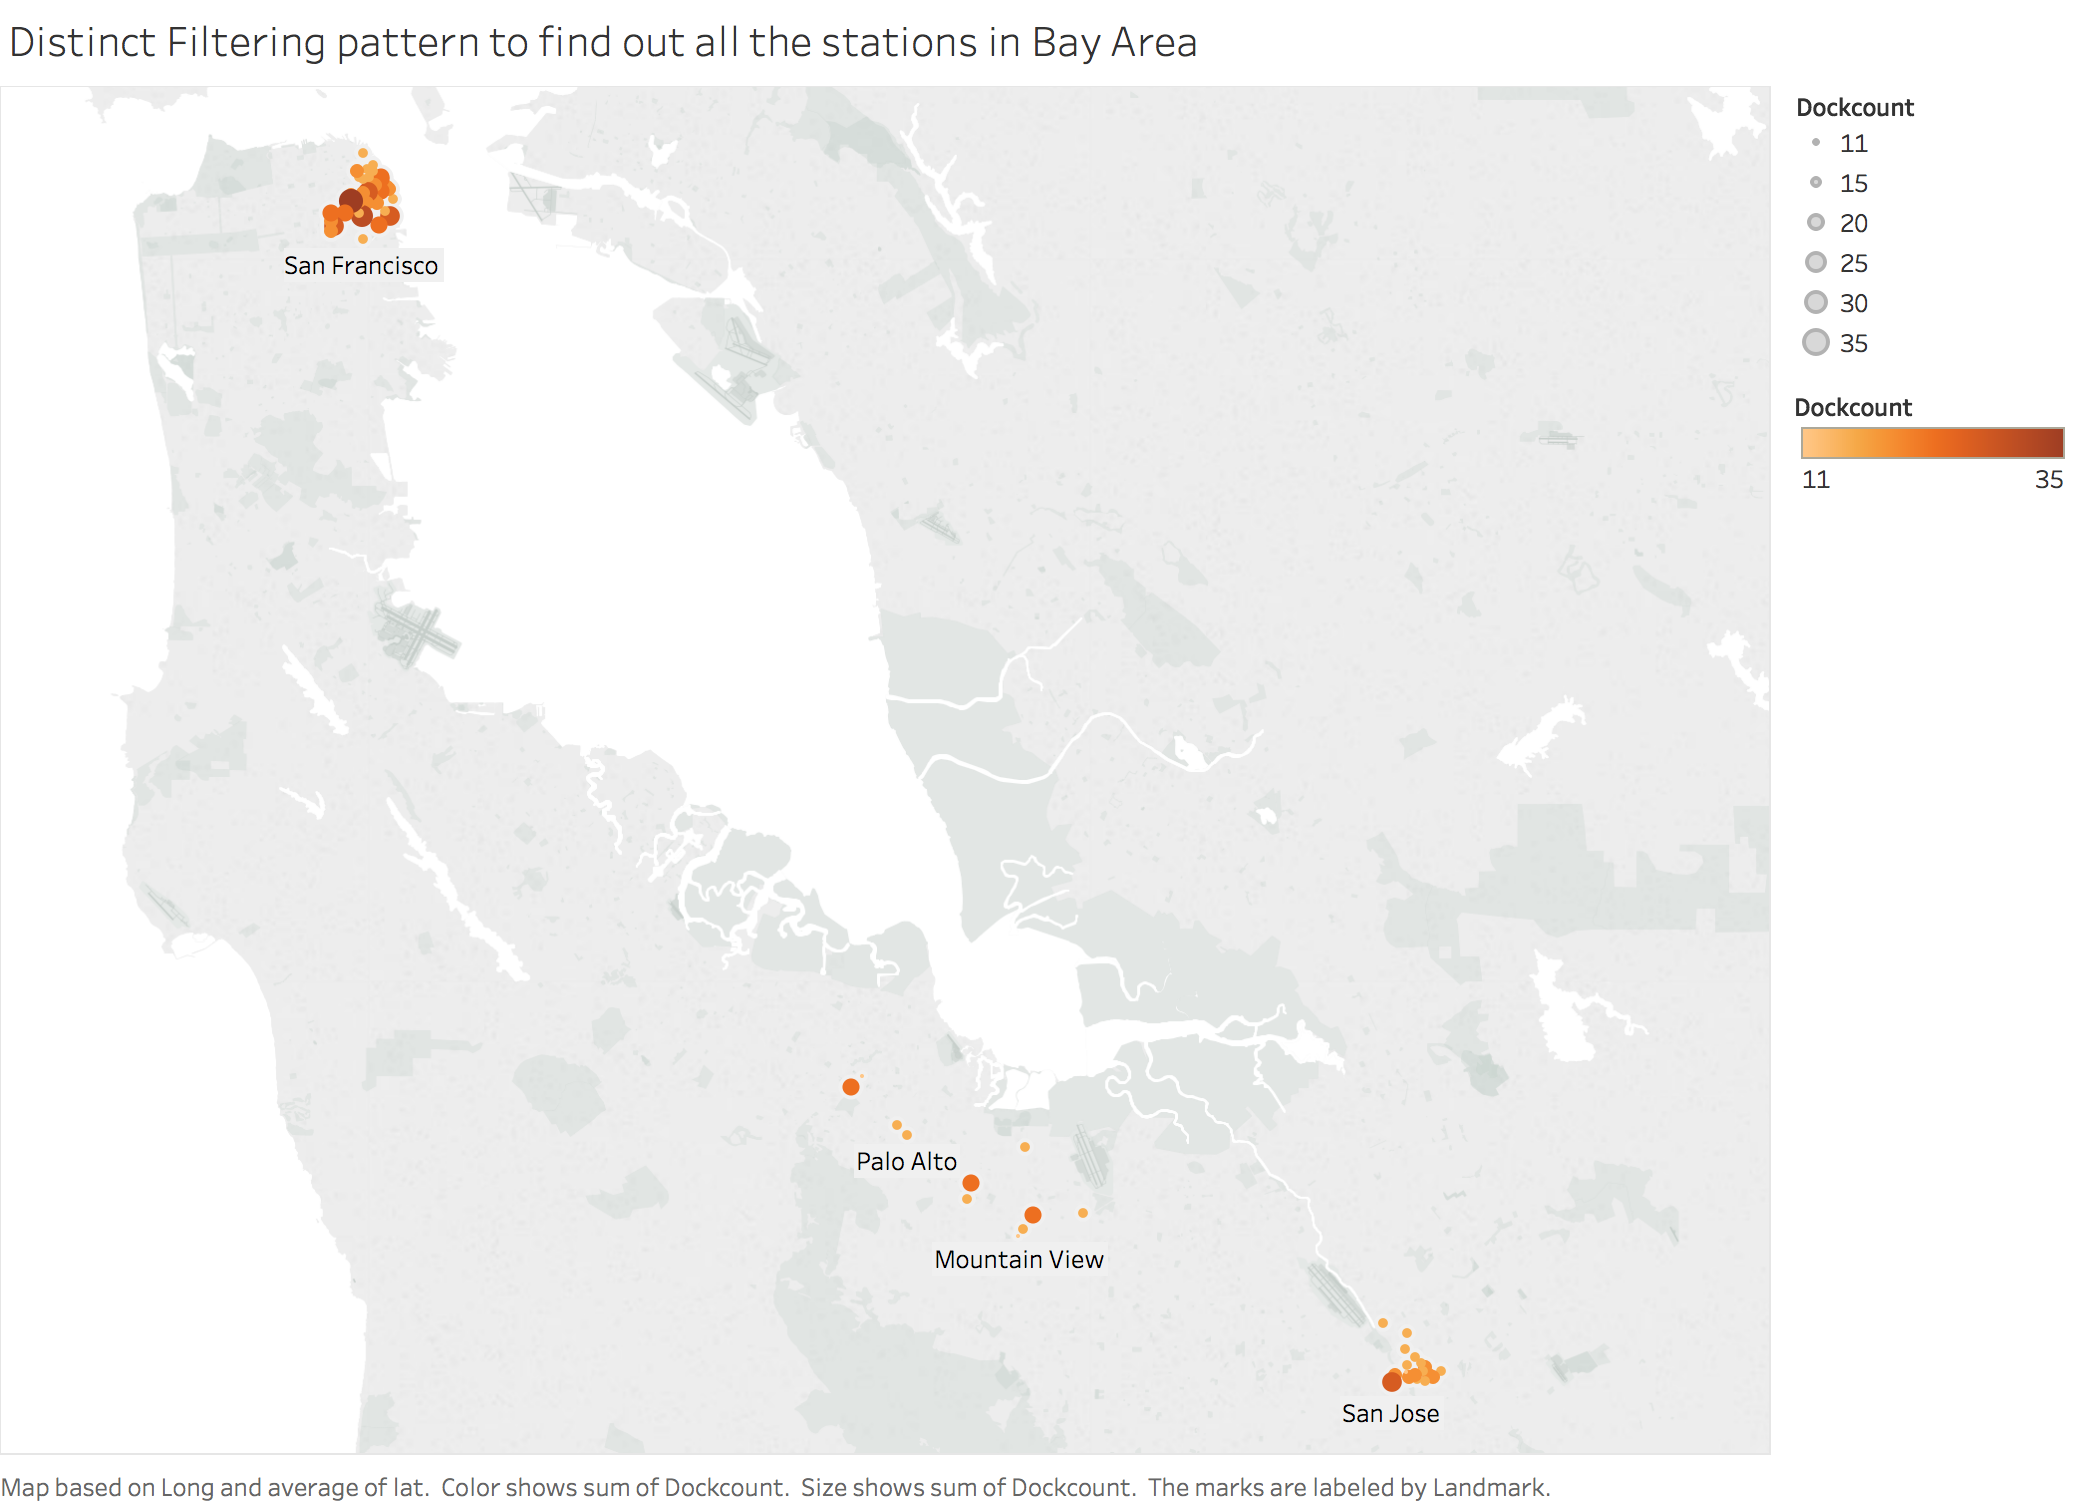
Using distinct filtering pattern, I analyzed all the stations present in the bay area. I have utilized latitude and longitude column to visually see the locations on a geomap.
The following analysis determines the sum of all the rides between two stations. I used composite keys to determine these values.
